
CFDs and Spread Bets are complex instruments and come with a high risk of losing money rapidly due to leverage. 72.65% of retail investor accounts lose money when trading CFDs and Spread Bets with this provider. You should consider whether you understand how CFDs and Spread Bets work and whether you can afford to take the high risk of losing your money.


 Login


SEARCH
-
Search query too short. Please enter a full word or phrase.
-

Keywords
Popular Search


SEARCH
-
Search query too short. Please enter a full word or phrase.
-
Keywords
Popular Search



 Market Analysis Daily Analysis Why Brent Crude Oil Slipped as Iran Talks Cooled Strike Fears – UKOUSD and USOUSD Analysis
Brent Crude Oil NewsCommoditiesCommodities NewsCommodity Market NewsCrude Oil News TodayEconomic News TodayIran NewsOil NewsOil Price News TodayTechnical AnalysisVantage NewsWTI Crude OIl News
Why Brent Crude Oil Slipped as Iran Talks Cooled Strike Fears – UKOUSD and USOUSD Analysis

Vantage Editorial Team >
3 November 2026 | Daily Analysis | 19 min read
Vantage Editorial Team >
Vantage is a global, multi-asset broker with a team of in-house writers and market analysts who produce educational and insightful trading content for traders of all levels.

- Brent (Vantage UKOUSD) traded at $114.95 at 10:07 (GMT+8) on 2 November 2026, about 3.24% below its 30 October high near $118.80.
- WTI (Vantage USOUSD) traded at $102.00, about 3.41% below its 30 October high near $105.60.
- The Brent vs WTI gap stood at $12.95 on the Vantage feed, against roughly $13.20 at each benchmark’s 30 October high; in futures, the like-for-like gap held near $9.30.
The Brent crude oil price slid about 3.24% from Friday’s high to $114.95 by 10:07 (GMT+8) on 2 November 2026, after Iranian officials held a third straight day of talks with Qatari mediators in Doha.1 The WTI crude oil price fell by a similar margin. And the $13 gap between the two? It barely twitched.
That last detail is the one we kept coming back to. A 3% drop looks like oil shedding its nerves; a spread that refuses to move says only one set went quiet. Here is which one, and what it changes for oil exposure into Tuesday’s US midterms.
Quick Answer:
Brent crude oil slipped 3.24% to $114.95 by 10:07 (GMT+8) on 2 November 2026 as Iran’s Qatar-mediated talks eased fears of new US strikes. WTI fell by a similar margin, to $102.00, yet Brent’s premium over WTI barely changed, suggesting shipping costs stayed priced in.
So where are oil prices today? On the Vantage feed at 10:07 (GMT+8), the Brent crude oil price today sat at $114.95, 0.17% lower on the hour, and the current WTI crude oil price was $102.00, down 0.26%. That leaves the crude oil price today about 3% under Friday’s peak. These are snapshots, not a Brent crude oil price live feed, so oil price live and WTI crude oil price live screens have likely moved on.
Crude Oil News: Doha Talks Cool US Strike Fears
The crude oil news that moved the needle came out of Washington first. President Donald Trump told Israeli Prime Minister Benjamin Netanyahu he wanted to give diplomacy with Tehran more time before considering further strikes after the 3 November midterms, according to an Axios report cited by The National.2
Then came Doha. Iranian Foreign Minister Abbas Araghchi called the talks ongoing and progressing, Reuters reported,1 while officials weighed a two-day plan to restore transit through the Strait of Hormuz, with no outcome yet, AGBI reported.3
The shipping lanes did not get the memo. UK Maritime Trade Operations (UKMTO) received a report on Sunday of a ship struck by a projectile in the Strait, after an attack on a liquefied natural gas (LNG) tanker on Friday.2
Producers kept their hands in their pockets. The seven core OPEC+ members held December production requirements at September levels on 1 November,4 with most Gulf members still pumping below their quotas because of export disruption, Reuters reported.5 Our crude oil news today and oil news pages log these headlines as they land.
All this followed a big month: Brent and WTI rose about 15% and 12% in October, according to The National,2 and Bloomberg noted that Brent reached a six-month high even as crude flows through Hormuz revived.6
Fading strike fears explain the direction of Monday’s move. The hourly charts show how far it went, and where it paused.
Brent Crude Oil Price Chart: Back at the 200-Hour Line
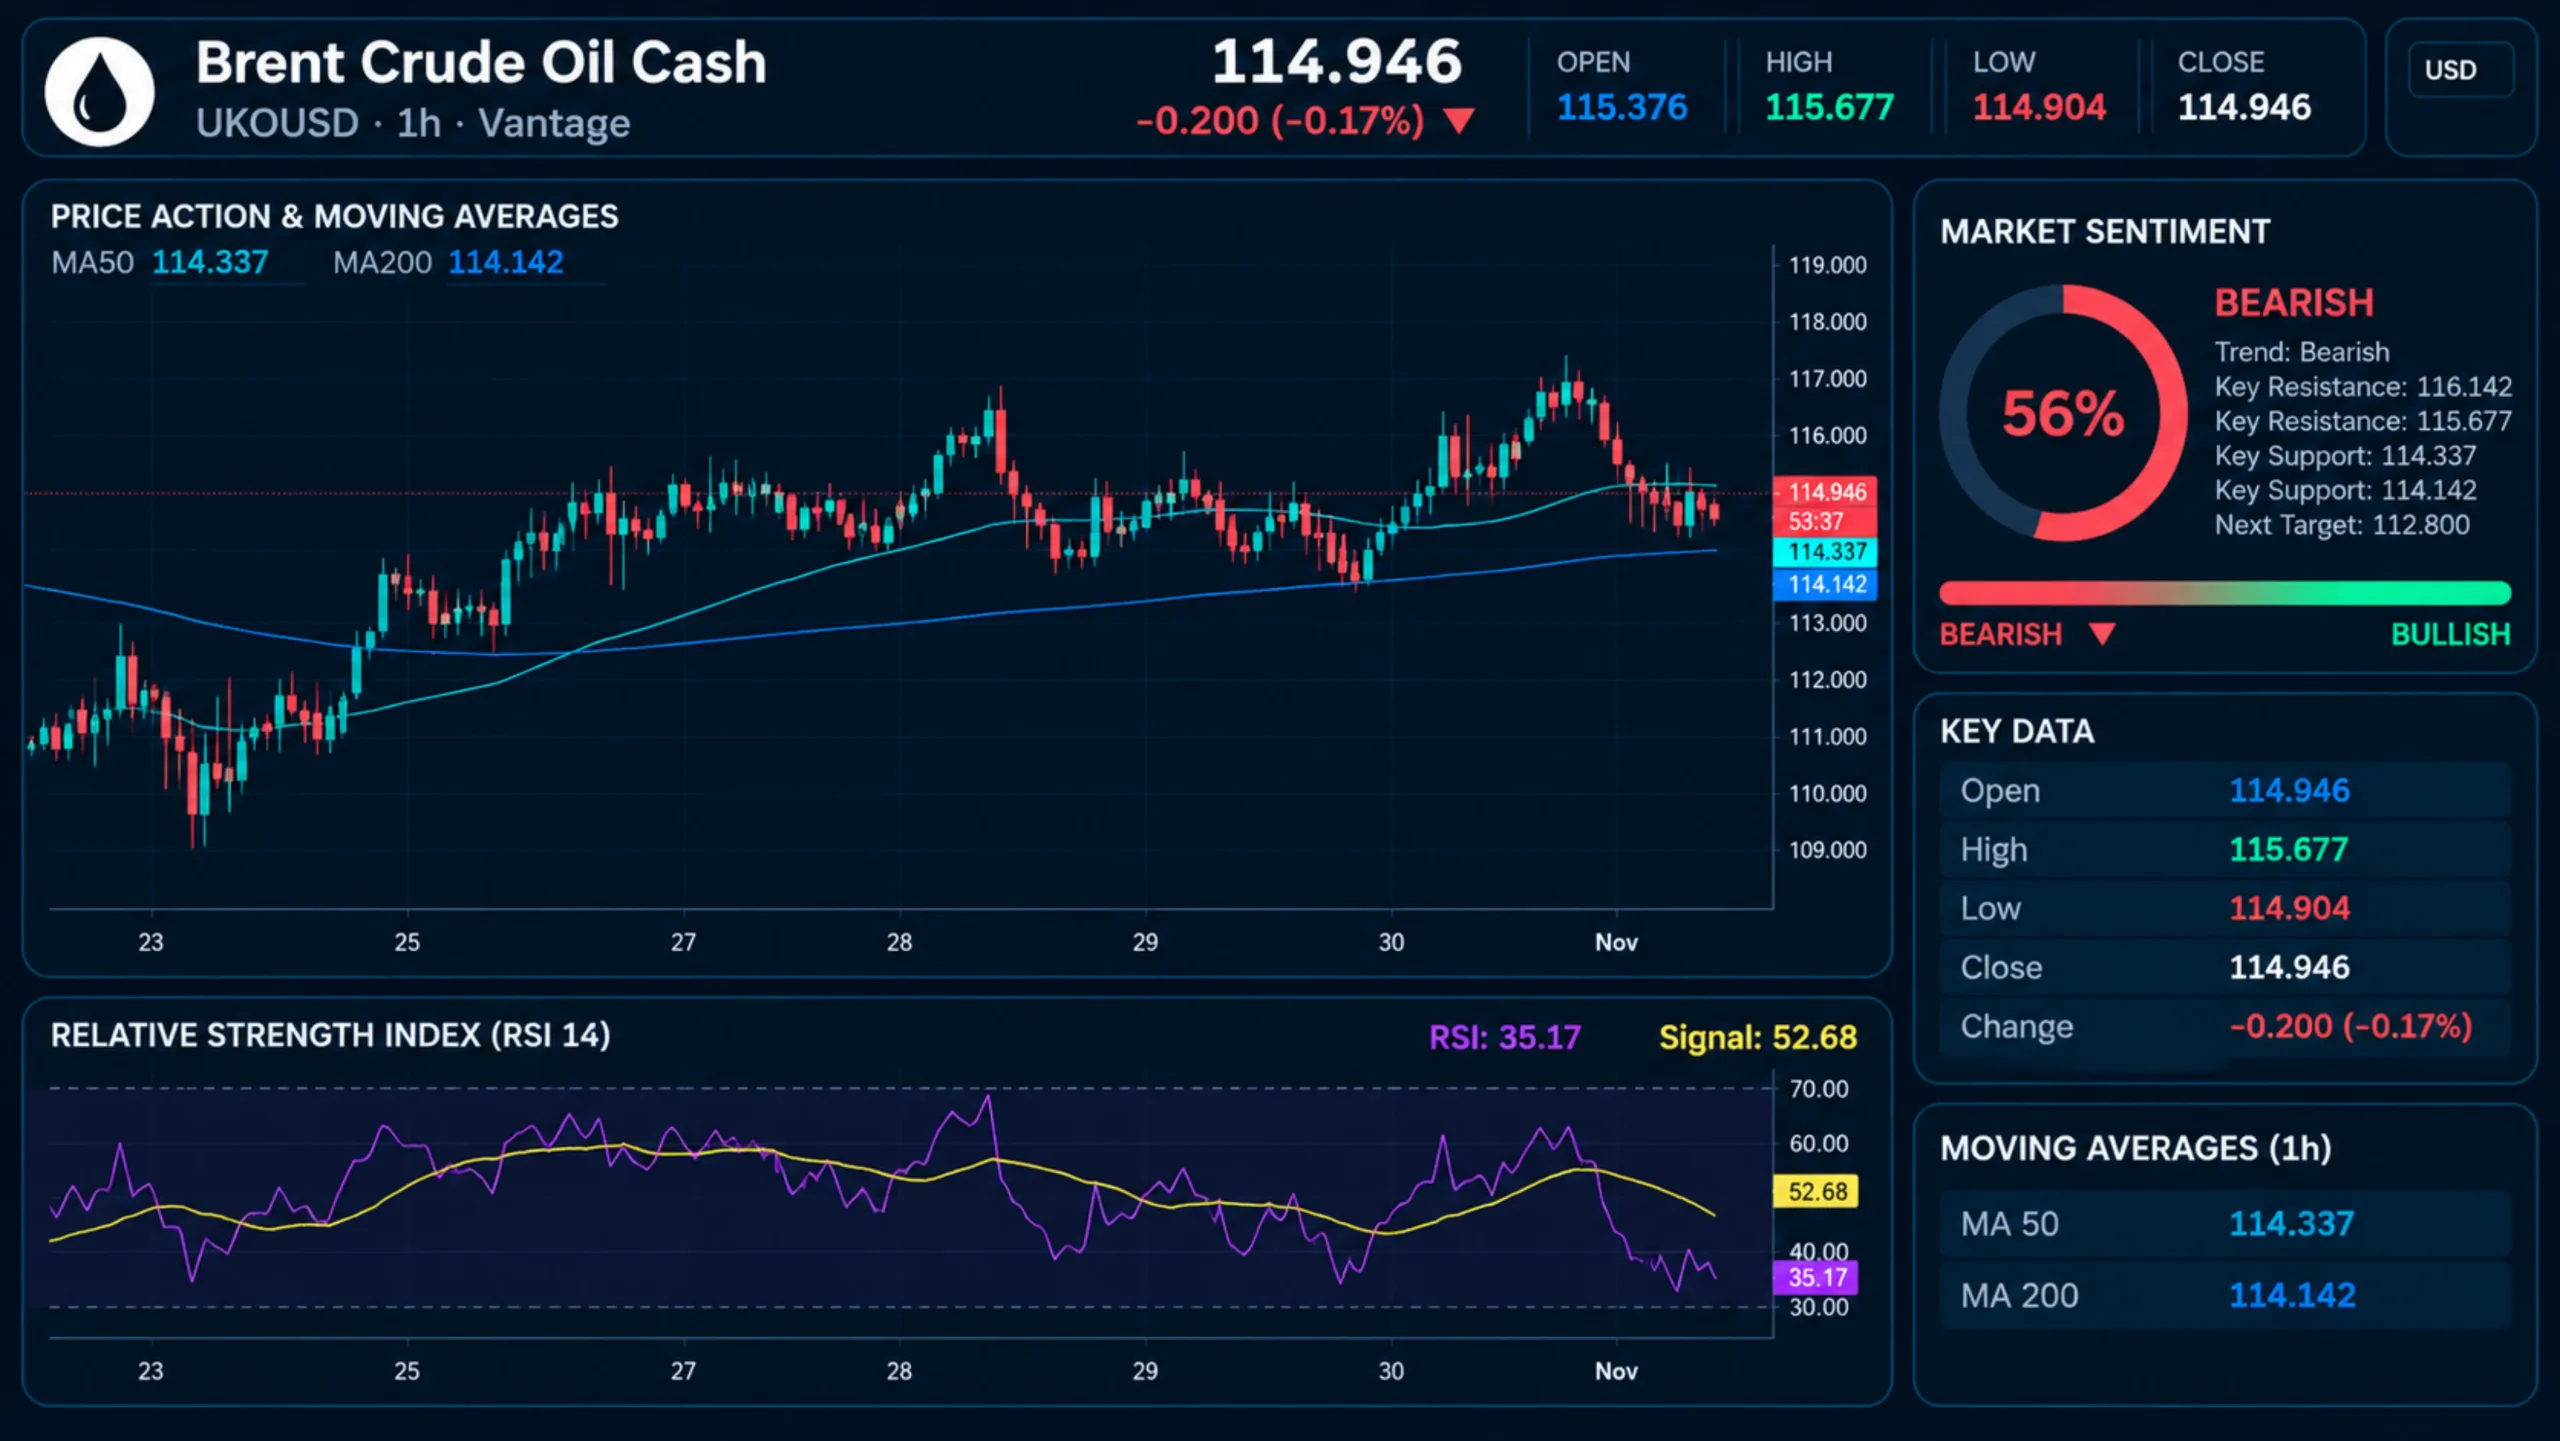
On the hourly Brent crude oil price chart, UKOUSD gave back about $3.85 from the high near $118.80 it set late on 30 October. By 10:07 (GMT+8) on 2 November, the Brent crude price today sat at $114.95, below the 50-period moving average (MA) at $116.14 and just above the 200-period MA at $114.34.
That 200-period line has climbed steadily since 22 October, and as of 10:07 (GMT+8) price had pulled back to it without trading below it. The week’s range ran from a low near $113.70 on 29 October to Friday’s high.
Momentum, though, faded faster than price. The 14-period Relative Strength Index (RSI) read 35.17 on the TradingView setup used for this analysis, its lowest in the window and below its 52.68 signal average. Soft, not oversold; that label starts at 30.
Read alone, the Brent price today shows a tidy pullback to support, and our Brent crude oil news page tracks the backdrop. The real clue, though, is next door.
WTI Crude Oil Prices Trace the Same Path
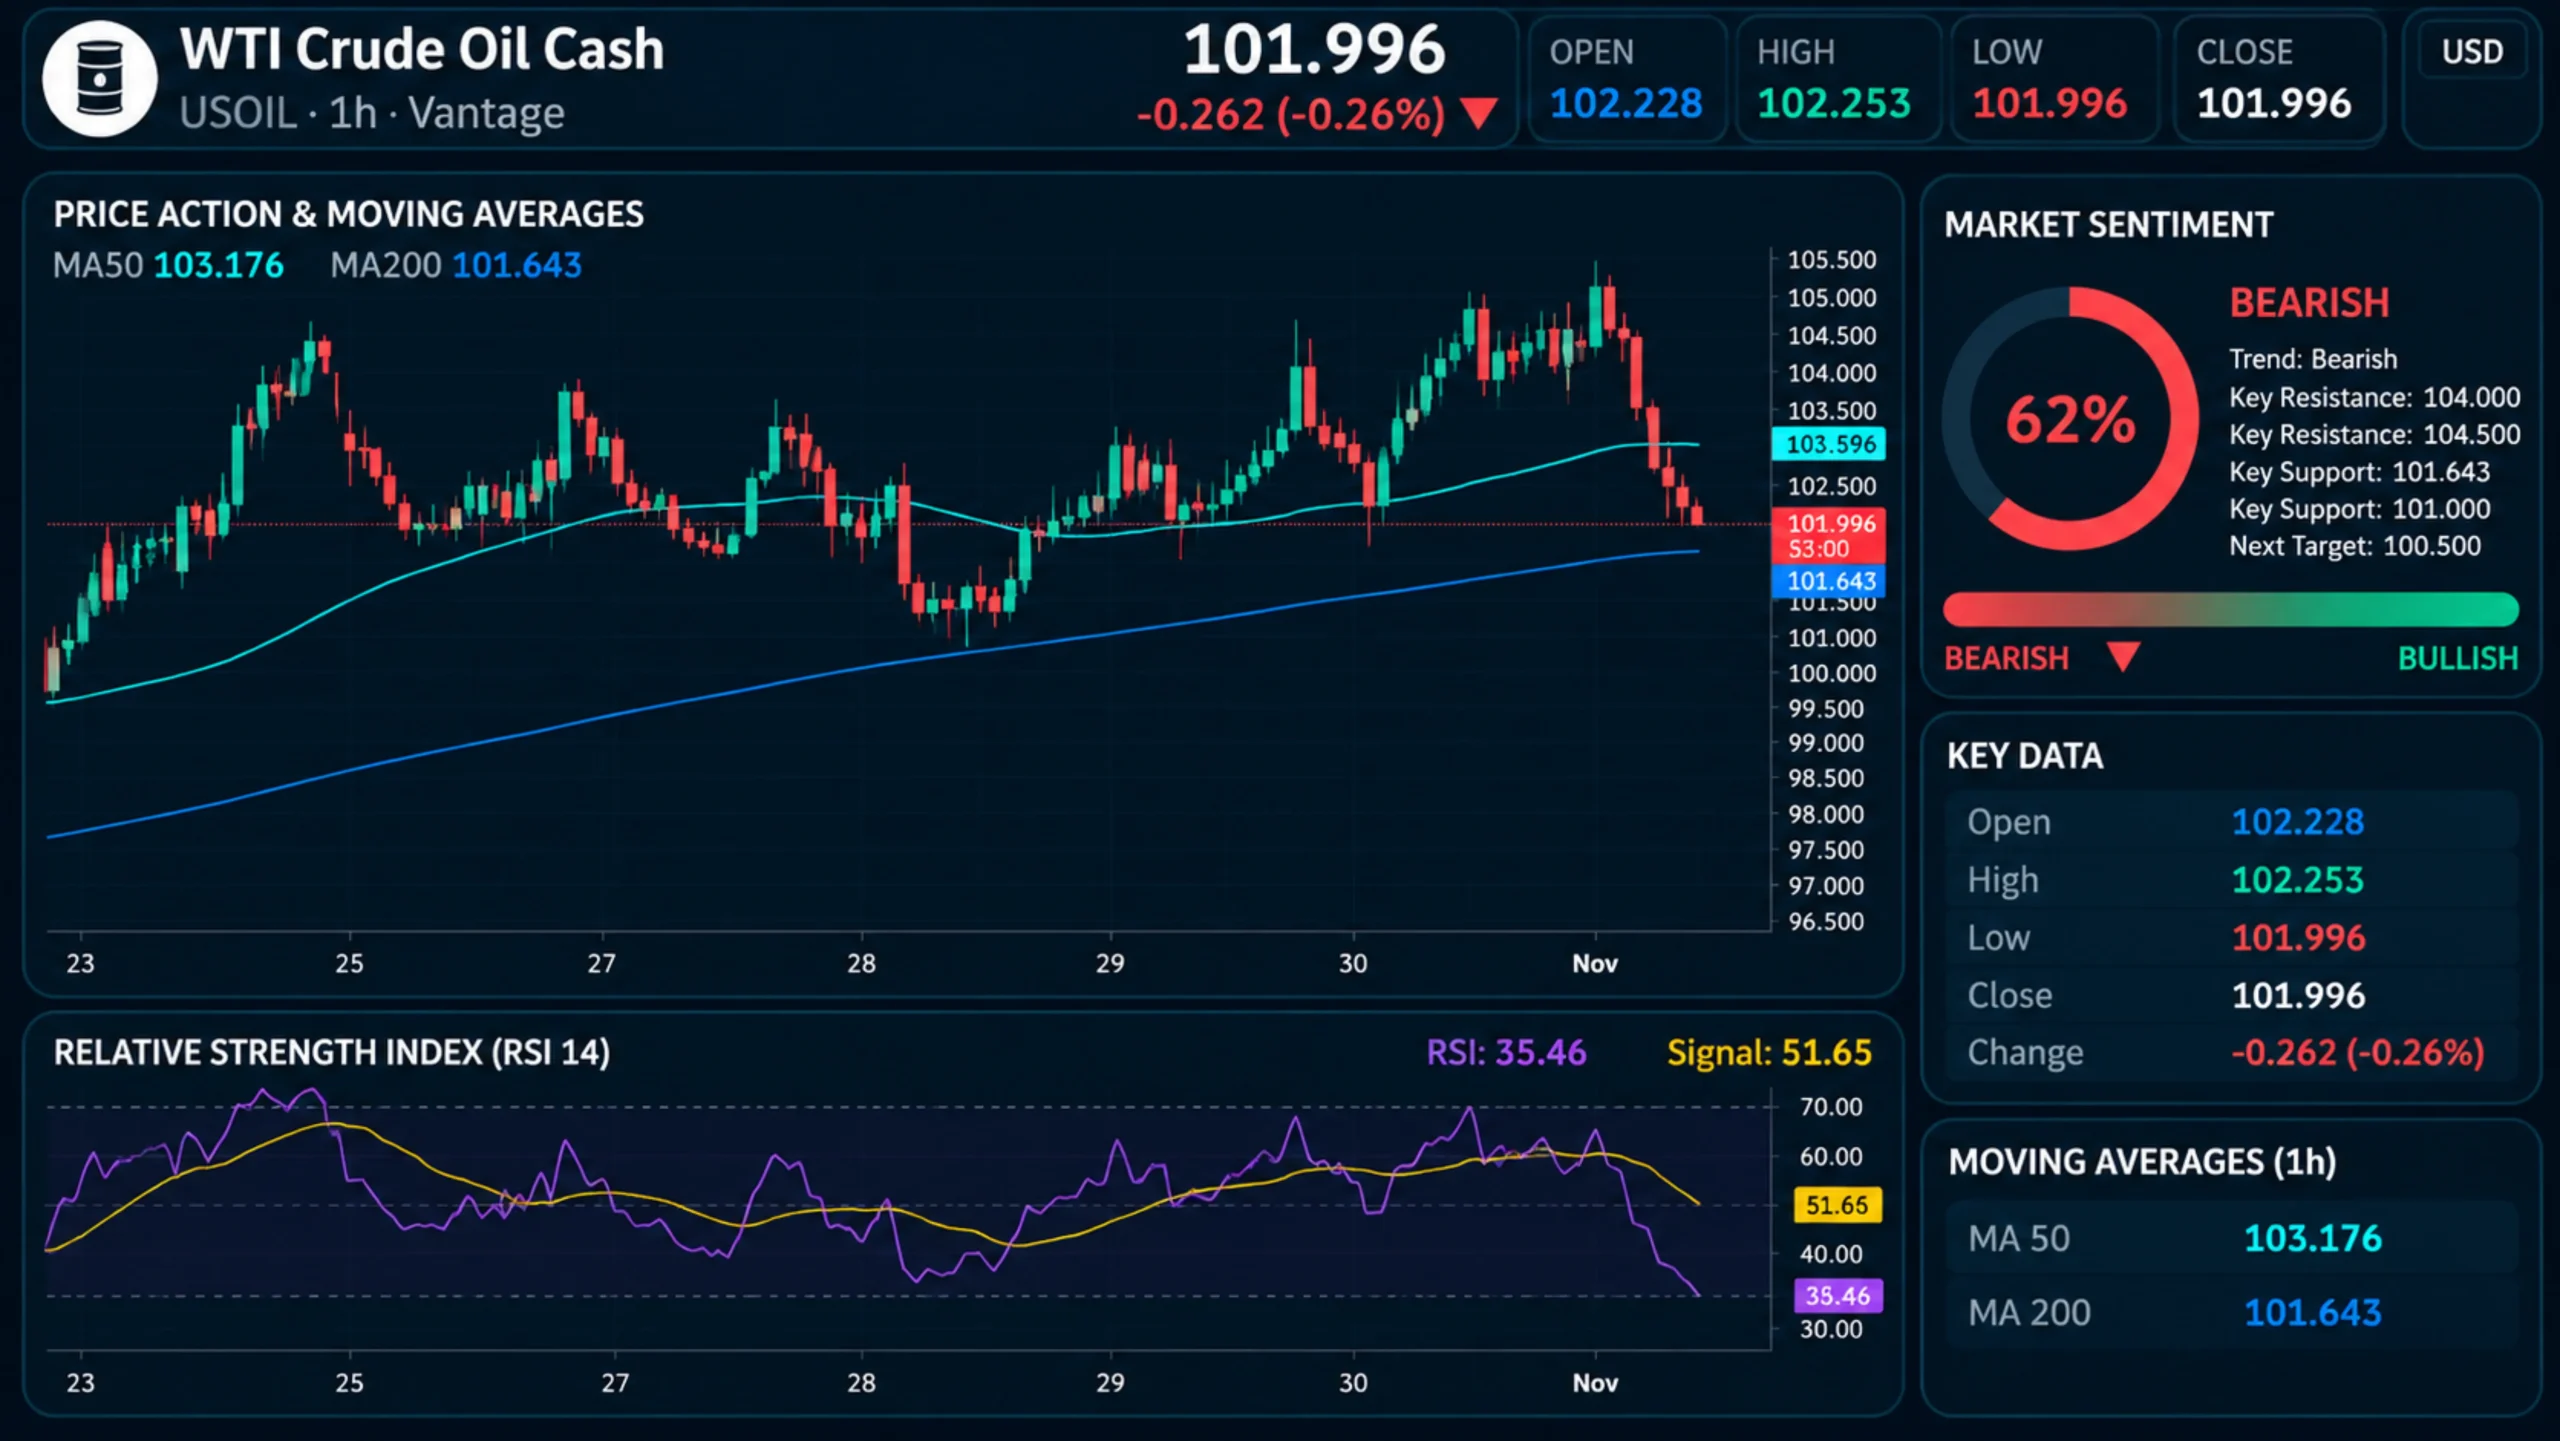
WTI crude followed nearly the same script. The WTI crude oil price today stood at $102.00 at 10:07 (GMT+8), down about $3.60 from a high near $105.60 on 30 October, below its 50-period MA at $103.18 and just above its 200-period MA at $101.64. RSI read 35.46 on the same TradingView setup, against a signal average of 51.65.
Lay the two charts side by side and mostly the price axis changes. The WTI oil price found a floor near $100.20 on 27 October, and the WTI price today rests on its 200-hour line with weak momentum, just like Brent. Our WTI crude oil news page follows the US benchmark.
Neither chart explains the move on its own. The answer lives in the space between them.
Brent vs WTI: The $13 Gap That Held
Here is the first sum we did this morning. At 10:07 (GMT+8), Brent traded $12.95 above WTI on the Vantage feed, against about $13.20 when each set its 30 October high. Measured from those highs, Brent fell about $3.85 and WTI about $3.60, so only about $0.25 of Brent’s premium came off a move worth nearly $4. Not glamorous maths, but probably the most useful line here.
The futures market tells the same story. Comparing like with like, January Brent settled $9.31 above December WTI on Friday, at $113.43 against $104.12. By 00:11 GMT on Monday, after both had fallen about $1.60, the gap was $9.28, according to Reuters prices.1 The dollar size of the gap differs between futures and the Vantage cash feed because they reference different points on each curve, but on both measures it barely moved.
The two benchmarks price different risks. The Brent oil price reflects seaborne crude that competes with Gulf barrels for tankers and insurance, while crude oil WTI is priced at an inland US hub in Cushing, Oklahoma,7 far from Middle East shipping lanes.
Analysts have tracked this split all year. When attacks on Middle East energy sites widened the WTI discount to its widest in 11 years in March, Sparta Commodities analyst Neil Crosby said infrastructure risk “tends to be reflected in Brent over WTI.”8 By the end of September, Standard Chartered’s energy research head Emily Ashford still put the discount above $12, “its widest since early May.”9
One way to read the gap is as a price tag on moving oil by sea. When Brent’s premium over WTI is wide enough, US crude becomes worth shipping to overseas buyers, which is why a wider spread tends to draw out more US exports, Reuters reported in March.8 Tanker attacks have been driving up global shipping costs, Reuters reported on Monday,1 so that price tag stays high. Fear of new strikes works differently: it moves the price of crude everywhere, taking both benchmarks up or down together.
Read that way, Monday looks like markets trimming the odds of renewed US strikes, which moved both benchmarks, while the shipping costs that hold the gap open stayed put. ING analysts described recent price action as a market “increasingly bracing for the potential for more hostilities.”10
The strike premium came out of both benchmarks on Monday. The Brent premium over WTI did not.
Named forecasts lean on the same theme. UBS expects Brent to stay near $110 a barrel at year-end as Middle East supply remains volatile, and commodity analyst Giovanni Staunovo listed “record freight costs, constrained tanker capacity, and recovering Chinese imports” as further factors in a Brent crude forecast that keeps prices high.2 For a wider crude oil forecast, the US Energy Information Administration’s October outlook put Brent at averages of $96 for 2026 and $84 for 2027.11 That Brent oil forecast is now a month old; the next update, with a fresh WTI forecast, is due on 10 November.12 We add no oil price prediction of our own; any oil price forecast is only as good as its Hormuz assumptions.
One honest caveat: export flows, refinery margins, and freight rates also move the spread, so a steady gap can have more than one explanation.
Why Brent Futures Looked Worse Than the Chart
If your screen showed Brent futures down more than $5 from Friday, it overstated Monday’s move. The December Brent crude oil futures contract expired on 30 October after settling at $117.64.13 Monday’s wire quotes refer to January, which fell $1.59 to $111.84 in early Asia trade, implying a Friday settlement of $113.43.1
The December contract did not fall on Monday; it retired on Friday and January took its seat. That $4.21 gap at expiry describes a backwardated curve, where nearer barrels cost more, a shape that tends to appear when prompt supply is tight. WTI crude oil futures run on a separate expiry calendar, so when comparing crude oil futures, WTI futures, and cash quotes, check which contract each screen shows; quotes for futures, WTI crude oil cash, and settlements rarely match.
If shipping risk kept Brent’s lead intact, the coming weeks are its test.
Brent vs WTI at a Glance: Levels and Dates to Watch

Brent vs WTI Comparison as of 10:07 (GMT+8), 2 November 2026
| Metric | Brent Crude Oil (UKOUSD) | WTI Crude Oil (USOUSD) |
| Benchmark Role | Global seaborne benchmark | US inland benchmark (Cushing, Oklahoma) |
| Exposure to Hormuz Shipping | Higher | Lower |
| Last Price | $114.95 | $102.00 |
| Recent High (30 October) | Near $118.80 | Near $105.60 |
| Move From Recent High | -3.24% | -3.41% |
| H1 50-Period MA | $116.14 | $103.18 |
| H1 200-Period MA | $114.34 | $101.64 |
| Recent Low | Near $113.70 (29 October) | Near $100.20 (27 October) |
| H1 RSI (14) | 35.17 | 35.46 |
| Brent Premium Over WTI | $12.95 | – |
Prices and levels read from the Vantage UKOUSD and USOUSD H1 charts on TradingView as of 10:07 (GMT+8) on 2 November 2026; Cushing pricing hub per FRED. Data indicative, for informational purposes only.
It is a week in which the calendar may do more talking than the chart. These are the dates on our radar, and our oil price news today page carries the reaction as each one lands:
- US Midterm Elections, Tuesday 3 November: Reports tie any decision on further strikes to after the vote.2
- EIA Weekly Petroleum Status Report, Wednesday 4 November, 23:30 (GMT+8): US inventories bear more on WTI, a check on US-specific spread moves.
- US Nonfarm Payrolls, Friday 6 November, 21:30 (GMT+8): A demand read for both benchmarks and the dollar.
- EIA Short-Term Energy Outlook, Tuesday 10 November (US Time): Updated supply, demand, and price outlook.12
- OPEC+ Meetings, Sunday 29 November: Core members meet again,4 with 2027 quotas expected.5
What would change the read? A sharp narrowing of the Brent vs WTI gap while both prices fall would suggest the seaborne premium itself is going; the International Energy Agency has warned of a surplus if Gulf flows through Hormuz return to pre-war levels.3 A widening gap on fresh tanker attacks would point the other way. On the charts, a sustained break from the 200-hour averages, in either direction, would show momentum doing something it is not doing now.
Brent and WTI: Questions Readers Ask
What Is Brent Crude Oil?
Brent is the benchmark for seaborne light, sweet crude, and The National reported it prices about two thirds of the world’s crude.2 Our oil trading guide explains how Brent and WTI contracts work.
What Is WTI Crude Oil?
WTI, or West Texas Intermediate, is the US benchmark, priced at Cushing, Oklahoma,7 and less exposed to sea routes than Brent.
Why Is Brent More Expensive Than WTI Right Now?
Brent prices seaborne crude, so it carries more of the cost and risk of Gulf shipping. At 10:07 (GMT+8) on 2 November 2026, Brent traded $12.95 above WTI on the Vantage feed, while the like-for-like futures gap was about $9.30 early on Monday.1 Our commodity market news page tracks the gap as it moves.
Managing Oil Risk Into the Midterms
Monday’s 3% slide looked like oil pricing out danger. The stubborn $13 gap between Brent and WTI suggests markets priced out only one kind, the risk of new US strikes, and kept the kind tied to shipping costs in the Gulf. Whether that split survives Tuesday’s vote and the next round of talks in Doha is the question the coming sessions now test.
Both benchmarks moved more than $3.50 between Friday’s highs and Monday morning, partly across a weekend when markets were shut but headlines kept coming. A Stop Loss order limits losses to a planned size in normal conditions, but it does not guarantee execution at the chosen level when prices gap, for example at a weekly open after weekend news. Sizing exposure with that gap risk in mind is part of how traders keep a single headline from dominating an account.
Leveraged products magnify losses as well as gains, so a 3% move in the underlying oil price can mean a much larger change in account balance. Position size relative to account equity, rather than the size of the move a trader expects, sets how much a swing like Monday’s can affect an account balance, and margin requirements can change when volatility rises.
Related Reading
RISK WARNING: CFDs are complex financial instruments and carry a high risk of losing money rapidly due to leverage. You should ensure you fully understand the risks involved and carefully consider whether you can afford to take the high risk of losing your money before trading.
Disclaimer: The information is provided for educational purposes only and doesn’t take into account your personal objectives, financial circumstances, or needs. It does not constitute investment advice. We encourage you to seek independent advice if necessary. The information has not been prepared in accordance with legal requirements designed to promote the independence of investment research. No representation or warranty is given as to the accuracy or completeness of any information contained within. This material may contain historical or past performance figures and should not be relied on. Furthermore estimates, forward-looking statements, and forecasts cannot be guaranteed. The information on this site and the products and services offered are not intended for distribution to any person in any country or jurisdiction where such distribution or use would be contrary to local law or regulation.
References
[1] “Oil slips more than 1% as talks continue on ending Iran war – Business Recorder (Reuters)” https://www.brecorder.com/news/40446999/oil-slips-more-than-1-as-talks-continue-on-ending-iran-war Accessed on 2 November 2026.
[2] “Oil prices slide more than 3% as Trump signals more time for Iran diplomacy – The National” https://www.thenationalnews.com/business/2026/11/02/oil-prices-slide-more-than-3-as-trump-signals-more-time-for-iran-diplomacy/ Accessed on 2 November 2026.
[3] “Oil retreats as diplomacy raises hopes for Hormuz reopening – AGBI” https://www.agbi.com/oil-and-gas/2026/11/oil-retreats-as-diplomacy-raises-hopes-for-hormuz-reopening/ Accessed on 2 November 2026.
[4] “Saudi Arabia, Russia, Iraq, Kuwait, Kazakhstan, Algeria, and Oman reaffirm commitment to market stability – OPEC” https://www.opec.org/pr-detail/620-1-november-2026.html Accessed on 2 November 2026.
[5] “OPEC+ keeps December oil output targets steady amid Iran war – Honolulu Star-Advertiser (Reuters)” https://www.staradvertiser.com/2026/11/01/breaking-news/opec-keeps-december-oil-output-targets-steady-as-iran-war-disrupt-flows/ Accessed on 2 November 2026.
[6] “Oil Slides as Report Says Trump to Give Iran Diplomacy More Time – Energy Connects (Bloomberg)” https://www.energyconnects.com/news/oil/2026/november/oil-slides-as-report-says-trump-to-give-iran-diplomacy-more-time/ Accessed on 2 November 2026.
[7] “Crude Oil Prices: West Texas Intermediate (WTI) – Cushing, Oklahoma (DCOILWTICO) – FRED” https://fred.stlouisfed.org/series/DCOILWTICO Accessed on 2 November 2026.
[8] “US Oil Exports Seen Rising as WTI Discount to Brent Hits Widest in 11 Years – EnergyNow (Reuters)” https://energynow.com/2026/03/us-oil-exports-seen-rising-as-wti-discount-to-brent-hits-widest-in-11-years-2/ Accessed on 2 November 2026.
[9] “Analysts Look at WTI-Brent Spread – Rigzone” https://www.rigzone.com/news/analysts_look_at_wtibrent_spread-01-oct-2026-184747-article/ Accessed on 2 November 2026.
[10] “Oil prices ease 3% on optimism for Qatari-led talks on ending Iran war – Business Recorder (Reuters)” https://www.brecorder.com/news/40446999/oil-prices-ease-3-on-optimism-for-qatari-led-talks-on-ending-iran-war Accessed on 2 November 2026.
[11] “October 2026 Short-Term Energy Outlook – U.S. Energy Information Administration” https://www.eia.gov/outlooks/steo/archives/oct26.pdf Accessed on 2 November 2026.
[12] “Short-Term Energy Outlook Release Schedule – U.S. Energy Information Administration” https://www.eia.gov/outlooks/steo/release_schedule.php Accessed on 2 November 2026.
[13] “Oil jumps 2%, settles at 6-month highs on fears of escalation in Iran – CNBC” https://www.cnbc.com/2026/10/30/oil-rises-on-supply-concerns-as-houthis-attack-saudi-arabia.html Accessed on 2 November 2026.
Key Points In This Article

Latest Financial Market Analysis


Market Analysis Tags
- # USD News
- # USDCAD News
- # USDJPY News
- # USDX News
- # Forex News
- # Forex News Today
- # GBPUSD News
- # EURUSD News
- # Currency Trading News
- # AUDUSD news
Related Articles
- Why Qualcomm Stock Fell as Intel’s Memory Warning Hit Chipmakers – QCOM Analysis
- Why Uber Stock Rose Off Its 52-Week Low as Q3 Earnings Near – UBER Analysis
- Why the Australian Dollar Fell as the RBA Hiked to 4.85% – AUDUSD Analysis
- Why Nasdaq Rebounded as US Futures Rose Before the Midterms – NAS100 Analysis
- Why USD/JPY Stayed Range-Bound as Fed and BoJ Priced Similar December Hikes – USDJPY Analysis
- Why Brent Crude and WTI Fell as US-Iran Talks Eased Supply Fears – UKOUSD and USOUSD Analysis
- Gold Price Today: $100 Oil and Fed Hike Dissents, and What It Means for XAUUSD Traders
- Google Stock Price Falls 12%: Capex Tops Cash Flow and What It Means for GOOG CFD Traders