
CFDs and Spread Bets are complex instruments and come with a high risk of losing money rapidly due to leverage. 72.65% of retail investor accounts lose money when trading CFDs and Spread Bets with this provider. You should consider whether you understand how CFDs and Spread Bets work and whether you can afford to take the high risk of losing your money.


 Login


SEARCH
-
Search query too short. Please enter a full word or phrase.
-

Keywords
Popular Search


SEARCH
-
Search query too short. Please enter a full word or phrase.
-
Keywords
Popular Search



Largest Stock Exchanges in the World: Top 10 by Market Capitalisation in 2026

Vantage Editorial Team >
11 November 2026 | Academy | 31 min read
Vantage Editorial Team >
Vantage is a global, multi-asset broker with a team of in-house writers and market analysts who produce educational and insightful trading content for traders of all levels.

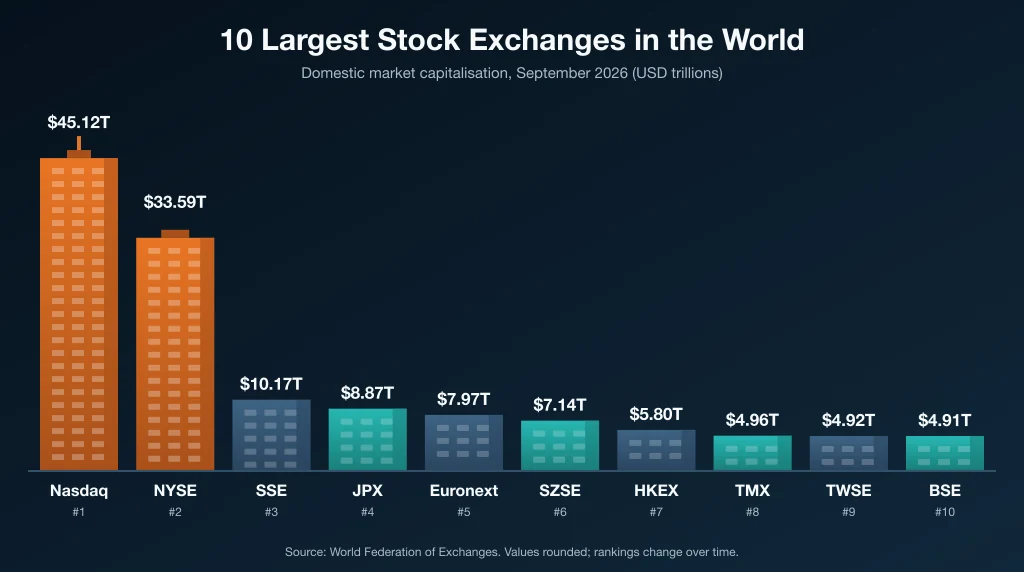
Nasdaq is the largest stock exchange in the world, holding about $45.12 trillion in domestic market capitalisation as of September 2026, about 34% more than the New York Stock Exchange in second place, according to the World Federation of Exchanges (WFE)1. Domestic market capitalisation is the combined value of every company whose primary listing sits on that exchange, and it is the standard yardstick for comparing exchange size.
The lower half of the top 10 changed between June and September 2026. The Taiwan Stock Exchange entered at ninth, TMX Group climbed to eighth, and India’s National Stock Exchange dropped to eleventh.
Key Points
- Nasdaq held about $45.12 trillion in domestic market capitalisation in September 2026, ahead of the NYSE at roughly $33.59 trillion. Together the two US venues account for about 46.5% of the $169.1 trillion listed across the 83 exchanges in the WFE’s table1.
- The Taiwan Stock Exchange entered the global top 10 in September 2026 after a 79.4% rise in US dollar terms over twelve months. Korea Exchange grew even faster, by 94.6%, but ranked 12th after the KOSPI fell more than 20% from its June record inside three weeks1,2,3.
- Exchange size and exchange activity measure different things: BSE India ranks tenth by market capitalisation but recorded about $22 billion of share trading in September 2026, against roughly $285 billion on India’s National Stock Exchange1.
What Are the 10 Largest Stock Exchanges in the World?
The ranking below uses domestic market capitalisation as reported by the World Federation of Exchanges for September 2026, the most recent month available when this ranking was updated in November 20261. Later months may differ. The measure multiplies each listed company’s share price by its outstanding shares, then sums the result across every company whose primary listing sits on that exchange. Companies listed from overseas are excluded, which is why a venue with heavy cross-listing can rank lower than its overall trading profile suggests.
Positions move month to month as share prices, exchange rates, and listing volumes shift. Four exchanges moved into, out of, or within the top 10 between the WFE’s June and September 2026 data alone.
| Rank | Exchange | Country or region | Domestic market cap (September 2026) | Change vs September 2025 (USD) |
| 1 | Nasdaq – US | United States | ~$45.12 trillion | +26.9% |
| 2 | New York Stock Exchange (NYSE) | United States | ~$33.59 trillion | +4.3% |
| 3 | Shanghai Stock Exchange (SSE) | China | ~$10.17 trillion | +16.0% |
| 4 | Japan Exchange Group (JPX) | Japan | ~$8.87 trillion | +19.1% |
| 5 | Euronext | Europe (eight countries) | ~$7.97 trillion | +3.9% |
| 6 | Shenzhen Stock Exchange (SZSE) | China | ~$7.14 trillion | +19.0% |
| 7 | Hong Kong Exchanges and Clearing (HKEX) | Hong Kong | ~$5.80 trillion | −9.5% |
| 8 | TMX Group | Canada | ~$4.96 trillion | +15.3% |
| 9 | Taiwan Stock Exchange (TWSE) | Taiwan | ~$4.92 trillion | +79.4% |
| 10 | BSE India | India | ~$4.91 trillion | −3.3% |
Table 1: The 10 largest stock exchanges in the world by domestic market capitalisation, September 2026. Source: World Federation of Exchanges1
Figures are rounded from the WFE’s published US dollar values and will change as valuations, exchange rates, and listings change. Year-on-year percentages are the WFE’s own US dollar comparisons against September 2025.
1. Nasdaq (~$45.12 Trillion)
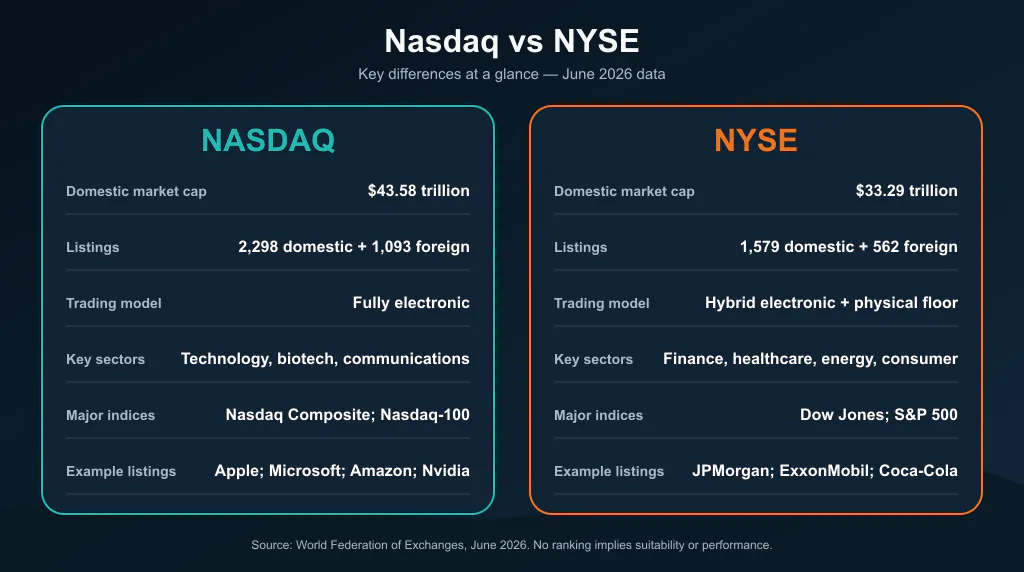
Nasdaq is the world’s largest stock exchange by domestic market capitalisation, at roughly $45.12 trillion in September 2026, a 26.9% increase on September 20251. It opened in 1971 as the first fully electronic exchange, with no physical trading floor.
It carried 2,289 domestic and 1,129 foreign listings in September 2026, weighted heavily toward technology, biotechnology, and communications. Apple, Microsoft, Amazon, Nvidia, and Tesla all list here. The Nasdaq Composite and Nasdaq-100 are its principal benchmarks, and Nasdaq trading activity is concentrated in those large-cap growth names.
2. New York Stock Exchange (NYSE) (~$33.59 Trillion)
The NYSE is the second-largest exchange, at about $33.59 trillion in September 2026, up 4.3% year on year, a fraction of Nasdaq’s growth over the same twelve months1. Founded in 1792, it predates its neighbour by nearly two centuries.
It listed 1,564 domestic and 559 foreign companies in September 2026, spread across finance, healthcare, energy, and consumer goods. The Dow Jones Industrial Average and the S&P 500 draw their constituents largely from here. Its hybrid model pairs an electronic matching engine with human Designated Market Makers on a physical floor, which remains the structural difference from Nasdaq.
3. Shanghai Stock Exchange (SSE) (~$10.17 Trillion)
The Shanghai Stock Exchange is China’s largest equity market and the third-largest globally, at roughly $10.17 trillion in September 2026, up 16.0% year on year1. It was founded in 1990 and carried 2,323 domestic listings in September 2026.
Its listings skew toward large state-owned enterprises and financial institutions, with the SSE Composite Index and SSE 50 tracking firms such as the Industrial and Commercial Bank of China (ICBC) and PetroChina. The exchange runs two share classes: A-shares, denominated in yuan and mainly available to domestic investors, and B-shares, denominated in US dollars and open to both. The Shanghai–Hong Kong Stock Connect programme has widened foreign access to A-shares considerably.
4. Japan Exchange Group (JPX) (~$8.87 Trillion)
Japan Exchange Group moved ahead of Euronext into fourth place during 2026, reaching about $8.87 trillion in September, a 19.1% year-on-year gain1. It was formed in 2013 through the merger of the Tokyo Stock Exchange and Osaka Securities Exchange.
JPX carried 3,892 listings in September 2026, more than any other exchange in the top 10 apart from BSE India, spanning automotive, electronics, robotics, and financial services. The Nikkei 225 and TOPIX are its principal benchmarks. Toyota Motor Corporation, Sony Group, and Mitsubishi UFJ Financial Group sit among its largest constituents.
5. Euronext (~$7.97 Trillion)
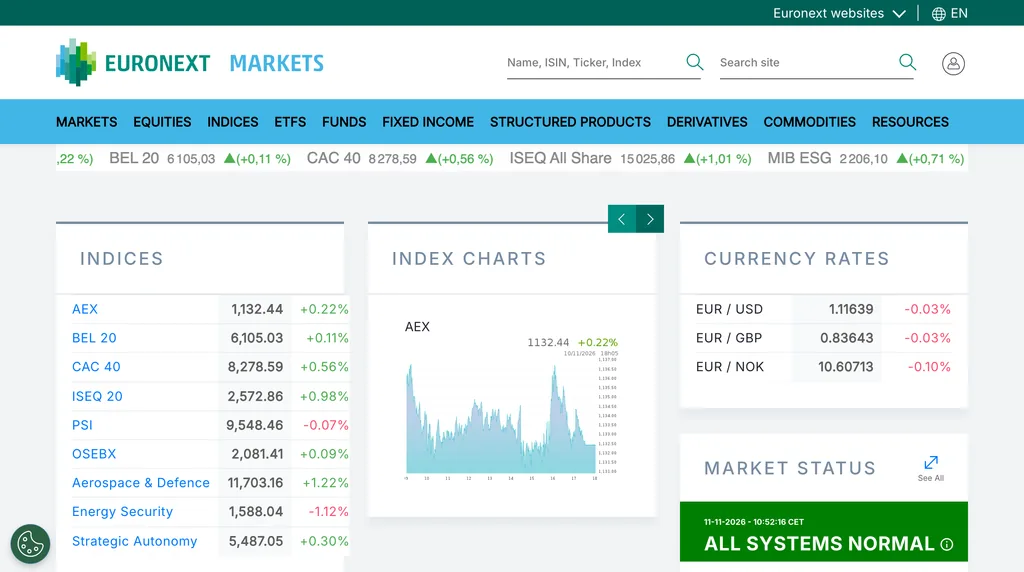
Euronext is Europe’s largest stock exchange, at roughly $7.97 trillion in September 2026, up 3.9% year on year1. It slipped from fourth to fifth during 2026 because JPX grew faster.
Formed in 2000 from the Paris, Amsterdam, and Brussels exchanges, it now runs regulated markets across eight countries: France, the Netherlands, Belgium, Ireland, Portugal, Italy, Greece, and Norway. It listed 1,529 domestic and 168 foreign companies in September 2026. The Euronext 100 and CAC 40 are its main indices, with LVMH, Airbus, ASML, and TotalEnergies among the largest listings.
6. Shenzhen Stock Exchange (SZSE) (~$7.14 Trillion)
The Shenzhen Stock Exchange held about $7.14 trillion in September 2026, a 19.0% year-on-year rise1. Like Shanghai, it was established in 1990, and it carried 2,903 domestic listings in September 2026.
Its listings concentrate in technology, electric vehicles, renewable energy, and advanced manufacturing, and it operates the ChiNext board for higher-growth companies. The SZSE Component Index is its principal benchmark, tracking firms including BYD Company, Ping An Insurance, and Contemporary Amperex Technology (CATL).
7. Hong Kong Exchanges and Clearing (HKEX) (~$5.80 Trillion)
Hong Kong Exchanges and Clearing held roughly $5.80 trillion in September 2026, down 9.5% year on year, in contrast with gains of 16% and 19% on the mainland Chinese exchanges over the same period1. It was formed in 2000 from the merger of the Stock Exchange of Hong Kong, the Hong Kong Futures Exchange, and Hong Kong Securities Clearing.
HKEX carried 2,772 listings in September 2026, including many mainland Chinese firms seeking access to international investors. Its benchmark Hang Seng Index includes Tencent Holdings, HSBC Holdings, and China Mobile. Its defining role is as a bridge between mainland China and global capital markets, principally through the Shanghai–Hong Kong and Shenzhen–Hong Kong Stock Connect programmes.
8. TMX Group (~$4.96 Trillion)
TMX Group, which operates the Toronto Stock Exchange (TSX) and the TSX Venture Exchange, is Canada’s largest securities market at about $4.96 trillion in September 2026, up 15.3% year on year in US dollar terms1. The TSX itself dates to 1852.
Across both venues TMX carried 3,831 listings in September 2026, concentrated in energy, mining, and financial services, sectors that mirror the structure of the Canadian economy. Royal Bank of Canada, Shopify, and Enbridge sit among its largest constituents, and the S&P/TSX Composite Index tracks its most significant companies.
9. Taiwan Stock Exchange (TWSE) (~$4.92 Trillion)
The Taiwan Stock Exchange entered the global top 10 in September 2026 at about $4.92 trillion, a 79.4% rise on September 2025 and the largest year-on-year increase in the top 10.1 It was established in October 1961 and opened for trading in February 1962.9
It carried 1,095 listings in September 2026, 102 of them from overseas. Its benchmark index, the TAIEX, rose 85.7% over the twelve months to September 2026.1 Taiwan Semiconductor Manufacturing Company (TSMC), the world’s largest contract chipmaker, is its largest listed company, which ties the exchange’s value closely to the semiconductor cycle.
10. BSE India (~$4.91 Trillion)
BSE is the tenth-largest exchange at roughly $4.91 trillion in September 2026, about $6.7 billion ahead of the National Stock Exchange of India1. Both fell in US dollar terms over the twelve months to September (BSE by 3.3%, the NSE by 3.0%).
Founded in 1875 as the Bombay Stock Exchange, it is Asia’s oldest stock exchange and carried 5,766 listings in September 2026, more than any other exchange in the current top 20. Its flagship index is the BSE Sensex 30, tracking thirty of the market’s largest and most actively traded companies, including HDFC Bank, Reliance Industries, and Tata Consultancy Services.
The above examples are for illustrative purposes only and do not constitute a recommendation to buy, sell, or hold any financial instrument.
What Changed in the Top 10 in 2026?
Four exchanges moved into, out of, or within the top 10 between the WFE’s June 2026 and September 2026 data, all of them in the lower half of the ranking.
| Exchange | Rank (June 2026, revised) | Rank (September 2026) | Movement |
| TMX Group | 10 | 8 | Up two places |
| Taiwan Stock Exchange (TWSE) | 12 | 9 | Entered the top 10 |
| BSE India | 9 | 10 | Down one place |
| Korea Exchange (KRX) | 11 | 12 | Down one place |
| National Stock Exchange of India | 8 | 11 | Left the top 10 |
Table 2: Ranking movement in the global top 10 between June and September 2026. June ranks use the revised figures in the WFE’s November 2026 issue. Source: World Federation of Exchanges1
Taiwan’s 79.4% year-on-year rise in US dollar terms and Korea Exchange’s 94.6% both reflect the same semiconductor demand cycle, while both Indian exchanges lost ground in US dollar terms.1 Asia-Pacific exchanges now hold about $57.5 trillion of listed value, against $25.4 trillion across Europe, the Middle East, and Africa combined.1
Nothing changed at the top. Nasdaq’s lead over the NYSE, established during 2025, widened over the following twelve months: Nasdaq added 26.9% while the NYSE added 4.3%1.
Which Exchanges Rank 11 to 20? The $1 Trillion Club
Exactly 20 exchanges held more than $1 trillion in domestic market capitalisation in September 2026, which makes the global top 20 and the so-called $1 trillion club the same list. The twenty-first, Tel Aviv Stock Exchange, sat at roughly $954 billion1.
| Rank | Exchange | Domestic market cap (September 2026) |
| 11 | National Stock Exchange of India (NSE) | ~$4.90 trillion |
| 12 | Korea Exchange (KRX) | ~$4.50 trillion |
| 13 | Deutsche Börse | ~$2.77 trillion |
| 14 | SIX Swiss Exchange | ~$2.53 trillion |
| 15 | Saudi Exchange (Tadawul) | ~$2.43 trillion |
| 16 | Australian Securities Exchange (ASX) | ~$2.36 trillion |
| 17 | Nasdaq Nordic and Baltics | ~$2.33 trillion |
| 18 | Johannesburg Stock Exchange (JSE) | ~$1.56 trillion |
| 19 | BME Spanish Exchanges | ~$1.38 trillion |
| 20 | B3 – Brasil Bolsa Balcão | ~$1.08 trillion |
Table 3: Exchanges ranked 11 to 20 by domestic market capitalisation, September 2026. Source: World Federation of Exchanges1
The gap between tenth and eleventh is slim. About $6.7 billion separated BSE India from the NSE in September 2026, roughly 0.1% of either exchange’s value, a gap small enough to reverse from one month to the next. Below twelfth the picture changes: Korea Exchange sits at $4.50 trillion, but thirteenth-placed Deutsche Börse holds about $2.77 trillion, a drop of roughly 38%. Germany’s DAX 40 and Australia’s ASX 200 both sit in this second tier.
The WFE’s September 2026 table covers 83 exchanges holding roughly $169.1 trillion between them, of which the top 10 account for about $133.5 trillion, or 79%1. Estimates of how many stock exchanges exist worldwide vary between roughly 60 and 80, depending on whether regional venues, specialist boards, and alternative trading platforms are counted, which is why no single figure is authoritative.
Where Does the London Stock Exchange Rank?
The London Stock Exchange does not appear in the WFE’s monthly domestic market capitalisation table, so it cannot be ranked against the exchanges above on the same basis. London Stock Exchange Group is not among the 83 exchanges listed in the WFE’s September 2026 domestic market capitalisation table that this ranking is built from1.
What can be said without a caveat: the LSE has operated as a formal exchange since 1801, and its FTSE 100 index, with HSBC Holdings, BP, and Unilever among its constituents, remains one of Europe’s most widely tracked equity benchmarks.
What Time Does the London Stock Exchange Open?
For UK traders, the LSE’s main order book runs continuous trading from 08:00 to 16:30 UK time, Monday to Friday, followed by a closing auction that ends at about 16:35.4 The times are UK local time all year, so they move with British Summer Time (BST, UTC+1) in summer and Greenwich Mean Time (GMT, UTC+0) in winter.
Around Christmas, the LSE holds half-day sessions and closes on bank holidays. In 2026, it closes on 25 December, on 28 December (the substitute Boxing Day bank holiday), and on 1 January 2027, and the closing process starts at 12:30 UK time on 24 and 31 December.5
Is the Largest Exchange the Most Traded? Market Cap vs. Trading Activity
Domestic market capitalisation measures what an exchange’s listed companies are worth. It says nothing about how much actually changes hands. The two diverge far more than the ranking suggests.
| Exchange | Domestic market cap (September 2026) | Share trading value (September 2026) | Turnover as % of market cap |
| Shenzhen Stock Exchange | ~$7.14 trillion | ~$4,725 billion | 66.2% |
| Shanghai Stock Exchange | ~$10.17 trillion | ~$2,680 billion | 26.3% |
| Nasdaq – US | ~$45.12 trillion | ~$7,088 billion | 15.7% |
| New York Stock Exchange | ~$33.59 trillion | ~$4,016 billion | 12.0% |
| Japan Exchange Group | ~$8.87 trillion | ~$1,048 billion | 11.8% |
| Taiwan Stock Exchange | ~$4.92 trillion | ~$505 billion | 10.3% |
| National Stock Exchange of India | ~$4.90 trillion | ~$285 billion | 5.8% |
| Euronext | ~$7.97 trillion | ~$292 billion | 3.7% |
| BSE India | ~$4.91 trillion | ~$22 billion | 0.4% |
Table 4: Domestic market capitalisation against monthly share trading value, September 2026. Turnover percentages calculated from WFE figures1
The clearest illustration sits inside a single market. BSE and the NSE held almost the same listed value in September 2026, yet the NSE handled about $285 billion of share trading against BSE’s $22 billion, about 13 times as much1. The listed value is spread across two venues, while trading activity is concentrated in one.
The mainland Chinese exchanges sit at the other extreme. Shenzhen turned over roughly 66% of its entire market capitalisation in September 2026 alone, and Shanghai around 26%1. Nasdaq, more than six times Shenzhen’s size, turned over about 16%. High turnover relative to size can reflect a larger share of retail participation and shorter average holding periods, although the ratio also moves with market conditions and should not be read as a quality signal.
Market capitalisation and market liquidity answer different questions. The first asks how much value is listed. The second asks how easily a position can be opened or closed without moving the price. A benchmark such as the Nikkei 225 reflects the value of its constituents, not how readily those constituents trade.
How Do the World’s Largest Stock Markets Differ? 3 Key Differences
The exchanges at the top of the ranking share a common function as regulated marketplaces for securities. Beyond that they differ sharply in where their value is concentrated, which sectors dominate their listings, and how far their reach extends beyond their home market.
1. Regional Concentration
Nasdaq and the NYSE together held about $78.7 trillion in September 2026, about 46.5% of the $169.1 trillion listed across every exchange in the WFE’s table, and 59% of the top 10’s combined value1. No other region concentrates that much listed value in two venues.
Asia-Pacific holds the most listed value of any region at roughly $57.5 trillion across 26 reporting exchanges, with China’s three venues (Shanghai, Shenzhen, and Hong Kong) accounting for about $23.1 trillion of that between them1. Europe, the Middle East, and Africa hold roughly $25.4 trillion across 43 exchanges: the widest spread and the smallest total.
2. Sector Specialisation
Various sectors differ by their niches:
- Nasdaq’s weighting toward technology is the clearest sector signature in the ranking, and it may account for part of its 26.9% year-on-year growth to September 20261.
- TMX Group’s Toronto Stock Exchange skews toward energy, mining, and natural resources.
- Shenzhen typically concentrates in technology, electric vehicles, and renewable energy.
- Korea Exchange’s 2026 shows what heavy concentration does in both directions.
- Samsung Electronics and SK Hynix between them accounted for more than half the KOSPI’s value, which carried the index up nearly 100% across the first half of the year and then more than 20% down from its June peak inside three weeks2,3.
- The S&P 500 spreads its weighting across considerably more names and sectors, which can dampen moves of that magnitude in either direction.
For a longer view of how sharp falls have played out, see our guide to stock market crashes in history.
3. Global Reach and Trading Hours
The top 10 runs across time zones from New York to Tokyo, a spread of roughly 13 hours, so activity in global equity markets is close to continuous through the working week. Stock market trading hours vary by venue: most major exchanges run a single continuous session of six to eight hours, while several Asian venues still break for lunch.
For a UK trader, the order of the day looks like this:
| Exchange | Local Session | UK Time (Winter, GMT) | UK Time (Summer, BST) |
| London Stock Exchange | 08:00 to 16:30 | 08:00 to 16:30 | 08:00 to 16:30 |
| NYSE and Nasdaq | 09:30 to 16:00 ET | 14:30 to 21:00 | 14:30 to 21:00 |
| Japan Exchange Group (Tokyo) | 09:00 to 11:30 and 12:30 to 15:30 JST | 00:00 to 02:30 and 03:30 to 06:30 | 01:00 to 03:30 and 04:30 to 07:30 |
Table 5: Main trading sessions for three of the largest venues in UK time. US times shift an hour earlier in UK time for about three weeks in March and about one week from late October to early November, when the US and UK change their clocks on different dates. Japan does not change its clocks. Sources: ShareScope (LSE)4, NYSE6, and Japan Exchange Group7.
HKEX has functioned as the primary route for mainland Chinese companies raising international capital, and for overseas investors seeking mainland exposure. Meanwhile, Euronext is cross-border by construction, running one platform across eight countries.
Nasdaq and the NYSE host large numbers of overseas companies (1,129 and 559 respectively in September 2026), many through American depositary receipts (ADRs), which give those firms access to US liquidity without a domestic listing1.
How Can UK Traders Access Instruments Linked to These Stock Exchanges?
Disclaimer: The exchanges, indices, and financial instruments discussed in this article are provided for informational and educational purposes only and should not be interpreted as a recommendation, solicitation, or advice to trade.
UK traders looking to access global equity markets linked to the exchanges covered in this article can do so through spread bets or CFDs, without holding the underlying shares directly.
With Vantage UK, indices and shares can be traded as a spread bet or a CFD, so you don’t own the underlying assets. This includes indices such as the S&P 500, FTSE 100, or Nikkei 225, as well as ETF CFDs and share CFDs linked to companies listed on the exchanges covered in this article, like the US companies listed on Nasdaq and the NYSE.
Spread bets and CFDs are leveraged and involve significant risk. Leverage can magnify both gains and losses: for UK retail clients, FCA rules cap leverage at 20:1 on major indices and 5:1 on individual shares.8
Before entering a position, traders should understand the mechanics of the market being accessed, including the differences between index CFDs and share CFDs. You can practise trading indices and shares with virtual funds on a demo account before using real money. Bear in mind that demo results and conditions, such as spreads and execution, may differ from live trading.
Those looking to build their knowledge of global markets can explore Vantage’s Academy, which provides educational articles across a wide range of trading topics, including spread betting vs CFDs.
Size Is a Snapshot, Not a Hierarchy
The ranking above describes September 2026. Four exchanges had moved into, out of, or within the top 10 since June, and Korea Exchange, which nearly doubled in value over twelve months, ranked 12th after the KOSPI fell more than 20% from its June record within weeks1,2.
That does not make the ranking useless. It makes it a measurement with a date attached rather than a standing order of importance. Domestic market capitalisation tells you where listed equity value sits at a point in time. It does not tell you where trading activity concentrates, how easily a position can be closed, or what any of it implies about a market’s prospects.
Two features have held steady through all of it: the concentration of listed value in two US venues, and the distance between the top three and everything below. Almost everything else in the table moves.
Frequently Asked Questions (FAQs)
What Is the Largest Stock Exchange in the World?
Nasdaq is the largest stock exchange in the world by domestic market capitalisation, at approximately $45.12 trillion in September 2026, according to the World Federation of Exchanges1. The New York Stock Exchange is second at roughly $33.59 trillion. Nasdaq moved ahead of the NYSE during 2025 and extended that lead through 2026, growing 26.9% in the twelve months to September against the NYSE’s 4.3%1, a rise that may partly reflect its weighting toward technology and AI-related listings.
Which Is the Oldest Stock Exchange in the World?
The Amsterdam exchange, founded in 1602 and now part of Euronext, is generally regarded as the world’s first formal stock exchange. Among the other exchanges in the current top 10, the New York Stock Exchange is the oldest at 1792, followed by the Toronto Stock Exchange in 1852 and BSE India, Asia’s oldest, in 1875. Age and size are unrelated: Nasdaq, the largest exchange in the world today, only opened in 1971.
What Is the Difference Between the NYSE and Nasdaq?
The NYSE is a traditional auction market that combines electronic trading with human Designated Market Makers on a physical trading floor, while Nasdaq operates as a fully electronic exchange with no physical floor presence. The two also differ in the companies they attract: the NYSE is historically associated with large, established blue-chip firms across industries such as finance, energy, and consumer goods, while Nasdaq is strongly linked to technology, biotechnology, and growth-stage companies. Both exchanges apply separate listing requirements and operate under oversight from the US Securities and Exchange Commission.
How Many Stock Exchanges Are There in the World?
Estimates range from roughly 60 to 80 major stock exchanges worldwide, and the precise figure depends entirely on what is being counted. The World Federation of Exchanges published domestic market capitalisation for 83 exchanges in its September 2026 data1. That count excludes many regional venues, specialist boards, and alternative trading platforms, so broader definitions produce higher numbers. Of the 83 exchanges in the WFE table, exactly 20 held more than $1 trillion in listed value.
What Is the Difference Between the NSE and BSE?
Both the National Stock Exchange (NSE) and BSE are major stock exchanges, and in September 2026 they held similar domestic market capitalisation of about $4.90 trillion and $4.91 trillion respectively1. The main difference lies in trading activity and the number of listed companies. BSE listed 5,766 companies in September 2026 compared with the NSE’s 3,066, while the NSE handled roughly $285 billion in share trading that month versus BSE’s $22 billion1. BSE’s flagship index is the Sensex 30, while the NSE’s is the NIFTY 50.
Can I Trade Instruments Linked to Foreign Stock Exchanges?
Yes. In the UK, spread bets and CFDs let you trade the price movements of indices, shares, or ETFs linked to overseas exchanges without owning the underlying shares. Both are contracts with the provider rather than purchases of shares on the exchange, so they don’t give ownership or direct access to the exchange. Instruments priced in US dollars or other currencies carry currency risk on a GBP account, and overseas markets trade in different UK hours.
How Often Do the Stock Exchange Rankings Change?
Market capitalisation changes continuously during trading hours as share prices move, and the World Federation of Exchanges publishes updated figures monthly through its statistics portal1. Ranking positions shift less often, though 2026 has been an exception: four exchanges moved into, out of, or within the top 10 between the June and September 2026 data. The WFE also revises earlier months as exchanges update their figures. Currency movements matter as much as share prices here, because the WFE reports in US dollars. An exchange can grow in local-currency terms and still fall in the ranking.
Where Does the London Stock Exchange Rank in the World?
It can’t be ranked on the same basis as the exchanges above, because London Stock Exchange Group is not in the WFE’s monthly domestic market capitalisation table that this ranking uses.1 Estimates of the LSE’s size are compiled on different bases, so placing one in the table would mix two measures.
What Time Does the London Stock Exchange Open?
The LSE’s main order book opens for continuous trading at 08:00 UK time and closes at 16:30, followed by a closing auction, Monday to Friday.4 It holds half-day sessions on 24 and 31 December and closes on bank holidays.5
Which Is the Best Stock Market in the World?
There is no objective answer, because “best” depends on what is being measured. Nasdaq is the largest by listed value and the NYSE second, but Shenzhen had far higher turnover relative to its size in September 2026, and Korea Exchange grew 94.6% over twelve months despite the KOSPI falling sharply from its June peak1,2. Size, liquidity, growth, sector mix, and volatility all point to different venues. A larger market does not imply better returns, lower risk, or greater suitability for any individual.
RISK WARNING: CFDs and Spread Bets are complex instruments and come with a high risk of losing money rapidly due to leverage. 72.65% of retail investor accounts lose money when trading CFDs and Spread Bets with this provider. You should consider whether you understand how CFDs and Spread Bets work and whether you can afford to take the high risk of losing your money.
Disclaimer: The information has been prepared as of 8 November 2026 and is subject to change thereafter. The information is provided for educational purposes only and doesn’t take into account your personal objectives, financial circumstances, or needs. It does not constitute investment advice. We encourage you to seek independent advice if necessary. The information has not been prepared in accordance with legal requirements designed to promote the independence of investment research. No representation or warranty is given as to the accuracy or completeness of any information contained within. This material may contain historical or past performance figures and should not be relied on. Furthermore, estimates, forward-looking statements, and forecasts cannot be guaranteed. The information on this site and the products and services offered are not intended for distribution to any person in any country or jurisdiction where such distribution or use would be contrary to local law or regulation.
References
- “Market Statistics (September 2026 data), November 2026 issue – WFE Focus” https://focus.world-exchanges.org/issue/november-2026/market-statistics. Accessed on 8 November 2026.
- “Why the world’s best-performing stock market this year fell into bear territory – CNBC” https://www.cnbc.com/2026/07/09/kospi-bear-territory-ai-samsung-skhynix-chipmakers.html. Accessed on 14 September 2026.
- “Explaining South Korea’s Stock Market Boom – Korea Economic Institute of America” https://keia.org/analysis/explaining-south-koreas-stock-market-boom/. Accessed on 28 October 2026.
- “The Trader: Understanding SETS Auctions – ShareScope” https://knowledge.sharescope.co.uk/2025/11/28/the-trader-understanding-sets-auctions/. Accessed on 8 November 2026.
- “Business days – London Stock Exchange” https://www.londonstockexchange.com/equities-trading/business-days. Accessed on 8 November 2026.
- “Holidays & Trading Hours – NYSE” https://www.nyse.com/trade/hours-calendars. Accessed on 8 November 2026.
- “Trading Hours – Japan Exchange Group” https://www.jpx.co.jp/english/equities/trading/domestic/01.html. Accessed on 8 November 2026.
- “COBS 22.5 Restrictions on the retail marketing, distribution and sale of contracts for differences and similar speculative investments – FCA Handbook” https://handbook.fca.org.uk/handbook/cobs22/cobs22s5. Accessed on 8 November 2026.
- “Timeline – Taiwan Stock Exchange Corporation” https://www.twse.com.tw/en/about/company/history.html. Accessed on 8 November 2026.
Key Points In This Article

Latest Academy Articles


Market News Tags
- # Asian Markets News Today
- # Crude Oil News Today
- # Earnings News Today
- # Economic News Today
- # Featured News
- # Federal Reserve News
- # Commodity Market News
- # Interest Rate News
- # Financial News
- # Forex News Today
- # Gold News Today
- # Market News Today
Related Articles
- Alphabet (GOOGL) Stock in Q3 2026: Latest Results, Analyst Targets and How UK Traders Trade It
- Amazon (NASDAQ: AMZN) Shares Q3 2026 Earnings: What It Might Mean For UK Traders & Investors
- CFD Trading Explained: What It Is and How to Trade CFDs in the UK
- Negative Balance Protection in the UK: How It Works and What It Doesn’t Cover
- 10 CFD Trading Strategies UK Traders Should Know
- Candlestick Patterns: How to Read 18 Patterns on Price Charts
- Best Trading App in the UK: Six Broker Apps for Trading on Your Phone
- Spread Betting vs. CFDs: What’s The Difference?