
CFDs and Spread Bets are complex instruments and come with a high risk of losing money rapidly due to leverage. 72.65% of retail investor accounts lose money when trading CFDs and Spread Bets with this provider. You should consider whether you understand how CFDs and Spread Bets work and whether you can afford to take the high risk of losing your money.


 Login


SEARCH
-
Search query too short. Please enter a full word or phrase.
-

Keywords
Popular Search


SEARCH
-
Search query too short. Please enter a full word or phrase.
-
Keywords
Popular Search



 Academy All Articles Amazon (NASDAQ: AMZN) Shares Q3 2026 Earnings: What It Might Mean For UK Traders & Investors
Amazon (NASDAQ: AMZN) Shares Q3 2026 Earnings: What It Might Mean For UK Traders & Investors

Vantage Editorial Team >
11 November 2026 | Academy | 25 min read
Vantage Editorial Team >
Vantage is a global, multi-asset broker with a team of in-house writers and market analysts who produce educational and insightful trading content for traders of all levels.
Amazon (NASDAQ: AMZN) closed at $259.30 on 6 November 2026, about 9.7% below its 52-week high of $287.20, a week after third-quarter results showed Amazon Web Services (AWS) revenue growth of 39.3% and earnings per share of $1.89 against about $1.96 expected.1,2,3,4
Key Points
- Q3 2026 net sales of $201.9 billion were about 0.2% below the roughly $202.3 billion expected, AWS grew 39.3%, and earnings per share of $1.89 came in about 3.6% below the $1.96 consensus.3,4,5
- Analyst ratings lean heavily to Buy, yet 12-month price targets run from $230 to $405, and providers’ counts and averages differ. Targets are third-party opinions that change often.2,6
- Share spread bets and CFDs are leveraged, with UK retail leverage on shares capped at 5:1, so losses can build quickly, and prices can gap around earnings. A stop-loss does not guarantee the exit price.
One day’s close is only a snapshot, and prices can move sharply around results, so treat every level and figure below as dated.
This guide covers what Amazon reported, what analysts rate and target, the chart levels traders watch, and the dates ahead. It’s written for UK traders who trade share spread bets or CFDs, which are leveraged contracts that track a share’s price rather than shares you own.
Last reviewed: 8 November 2026. Market data is as of 6 November 2026 unless stated, and prices, ratings and dates are refreshed after each Amazon earnings release.
CFDs and Spread Bets are complex instruments and come with a high risk of losing money rapidly due to leverage. 72.65% of retail investor accounts lose money when trading CFDs and Spread Bets with this provider. You should consider whether you understand how CFDs and Spread Bets work and whether you can afford to take the high risk of losing your money.
| Item | Latest figure |
| Latest close (6 November 2026) | $259.30, −0.35% on the day27 |
| 52-week range | $196.00 to $287.202 |
| Market capitalisation | About $2.8 trillion (6 November 2026)27 |
| Moving averages (daily) | 50-day $253.95; 200-day $243.9427 |
| 2026 capital spending (company expectation) | About $220 billion3 |
| Analyst 12-month price targets | $230 to $405; average $326.99 (8 November 2026)7 |
| Exchange and symbol | NASDAQ: AMZN, quoted in US dollars |
| Regular trading hours | 9:30am to 4:00pm Eastern Time (14:30 to 21:00 UK time for most of the year), Monday to Friday |
| Next results (Q4 2026) | Date to be confirmed by Amazon (Q4 2025 results came on 5 February 2026)8 |
Table 1: Amazon (AMZN) at a glance. Figures as of 6 November 2026 unless stated.
What Happened in Amazon’s Q3 2026 Earnings?
Amazon reported third-quarter results on 29 October 2026 after the US market close. Net sales rose 12% to $201.9 billion, just under expectations of about $202.3 billion. Operating income was $28.1 billion, above Amazon’s own guidance range of $22.5 billion to $26.5 billion. Diluted earnings per share were $1.89 against $1.95 a year earlier and below the $1.96 consensus.3,4,5
| Measure | Q3 2026 | A year earlier | Note |
| Net sales | $201.9bn, +12% | $180.2bn | +13% excluding currency effects |
| Operating income | $28.1bn (13.9% margin) | $17.4bn (9.7% margin) | Above guidance of $22.5bn to $26.5bn |
| Diluted EPS (GAAP) | $1.89 | $1.95 | Consensus about $1.96 |
| AWS net sales | $46.0bn, +39.3% | $33.0bn | About a $184bn annual run rate |
| AWS operating income | $17.8bn (38.7% margin) | $11.4bn | |
| Advertising revenue | $19.6bn, +11% | n/a | +12% excluding currency effects |
| Q4 2026 guidance | Net sales $240.0bn to $247.0bn; operating income $28.5bn to $33.5bn | Q4 2025: $213.4bn sales, $25.0bn operating income | Assumes, among other things, no additional acquisitions, restructurings or legal settlements, and no energy-derivative remeasurements |
Table 2: Amazon Q3 2026 results against a year earlier. The prior-year operating margin is a Vantage calculation. Sources: Amazon Q3 2026 release; consensus from 24/7 Wall St. and Il Sole 24 Ore.3,4,5
Amazon attributes the year-on-year fall in earnings per share mainly to pre-tax gains of $9.5 billion from its Anthropic investment in the third quarter of 2025, which lifted the comparison period.3
How Did Amazon Shares React to the Results?
The shares closed at $243.79 on 29 October, down 4.25% on the day, ahead of the results released after the close.9 In after-hours trading after the results they fell by more than 11% at one point, according to TradingKey, before narrowing the loss to about 5%, near $230.64, later that evening.10 On 30 October they closed at $240.35, down 1.4%, and on 2 November at $245.63, up 2.2%.2,11
Why Has Amazon Stock Fallen Since August?
Amazon shares reached $287.20 in early August 2026, around the Q2 results, and closed at $259.30 on 6 November, about 9.7% lower.2 On the chart, they have mostly traded between about $245 and $268 since late August.1
A drift like this rarely has one cause: results, interest-rate expectations and spending plans can each weigh on a large growth share at once, and no single event can be tied to the August to October move with confidence. The 29 October results added a sharp after-hours drop that was largely reversed by the next close.
For the next test, Amazon guided Q4 net sales to $240.0 billion to $247.0 billion and operating income to $28.5 billion to $33.5 billion, and it expects about $220 billion of capital spending in 2026. Heavy spending can pressure cash flow before revenue follows, which is one reason investors watch AWS growth closely.3
What Do Analysts Say About Amazon Stock? Ratings and Price Targets
In its November 2026 data, StockAnalysis, which uses S&P Global Market Intelligence data, counted 61 analysts: 58 rate Amazon Buy or Strong Buy, 3 rate it Hold, and none rate it Sell. Their 12-month price targets run from $230 to $405, with an average of $326.99, or 26.1% above the 6 November 2026 close of $259.30.7
Note: These are third-party opinions that can change at any time; they are not a forecast or a recommendation by Vantage.
| Provider | Analysts | Ratings | Average target | Date |
| StockAnalysis (S&P Global data) | 61 | 44 Strong Buy, 14 Buy, 3 Hold, 0 Sell | $326.99 | November 2026 |
| MarketBeat | 60 | 2 Strong Buy, 55 Buy, 3 Hold, 0 Sell | $321.74 | November 2026 |
| TipRanks | 44 | 43 Buy, 1 Hold, 0 Sell | $324.88 | November 2026 |
Table 3: Analyst ratings and average price targets by provider. Ratings and targets change as analysts update them. Sources: StockAnalysis, MarketBeat and TipRanks, accessed 8 November 2026.6,7,12,28
As you can see, the providers do not agree. Counts differ because each uses its own analyst set and scale, and average targets range from $321.74 to $326.99, or about 24.1% to 26.1% above the 6 November close. The spread within targets says more than the average: the lowest target ($230) is 11.3% below the close and the highest ($405) is 56.2% above it.
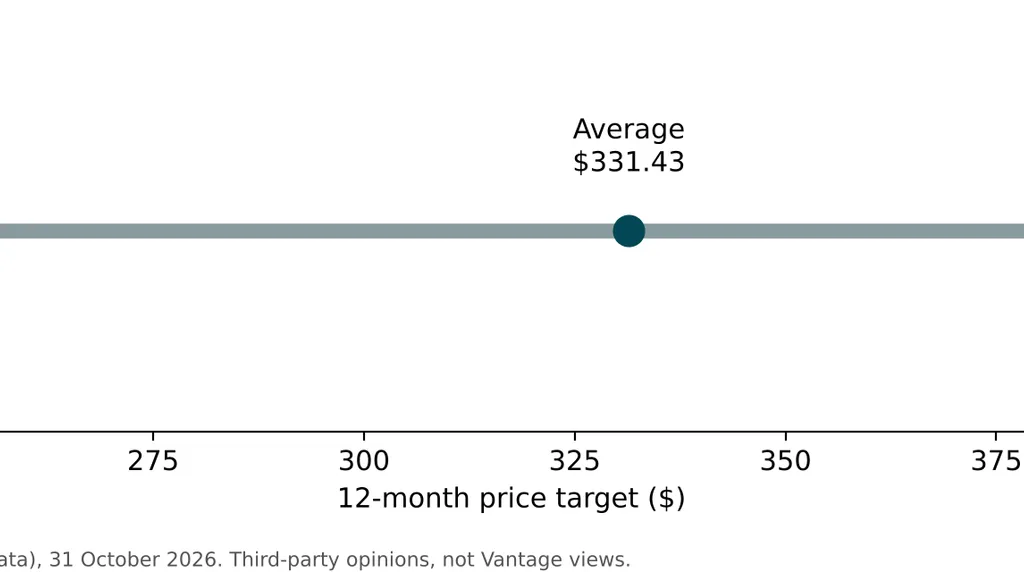
Chart 1: Range of 12-month analyst price targets for Amazon against the 6 November 2026 close. Source: StockAnalysis, 8 November 2026.7
Which Brokers Changed Their Targets After Results?
More analysts lowered targets than raised them after the 29 October results. TipRanks counted 29 analysts updating, all with Buy ratings: 13 lowered targets, 5 raised them and 11 left them unchanged or gave none.12
| Broker | Rating | Target change |
| Goldman Sachs | Conviction Buy | $375 to $370 |
| Bank of America | Buy | $320 to $317 |
| TD Cowen | Buy | $350 to $340 |
| KeyCorp | Overweight | $350 to $345 |
| BMO Capital | Buy | $380 to $390 |
| Mizuho | Outperform | $330 to $335 |
Table 4: Selected analyst target changes, 30 and 31 October 2026. Sources: MarketBeat, TipRanks and StockAnalysis.6,7,12
Ratings and price targets are third-party opinions, not Vantage’s views, and they are revised often. A high count of Buy ratings does not mean the price will rise, and analysts can be wrong. Nothing here is intended as a recommendation or investment advice.
Amazon Stock Chart Analysis: Key Levels After Earnings
Chart 2 shows Amazon’s daily price for 2026 up to 6 November, with the 50-day and 200-day moving averages and the 14-day relative strength index (RSI). The E markers show earnings releases.
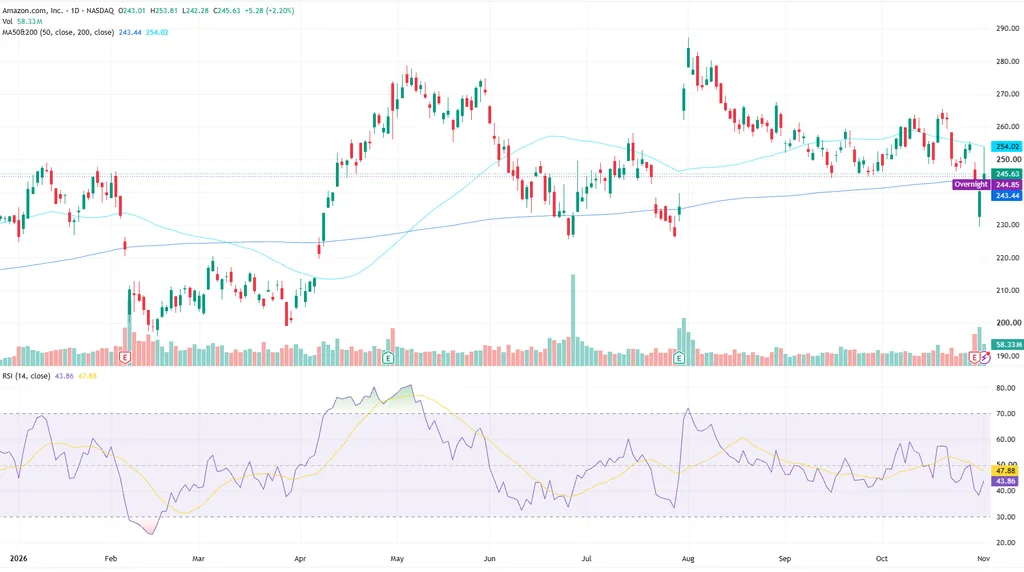
Chart 2: Amazon (NASDAQ: AMZN) daily chart with 50-day and 200-day moving averages and RSI(14), 2026 to 6 November. Source: TradingView.1
| Level | Value | Context |
| 52-week high | $287.20 | 3 August 2026 (intraday); the 6 November close was 9.7% below it |
| Early-November swing high | $273.23 | Intraday high on 5 November 2026 |
| 6 November close | $259.30 | Open $259.81, high $264.18, low $258.53; volume 42.50 million |
| 50-day moving average | $253.95 | The 6 November close was 2.1% above it |
| 200-day moving average | $243.94 | The 6 November close was 6.3% above it |
| 30 October close | $240.35 | Down 1.4% on the day |
| June and July lows | About $226 | Read from the chart |
| 52-week low | $196.00 | 17 February 2026 |
Table 5: Key price levels for Amazon, as of 6 November 2026. Levels marked about are read from the chart and are approximate. Sources: TradingView, StockAnalysis, StockScan, Yahoo Finance.1,2,13,27
Since late August the shares have mostly traded between about $245 and $268. They traded above the 50-day moving average in mid-October, fell back below it after the late-October swing high and the 29 October results, then moved back above it on 4 November, when they rose 6.1% to $266.03.
After the 29 October results the shares gapped lower, recovered to close at $240.35 on 30 October on the heaviest volume in weeks, and the rebound reached an intraday high of $273.23 on 5 November before the shares closed at $260.21.
The RSI, a 0 to 100 momentum gauge where readings above 70 are often called overbought and below 30 oversold, was 54.22 on 6 November, above its own average of 49.03. It was about 23 in February, about 81 in early May and about 72 around the August results.
All four earnings markers sit beside large volume bars and price gaps. Prices can move sharply around news and results, which makes event trading higher risk; one option is to observe it on a demo account first.
Moving averages and swing levels are reference points, not reliable indicators of what happens next, and price can move through them quickly, especially around earnings. This is not a forecast or a prediction of Amazon’s share price.
What Could Move Amazon Stock Next? Dates and Catalysts
| Date | Event | Why it could matter |
| 27 November 2026 | Black Friday | Opens the peak holiday shopping period that Amazon’s Q4 guidance covers |
| 30 November 2026 | Cyber Monday | Same period; Amazon has said it plans to hire more than 300,000 seasonal, part-time and full-time employees in the US this holiday season3 |
| 30 November to 4 December 2026 | AWS re:Invent, Las Vegas | Product and AI announcements from the cloud segment14 |
| 8 to 9 December 2026 | Federal Reserve (FOMC) meeting with projections | Interest-rate expectations can affect how growth shares are valued15 |
| To be confirmed | Q4 2026 results | Tests the $240.0bn to $247.0bn net sales guidance; Q4 2025 results came on 5 February 20268 |
Table 6: Dates that could affect Amazon’s share price. Black Friday and Cyber Monday follow from US Thanksgiving on 26 November 2026. Sources: Amazon, AWS, Federal Reserve.
Company Projections and Analyst Estimates
Amazon guided Q4 net sales to $240.0 billion to $247.0 billion (12% to 16% growth) and operating income to $28.5 billion to $33.5 billion. Amazon also projects AWS revenue growth of more than 40% in both 2027 and 2028. These are company projections, not outcomes.3
Guidance and estimates have been revised before and can be wrong, and events such as results releases can move prices sharply. This is not a forecast or a prediction of Amazon’s share price.
How Does Amazon Make Money? Segments at a Glance
Amazon reports three segments: North America, International and AWS. Advertising revenue is disclosed as its own line rather than as a segment.3
| Segment | Q3 2026 net sales | Growth | Operating income | Margin |
| North America | $112.9bn | +6% | $8.7bn | 7.7% |
| International | $43.1bn | +5% (+8% excluding currency) | $1.6bn | 3.7% |
| AWS | $46.0bn | +39.3% | $17.8bn | 38.7% |
| Advertising (separate line) | $19.6bn | +11% (+12% excluding currency) | Not reported | n/a |
Table 7: Amazon segment results, Q3 2026. Margins are operating income divided by net sales. Source: Amazon Q3 2026 release.3
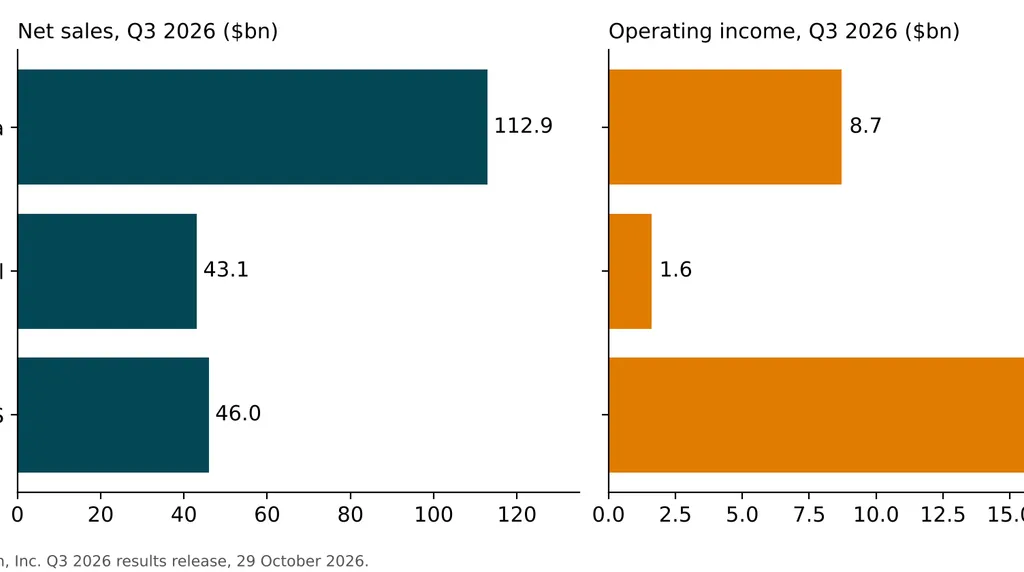
Chart 3: Net sales and operating income by segment, Q3 2026. Source: Amazon Q3 2026 release.3
AWS produced about 63% of Amazon’s group operating income in the quarter ($17.8 billion of $28.1 billion, a Vantage calculation) from about 23% of net sales ($46.0 billion of $201.9 billion).
A Short History of Amazon
Jeff Bezos founded Amazon in 1994 and launched its website as an online bookstore in July 1995. The company listed on NASDAQ in May 1997, launched Amazon Prime in 2005 and released the S3 storage and EC2 computing services in 2006. It acquired Whole Foods in 2017. Andy Jassy, who had led AWS, succeeded Bezos as chief executive in July 2021.16,17,18
Amazon Stock Price History: Splits, Highs, and Annual Returns
Amazon went public in 1997 and has split its shares four times since, most recently 20-for-1 in June 2022.19,20 The 52-week range now runs from $196.00 in mid-February 2026 to $287.20 in early August 2026.2
Amazon Stock Annual Price History From 2013 to 2025
| Year | Average Stock Price | Year Open | Year High | Year Low | Year Close | Annual % Change |
| 2025 | 217.67 | 220.22 | 254.00 | 167.32 | 230.82 | 5.21% |
| 2024 | 184.6287 | 149.9300 | 232.9300 | 144.5700 | 219.3900 | 44.39% |
| 2023 | 121.3728 | 85.8200 | 154.0700 | 83.1200 | 151.9400 | 80.88% |
| 2022 | 126.0988 | 170.4050 | 170.4050 | 81.8200 | 84.0000 | -49.62% |
| 2021 | 167.1934 | 159.3310 | 186.5700 | 147.5980 | 166.7170 | 2.38% |
| 2020 | 134.0427 | 94.9005 | 176.5720 | 83.8305 | 162.8460 | 76.26% |
| 2019 | 89.4596 | 76.9565 | 101.0490 | 75.0140 | 92.3920 | 23.03% |
| 2018 | 82.0863 | 59.4505 | 101.9760 | 59.4505 | 75.0985 | 28.43% |
| 2017 | 48.4084 | 37.6835 | 59.7915 | 37.6835 | 58.4735 | 55.96% |
| 2016 | 34.9762 | 31.8495 | 42.2180 | 24.1035 | 37.4935 | 10.95% |
| 2015 | 23.9069 | 15.4260 | 34.6985 | 14.3475 | 33.7945 | 117.78% |
| 2014 | 16.6275 | 19.8985 | 20.3525 | 14.3530 | 15.5175 | -22.18% |
| 2013 | 14.9016 | 12.8655 | 20.2195 | 12.4115 | 19.9395 | 58.96% |
Table 8: Amazon’s annual share price history, 2013 to 2025, split-adjusted, in US dollars. Past performance is not a reliable indicator of future results. Returns may increase or decrease as a result of currency fluctuations. Sources: Macrotrends for 2013 to 2024 (page version dated June 2025) and Yahoo Finance daily closes for 2025.21
Amazon Stock Split History
| Date | Split | Note |
| June 1998 | 2-for-1 | |
| January 1999 | 3-for-1 | |
| September 1999 | 2-for-1 | |
| June 2022 | 20-for-1 | Accompanied a $10 billion share buyback program. |
Table 9: Amazon stock splits since the 1997 listing. Sources: IG and AppleInsider.19,20
A split changes the number of shares and the price per share, not the value of the company, so prices from before June 2022 need split adjustment before they can be compared with today’s.
5 Factors That Move Amazon’s Share Price
These factors can influence the share price. None is a reliable predictor, and several can act at once or offset each other.
1. AWS Growth and AI Spending
AWS net sales grew 39.3% to $46.0 billion in Q3 2026 and produced $17.8 billion of operating income. Amazon expects about $220 billion of capital spending in 2026. A slowdown in AWS growth, or doubts that the spending will pay back, can weigh on the shares.3
2. Consumer Spending
North America net sales rose 6% to $112.9 billion and International net sales rose 5% to $43.1 billion. Retail results depend on household spending, which responds to inflation, jobs and confidence. Q4 is Amazon’s largest quarter by sales, so the $240.0 billion to $247.0 billion guidance is the next test.3
3. Advertising
Advertising revenue grew 11% to $19.6 billion, and Amazon guided to growth in the high teens for Q4. Faster growth than the recent rate gives investors a figure to check against.3
4. Interest Rates
Higher rates raise the discount applied to future earnings, which can weigh on growth shares, while lower rates can ease that pressure. The Federal Reserve meets on 8 and 9 December 2026 and publishes new projections.15
5. Legal and Regulatory Matters
Amazon discloses legal and regulatory proceedings in its filings, and outcomes can bring costs or changes to how it operates. Its Q4 guidance assumes, among other things, no additional legal settlements, so a settlement could move reported results away from guidance.3
Risks of Trading Amazon Share Spread Bets and CFDs
A spread bet or a CFD is a contract with the provider rather than a purchase of shares on the exchange, so it does not give ownership of the underlying shares or direct access to the exchange.
Amazon reports four times a year, and results can cause overnight gaps. After-hours trading on 29 October showed falls of more than 11% at one point, which shows how far a price can move while the regular market is closed.10 A stop-loss does not guarantee the exit price, particularly during gaps or fast markets.
Leverage means a small deposit, called margin, controls a larger position, and losses are calculated on the full position, so they can build quickly relative to the margin. For UK retail clients, FCA rules cap leverage on individual shares at 5:1, a 20% margin.25 Lower leverage requires more margin and can leave more room before a margin call, but it does not remove the risk of loss. Holding a spread bet or CFD overnight can incur financing charges, and spreads can be wider and liquidity lower outside normal market hours.
Worked Example (Hypothetical)
Suppose a trader opens a long position of 20 Amazon share CFDs at $243.79, the 29 October close. The position is worth 20 × $243.79 = $4,875.80. At the 5:1 UK retail limit, the margin would be at least $975.16, about £728 on a GBP account at a GBP/USD rate of 1.34.26
If the price gapped about 11% lower to $216.97, similar to the biggest after-hours fall reported that evening, the loss would be 20 × ($243.79 − $216.97) = 20 × $26.82 = $536.40, about £400, before spreads and financing. A stop-loss set between the entry price and $216.97 would not have protected the position at its set price, because the order could fill near the gapped price.
This is an illustration, not a prediction: the shares actually closed at $240.35 on 30 October, and this hypothetical example excludes spreads and financing, which would increase the loss.
How to Trade Amazon (AMZN) Shares With Vantage UK
With Vantage UK, Amazon can be traded as a spread bet or a share CFD, so you don’t own the shares. Both are linked to Amazon.com Inc shares on Nasdaq, where the stock trades as AMZN.
A spread bet is staked in pounds per point, while a CFD is sized in contracts, and the two are taxed differently; tax treatment depends on individual circumstances and may change in future. See spread betting vs CFDs for the differences.
| Specification | AMAZON share CFD |
| Underlying | Amazon.com Inc (Nasdaq: AMZN) |
| Contract size | 1 share per contract |
| Minimum volume per click | 0.10 |
| Maximum volume per click | 1,500 |
| Retail Leverage | 5:1 |
| Commission | Check the applicable product specifications |
| Trading hours | Monday to Friday, 14:30 to 21:00 UK time for most of the year |
Table 10: Key contract details for the Amazon share CFD. Source: Vantage contract specifications, accessed on 4 November 2026, with the leverage limit set to the FCA retail cap. Specifications can change, so check the platform for the latest terms.
One way to see how a share CFD behaves around earnings is to observe it on a demo account. A demo account is simulated, so prices and fills can differ from live trading.
Vantage Global Prime LLP, trading as Vantage, is authorised and regulated by the Financial Conduct Authority. FRN: 590299.
Amazon Stock FAQs
What Is Amazon’s Stock Symbol, and Which Exchange Does It Trade On?
Amazon trades as AMZN on the NASDAQ exchange, priced in US dollars. The regular session runs from 9:30am to 4:00pm Eastern Time, Monday to Friday, which is 14:30 to 21:00 UK time in winter (GMT), while US clocks are on Eastern Standard Time (UTC-5, since daylight saving ended on 1 November 2026)22. Pre-market trading starts at 4am and after-hours trading ends at 8pm Eastern Time.23 CFD trading hours can differ from exchange hours.
Why Is Amazon Stock Down?
Amazon closed at $259.30 on 6 November 2026, about 9.7% below its early-August high of $287.20. Since late August the shares have mostly moved between about $245 and $268, and the 29 October results added a sharp after-hours drop that was largely reversed by the next close. No single cause explains the drift. This is information, not advice.
What Is the Analyst Price Target for Amazon Stock?
StockAnalysis showed an average 12-month target of $326.99 on 8 November 2026, within a range of $230 to $405, and MarketBeat showed an average of $321.74 on the same day. Targets are third-party opinions that change often, and they are not a forecast.6,7
When Does Amazon Report Earnings Next?
Amazon had not confirmed the date of its Q4 2026 results in the sources reviewed on 3 November 2026. For Q4 2025, it announced the date on 22 January 2026 and reported on 5 February 2026. Confirmed dates are listed on its investor relations events page.8,24
How Many Times Has Amazon Stock Split?
Four times: 2-for-1 in June 1998, 3-for-1 in January 1999, 2-for-1 in September 1999 and 20-for-1 in June 2022.19,20
What Is Amazon’s 52-Week High?
The 52-week high is $287.20, reached intraday on 3 August 2026, against a 52-week low of $196.00 on 17 February 2026. The 6 November close of $259.30 was about 9.7% below the high.2,13
Does Amazon Pay a Dividend?
Market-data pages show no dividend for Amazon as of 3 November 2026.2 Its current policy is set out in its filings and on its investor relations site.24
Can You Trade Amazon Shares With Vantage UK?
With Vantage UK, Amazon can be traded as a spread bet or a share CFD, leveraged contracts that give price exposure without owning the shares. UK retail leverage on shares is capped at 5:1, and losses can build quickly.
What Time Does Amazon Stock Trade in the UK?
Nasdaq’s regular session runs from 14:30 to 21:00 UK time for most of the year. For about three weeks in March and about one week from late October to early November, when the US and UK change their clocks on different dates, it runs from 13:30 to 20:00 UK time. Amazon usually reports results after the US close, so the reaction comes after 21:00 UK time.
RISK WARNING: CFDs and Spread Bets are complex instruments and come with a high risk of losing money rapidly due to leverage. 72.65% of retail investor accounts lose money when trading CFDs and Spread Bets with this provider. You should consider whether you understand how CFDs and Spread Bets work and whether you can afford to take the high risk of losing your money.
Disclaimer: The information has been prepared as of 6 November 2026 and is subject to change thereafter. The information is provided for educational purposes only and doesn’t take into account your personal objectives, financial circumstances, or needs. It does not constitute investment advice. We encourage you to seek independent advice if necessary. The information has not been prepared in accordance with legal requirements designed to promote the independence of investment research. No representation or warranty is given as to the accuracy or completeness of any information contained within. This material may contain historical or past performance figures and should not be relied on. Furthermore, estimates, forward-looking statements, and forecasts cannot be guaranteed. The information on this site and the products and services offered are not intended for distribution to any person in any country or jurisdiction where such distribution or use would be contrary to local law or regulation.
Reference
- “Amazon.com, Inc. (NASDAQ: AMZN), daily chart with 50-day and 200-day moving averages and RSI(14) – TradingView” Chart created 3 November 2026.
- “Amazon.com, Inc. (AMZN) Stock Price, Quote and Overview – StockAnalysis” https://stockanalysis.com/stocks/amzn/ Accessed on 3 November 2026.
- “Amazon.com Announces Third Quarter Results – Amazon Investor Relations” https://ir.aboutamazon.com/news-release/news-release-details/2026/Amazon-com-Announces-Third-Quarter-Results/ Accessed on 3 November 2026.
- “Amazon Q3 2026 Earnings (AMZN) – 24/7 Wall St.” https://247wallst.com/cards/amazon-q3-2026-earnings-amzn-01m64mgs2373wqp8ya2hpcgve3 Accessed on 3 November 2026.
- “Amazon disappoints below expectations, Wall Street loses 7% – Il Sole 24 Ore” https://en.ilsole24ore.com/art/amazon-delude-sotto-attese-wall-street-perde-7percento-AJCFhYyB Accessed on 3 November 2026.
- “Amazon.com (AMZN) Stock Forecast and Price Target – MarketBeat” https://www.marketbeat.com/stocks/NASDAQ/AMZN/forecast/ Accessed on 8 November 2026.
- “Amazon.com, Inc. (AMZN) Stock Forecast and Price Target – StockAnalysis” https://stockanalysis.com/stocks/amzn/forecast/ Accessed on 8 November 2026.
- “Amazon.com to Webcast Fourth Quarter 2025 Financial Results Conference Call – Amazon Investor Relations” https://ir.aboutamazon.com/news-release/news-release-details/2026/Amazon-com-to-Webcast-Fourth-Quarter-2025-Financial-Results-Conference-Call Accessed on 3 November 2026.
- “Stock Market Today, Oct. 29: Amazon Falls on Q3 Earnings Report and Capex Concerns – The Motley Fool” https://www.fool.com/coverage/stock-market-today/2026/10/29/stock-market-today-oct-29-amazon-falls-on-q3-earnings-report-and-capex-concerns/ Accessed on 3 November 2026.
- “Amazon Earnings Report: Q3 AWS Growth, Advertising, Capital Expenditures, Free Cash Flow – TradingKey” https://www.tradingkey.com/analysis/stocks/us-stocks/262255314-amazon-earnings-report-q3-aws-growth-advertising-capital-expenditures-free-cash-flow-tradingkey Accessed on 3 November 2026.
- “Stock Market Today, Nov. 2: Amazon Rallies on Phillip Securities Buy Upgrade and $330 Target – The Motley Fool” https://www.fool.com/coverage/stock-market-today/2026/11/02/stock-market-today-nov-2-amazon-rallies-on-phillip-securities-buy-upgrade-and-330-target/ Accessed on 3 November 2026.
- “Amazon (AMZN) Stock Slides as Investors Sell, but Wall Street Analysts Stay Bullish – TipRanks” https://www.tipranks.com/news/amazon-amzn-stock-slides-as-investors-sell-but-wall-street-analysts-stay-bullish Accessed on 3 November 2026.
- “AMZN Price History – StockScan” https://stockscan.io/stocks/AMZN/price-history Accessed on 3 November 2026.
- “AWS re:Invent 2026 – Amazon Web Services” https://aws.amazon.com/events/reinvent/ Accessed on 3 November 2026.
- “FOMC Meeting Calendars – Federal Reserve” https://www.federalreserve.gov/monetarypolicy/fomccalendars.htm Accessed on 3 November 2026.
- “History of Amazon – Wikipedia” https://en.wikipedia.org/wiki/History_of_Amazon Accessed on 3 November 2026.
- “Amazon (company) – Wikipedia” https://en.wikipedia.org/wiki/Amazon_(company) Accessed on 3 November 2026.
- “Timeline of Amazon Web Services – Wikipedia” https://en.wikipedia.org/wiki/Timeline_of_Amazon_Web_Services Accessed on 3 November 2026.
- “Amazon stock split history: what you need to know – IG” https://www.ig.com/en/trading-strategies/amazon-stock-split-history–what-you-need-to-know-190725 Accessed on 3 November 2026.
- “Amazon announces 20-for-1 stock split, $10 billion buyback program – AppleInsider” https://appleinsider.com/articles/22/03/10/amazon-announces-20-for-1-stock-split-10-billion-buyback-program Accessed on 3 November 2026.
- “Amazon – 27 Year Stock Price History | AMZN – Macrotrends” https://www.macrotrends.net/stocks/charts/AMZN/amazon/stock-price-history Accessed on 3 November 2026 (cached page version dated June 2025).
- “When do the clocks go back in 2026? – Time Out” https://www.timeout.com/usa/news/when-do-the-clocks-go-back-in-2026-heres-when-daylight-saving-time-officially-ends-100626 Accessed on 3 November 2026.
- “Extended-hours trading – Wikipedia” https://en.wikipedia.org/wiki/Extended-hours_trading Accessed on 3 November 2026.
- “Events – Amazon Investor Relations” https://ir.aboutamazon.com/events/default.aspx Accessed on 3 November 2026.
- “COBS 22.5 Restrictions on the retail marketing, distribution and sale of contracts for differences and similar speculative investments – FCA Handbook” https://handbook.fca.org.uk/handbook/cobs22/cobs22s5 Accessed on 8 November 2026.
- “GBP/USD (GBPUSD=X) – Yahoo Finance” https://uk.finance.yahoo.com/quote/GBPUSD%3DX/ Accessed on 8 November 2026.
- “Amazon.com, Inc. (AMZN) historical data – Yahoo Finance” https://uk.finance.yahoo.com/quote/AMZN/history/ Accessed on 8 November 2026.
- “Amazon (AMZN) Stock Forecast & Analyst Price Targets – TipRanks” https://www.tipranks.com/stocks/amzn/forecast. Accessed on 8 November 2026.
Key Points In This Article

Latest Academy Articles


Market News Tags
- # Asian Markets News Today
- # Crude Oil News Today
- # Earnings News Today
- # Economic News Today
- # Featured News
- # Federal Reserve News
- # Commodity Market News
- # Interest Rate News
- # Financial News
- # Forex News Today
- # Gold News Today
- # Market News Today
Related Articles
- Largest Stock Exchanges in the World: Top 10 by Market Capitalisation in 2026
- Alphabet (GOOGL) Stock in Q3 2026: Latest Results, Analyst Targets and How UK Traders Trade It
- CFD Trading Explained: What It Is and How to Trade CFDs in the UK
- Negative Balance Protection in the UK: How It Works and What It Doesn’t Cover
- 10 CFD Trading Strategies UK Traders Should Know
- Candlestick Patterns: How to Read 18 Patterns on Price Charts
- Best Trading App in the UK: Six Broker Apps for Trading on Your Phone
- Spread Betting vs. CFDs: What’s The Difference?