

 Login
Login






 Updated
Contracts for difference (CFD) have become a prominent trading instrument among market participants due to their versatility and accessibility. They allow traders to utilise leverage, which can make more efficient use of capital but also increases the potential for losses, and provide access to a broad range of global markets—from equities and indices to commodities and forex.
An essential aspect of CFD trading lies in the vast array of strategies that can be applied. Whether responding to market trends, volatility, or price consolidations, traders can choose from various approaches tailored to the characteristics of specific instruments or market conditions.
This article explores 10 commonly used CFD trading strategies and outlines key considerations that may help traders navigate potential pitfalls more effectively.
Key Points
- CFD trading offers a diverse range of strategies, from momentum-based to news-driven approaches, with each strategy selection aligned to your preferred trading timeframe, market behaviour, and capital management plan.
- Each strategy involves specific tools, entry signals, and holding periods that are tailored to particular market conditions—whether trending, volatile, or range-bound.
- Mastery comes from combining strategy with disciplined execution, robust risk management, and continuous evaluation and adaptation to refine your approach as market conditions evolve.
What Are CFDs?
A contract for difference (CFD) is a type of financial derivative that enables traders to speculate on the price movements of a wide range of underlying assets—such as shares, indices, commodities, and forex—without owning the actual asset.
When trading CFDs, the trader enters into a contract with a broker to exchange the difference in the asset’s value between the opening and closing of the trade. The difference represents a gain if the price moves in the anticipated direction. But that same difference can result in a loss if it moves against the anticipated direction.
One of the primary features of CFD trading is leverage, which allows traders to open larger positions with a relatively smaller amount of capital. As leverage increases exposure, it also heightens the risk of potential losses, making risk management a key consideration in CFD trading.
CFDs also offer the flexibility to go long (buy) when anticipating a price increase or short (sell) when anticipating a price decline. This bi-directional capability makes CFDs popular in various market conditions, including periods of volatility or downward trends.
What Markets Can I Trade CFDs In?
CFDs can be used to trade a wide variety of global markets. Each market carries distinct characteristics, ranging from volatility and liquidity to geopolitical sensitivity and economic influence.
Understanding these markets is essential to selecting strategies that align with asset behaviour and broader market trends. Below are several key CFD markets commonly accessed by traders.
Forex
The forex market is one of the largest and most liquid financial markets globally. According to the Bank for International Settlements, trading in over-the-counter (OTC) foreign exchange markets reached $7.9 trillion daily in April 2025, marking a 19% increase from $6.6 trillion three years earlier. This substantial volume reflects the high level of participation and continuous market activity across all time zones.
CFD trading on forex enables individuals to speculate on currency pairs—such as EUR/USD or GBP/JPY—without the need to own physical currency. With access to major, cross-currency, and exotic pairs, forex CFDs offer diverse opportunities influenced by economic indicators, central bank policy, and geopolitical developments.
Explore our forex trading page to learn more.
Indices
Indices represent the performance of a group of selected stocks, typically from a specific country or sector. CFD trading on indices allows traders to speculate on the broader movement of markets like the S&P 500, DJI 30, FTSE 100, DAX, Nikkei 225, and HSI. These indices are often influenced by macroeconomic events, earnings seasons, and central bank policies.
To illustrate the scale of index markets:
- The S&P 500 total market cap was approximately $60.57 trillion as of 27 May 2025.
- The Dow Jones Industrial Average (DJI 30), composed of 30 major US companies, has seen daily trading volumes in its tracking ETF (DIA) average over 3 million shares traded per day.
- The Nikkei 225, Japan’s leading equity index, surpassed 40,000 points in February 2024 for the first time. It reached an all-time high of 42,438 in July of the same year, signalling strong performance in Asia-Pacific markets.
- The Hang Seng Index (HSI) is a key indicator of Hong Kong’s equity market and China-related listings. By the end of April 2025, its total market capitalisation had risen to HKD 38.8 trillion—reflecting growing investor confidence and strengthened market activity in the region.
Shares
Share CFDs enable traders to gain exposure to individual companies listed on global exchanges, such as Apple, Tesla, Nvidia and Amazon, without owning the underlying stock. This allows for long and short trading, dividend adjustments, and leveraging opportunities across sectors and geographies.
However, always bear in mind that CFD is a leveraged instrument, with the potential to amplify both potential gains and potential losses.
Gold
Gold is traditionally viewed as a safe-haven asset, often gaining appeal during periods of economic uncertainty or rising inflation. Gold CFD trading enables market participants to speculate on its price movements without the need to own or store physical bullion. It is one of the most closely watched commodities and frequently responds to macroeconomic indicators such as interest rates, inflation figures, and geopolitical developments.
In April 2025, gold reached an all-time high of USD3,500, underscoring its enduring role as a store of value during times of heightened market volatility.
Explore live prices and opportunities on our gold CFD page.
Metals
Beyond gold, metals like silver, platinum, and copper also offer dynamic trading opportunities. These industrial and precious metals are influenced by factors such as supply-demand dynamics, mining output, and industrial usage. CFDs allow traders to speculate on metal prices without physical delivery, but its leveraged nature increases trading risk.
Visit our metals CFD section to view available products.
Commodities
Commodities such as oil, natural gas, and agricultural goods are essential to the global economy. Weather patterns, geopolitical developments, and inventory reports influence their prices. CFD trading allows participation in these markets with flexible position sizing and without owning the physical goods, although adverse price movements can lead to rapid losses.
Learn more through our commodity CFD trading page.
Bonds
Bond CFDs enable traders to speculate on government debt instruments such as U.S. Treasuries and German Bunds. These instruments are typically influenced by factors including interest rate expectations, inflation trends, and fiscal policies. Bond markets often serve as indicators of investor sentiment and broader macroeconomic conditions.
In 2025, bond markets experienced significant volatility, influenced by fiscal and trade policies introduced during President Donald Trump’s second term. The implementation of sweeping tariffs in April 2025, referred to as “Liberation Day,” led to a sharp sell-off in US Treasury bonds. This sell-off caused yields to spike, with the 30-year Treasury yield rising to 4.92%, marking the most substantial three-day increase since 1982.
Explore our bond CFD trading page for more details.
10 CFD Trading Strategies for Traders
There are multiple CFD trading strategies that can be tailored to various market conditions, trading goals, and time horizons. Each approach is shaped by different principles—whether technical, fundamental, or behavioural—and may align with specific asset types or levels of market volatility. The following strategies represent some of the most commonly observed approaches among CFD traders.
The following examples are for illustrative purposes only and do not represent actual trading recommendations.
1. Trend Strategy
The trend strategy is built on the principle that CFD trading markets tend to move in identifiable directions over time—either upward, downward, or sideways. Traders employing this CFD trading strategy aim to align with the prevailing trend by entering positions in its direction and exiting when indicators suggest a potential reversal. Common tools used to confirm trends include moving averages, trendlines, and momentum indicators.
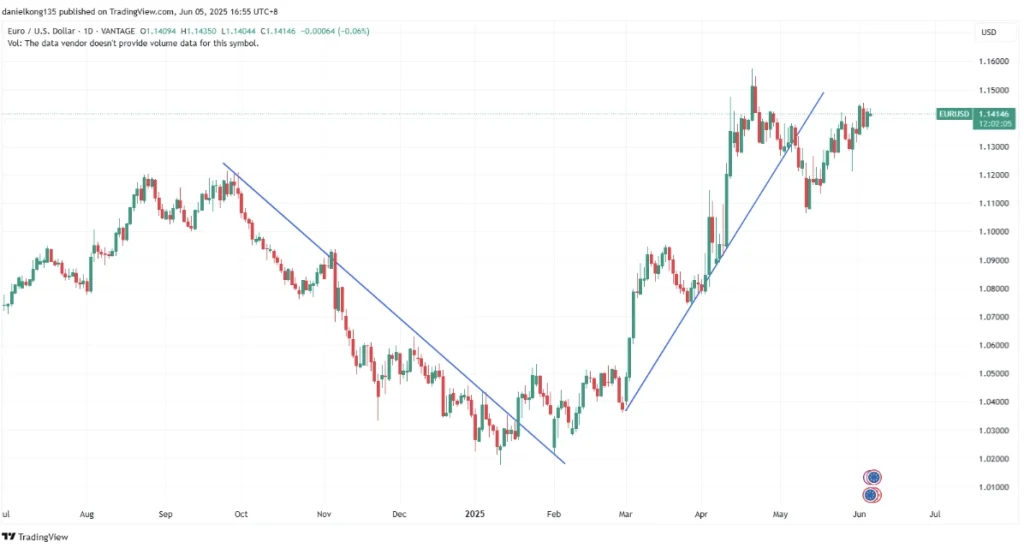
Chart 1: EUR/USD Daily Price Chart – Trend Progression. Source: tradingview.com
The chart above displays the price movement of EUR/USD over a multi-month period, highlighting the development and transition of market trends.
In the earlier part of the chart, EUR/USD enters a noticeable downtrend, marked by a consistent series of lower highs and lower lows. A trend-following trader, observing this decline, may have entered a short position, seeking to capitalise on the bearish momentum while managing risk with trailing stops or predefined exit levels.
Following this downtrend, the currency pair moves into a consolidation phase, where prices stabilise and range-bound trading activity becomes more apparent. This pause in directional movement often precedes a potential breakout.
Subsequently, the pair breaks upward, initiating a new bullish trend. Traders looking for confirmation of the trend reversal may wait for the formation of higher highs and higher lows, which becomes evident as the rally continues through the right-hand side of the chart. The appearance of strong bullish candles, particularly during the breakout and follow-through phases, provides further evidence of growing upward momentum.
This example illustrates how trend traders adapt their approach depending on market phases—either entering early based on pattern recognition, or waiting for confirmation through structure and price continuity. Regardless of the timing, the key objective remains: To participate in sustained directional movement while managing risk in the event of a reversal.
2. Price Action
Price action trading involves analysing historical price movements and chart patterns without relying heavily on technical indicators. It focuses on the raw price behaviour to interpret market sentiment and identify possible entry or exit points within the CFD market. Candlestick formations, support and resistance levels, and momentum shifts are typically central to this approach.
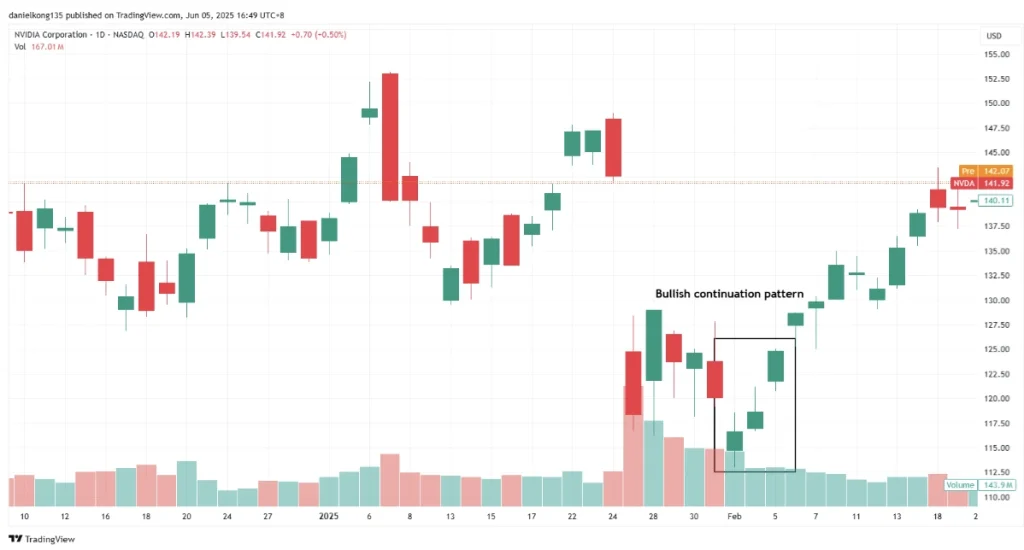
Chart 2: Nvidia Daily Price Chart – Bullish Candle Formation. Source: tradingview.com
In the highlighted section of the chart above, NVDA displays a series of three consecutive bullish candles, each closing higher than the previous one. This sequence forms what is commonly referred to as a bullish continuation pattern, which price action traders may interpret as a signal of building upward momentum.
The formation occurs after a short-term pullback, suggesting a shift in sentiment from selling pressure to renewed buying interest. Importantly, these candles form without breaking below recent support, which may further reinforce a trader’s confidence in the strength of the move.
A price action trader, observing this pattern in real time, may consider this area as an early indication of a trend resumption. The long-bodied candles with relatively small upper wicks indicate strong buyer control throughout the sessions—characteristics that often precede further upward movement.
As seen later in the chart, NVDA continues to rally after this formation, which can be viewed as a confirmation of the initial bullish signal. This example underscores how price action strategies rely on visual cues and behavioural patterns within the price chart itself, without the need for overlays such as moving averages or oscillators.
3. Breakout
Breakout strategies are another type of CFD trading strategies designed to capture price movements that occur when an asset breaks through a clearly defined support or resistance level. Such breakouts often mark the beginning of a new trend and are typically accompanied by increased volatility and, in some cases, a rise in trading volume. As part of broader CFD trading strategies, traders applying this approach look for periods of consolidation or tight price ranges, followed by decisive moves beyond those boundaries.
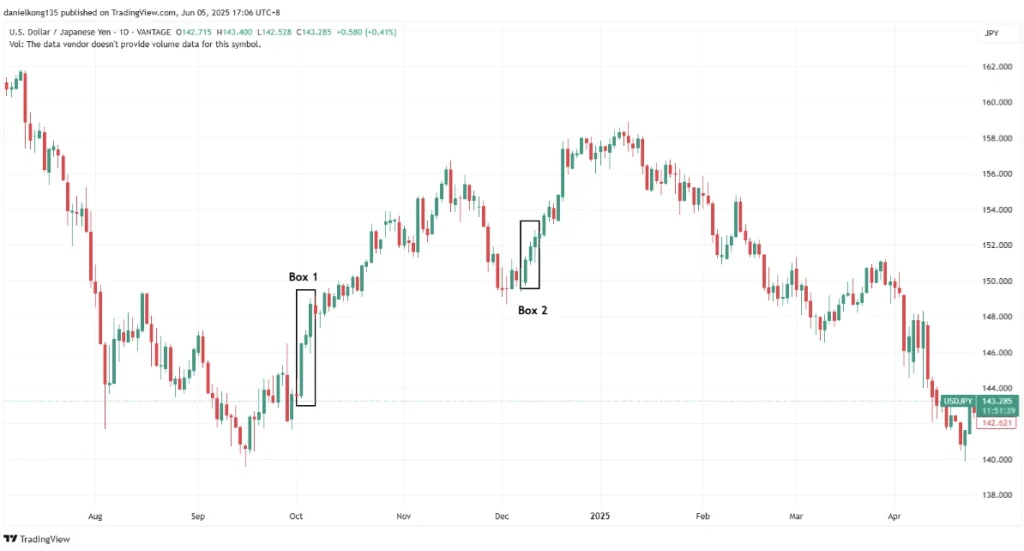
Chart 3: USD/JPY Daily Price Chart – Breakout Examples. Source: tradingview.com
The chart above illustrates two distinct breakout setups within the USD/JPY currency pair over a several-month period. Each boxed region highlights a different type of breakout scenario within varying market contexts.
- First Box (Early October 2024): This segment shows a strong bullish breakout following a period of sideways price action during September. The pair had been trading within a narrow range, establishing a short-term resistance level. In early October, USD/JPY decisively broke above this ceiling with a series of large bullish candles—an indication of renewed buying interest and trend reversal. This move demonstrates a breakout from consolidation, often considered one of the clearest signals in breakout trading.
- Second Box (Mid-December 2024): The second breakout occurs during an ongoing uptrend. After a minor retracement in early December, USD/JPY resumes upward movement. The boxed area highlights a cluster of bullish candles breaking above a short-term resistance level. This setup represents a continuation breakout, where the trend briefly pauses before accelerating again. Such formations are common in trending markets and are often used to add to existing positions.
In both cases, traders using breakout strategies would typically look for confirmation through price closing above the resistance level and maintaining momentum. While the first breakout may appeal to traders seeking trend reversals, the second is suited to those aiming to trade with the trend.
These examples highlight how breakout trading can be applied in different market phases. The key lies in identifying potential breakout zones, assessing confirmation signals, and managing risk should the breakout fail or retrace.
4. Technical Indicators
This CFD trading strategy involves using mathematical tools based on price and volume data to inform trading decisions. Common technical indicators include the Relative Strength Index (RSI), Moving Average Convergence Divergence (MACD), Bollinger Bands, and Fibonacci retracements. These tools are widely used in CFD trading to help identify trend direction, momentum, volatility, and possible reversal zones.

Chart 4: Tesla (TSLA) Daily Chart with RSI Overlay. Source: tradingview.com
The chart above displays the daily price action of Tesla along with the Relative Strength Index (RSI) and a moving average of the RSI. This setup offers insight into how traders might apply indicators to analyse momentum and potential entry or exit signals.
- In July, the RSI briefly crosses above the 70 line—commonly interpreted as an overbought condition. This coincides with a local peak in TSLA’s price, followed by a short-term pullback. This alignment demonstrates how RSI can serve as an early warning for a potential reversal or correction.
- Moving forward into October–November, the RSI climbs steadily, confirming increasing bullish momentum as TSLA’s price rallies strongly. The RSI remains well above the midpoint (50), reinforcing the strength of the upward move.
- In December, the RSI reached elevated levels again, followed by a divergence: While TSLA continues to rise to new highs, the RSI starts to decline. This bearish divergence is often seen as a sign that upward momentum is weakening— indeed, TSLA begins a downtrend shortly thereafter.
- By early 2025, the RSI dips below 30, entering oversold territory. Traders monitoring this may interpret it as a potential buying opportunity, particularly when confirmed by price stabilisation or volume increase.
This example illustrates how RSI can help traders identify overbought or oversold conditions, spot momentum shifts, and support trend analysis. While no indicator is infallible, tools like RSI provide valuable context when used alongside broader market analysis and risk management techniques.
5. Momentum Trading
Momentum trading is a CFD trading strategy that seeks to capitalise on strong directional price movements—whether upward or downward—driven by high trading volume and market sentiment. As part of broader CFD trading strategies, traders using this approach aim to enter positions as momentum builds and exit before it weakens.
This strategy often relies on technical indicators such as the Relative Strength Index (RSI), MACD, or volume-based tools to confirm the strength of a trend. It is commonly applied in fast-moving markets where price action accelerates following news releases, earnings reports, or breakouts from key technical levels.

Chart 5: PLTR Hourly Chart – Momentum Breakout and RSI Confirmation. Source: tradingview.com
The chart above shows a clear example of bullish momentum on PLTR’s hourly chart. Starting in mid-April, the stock begins forming higher highs and higher lows, supported by increasing buying pressure.
- Price Action: The sharp upward movement toward the right side of the chart reflects a strong bullish rally, typical of a momentum breakout. The candles are large-bodied, with minimal wicks, suggesting strong and continuous buying.
- RSI Signal: The RSI climbs above 70 in early May, entering the overbought zone. While traditionally seen as a reversal area, in momentum trading, RSI crossing above 70 is often interpreted as confirmation that momentum is accelerating. Toward the end of the chart, RSI peaks at 73.10, confirming strong buying sentiment.
- Volume Confirmation: The uptrend is supported by elevated volume bars, particularly visible around breakout points, indicating market participation and conviction behind the move.
6. Day Trading
Day trading involves executing trades within a single trading day, with all positions closed before the market session ends. This CFD trading strategy eliminates overnight risk and focuses exclusively on short-term price movements.
Day traders typically rely on technical analysis, strict entry and exit criteria, and disciplined risk management to navigate market volatility. It’s a widely used approach in highly liquid CFD trading markets such as forex, indices, and commodities.

Chart 6: USD/CHF 5-Minute Chart – Intraday Trading Example. Source: tradingview.com
The chart above demonstrates a practical application of day trading on the USD/CHF currency pair using a 5-minute timeframe. This intraday setup features two distinct trade cycles executed during the same session:
- First Trade (Buy Position): The first trade is initiated during a sharp recovery from a preceding downtrend. A long position is opened as the price begins to reverse upward, indicating a potential intraday rebound. This trade is closed shortly after, capturing gains from the initial bullish momentum.
- Second Trade (Buy Position): Following a brief retracement, the trader enters a second long position after the price stabilises and begins to climb again. The position is closed as the upward trend matures, locking in profits before market conditions potentially reverse later in the day.
This example reflects key day trading principles:
- Timing: Trades are timed based on intraday price action, with attention to short-term trend shifts.
- Quick Execution: Positions are entered and exited rapidly, often within hours.
- No Overnight Risk: Both trades are completed within the day, in line with the day trading strategy.
By focusing on short-term opportunities and adhering to pre-defined risk parameters, day traders aim to benefit from price fluctuations throughout the trading session—without the uncertainty that comes with holding positions overnight.
7. Swing Trading
Swing trading is a medium-term CFD trading strategy focused on capturing short- to intermediate-term price movements—known as swings—within a larger trend. Traders using this approach typically hold positions for several hours to a few days or even weeks, depending on the strength and duration of the move.
Rather than reacting to every tick or candlestick, swing traders aim to:
- Enter positions near the beginning of a swing, typically following a pullback or breakout.
- Exit positions before the market reverses or consolidates.
Use technical indicators, price structure, and support/resistance zones to identify swing highs and lows.
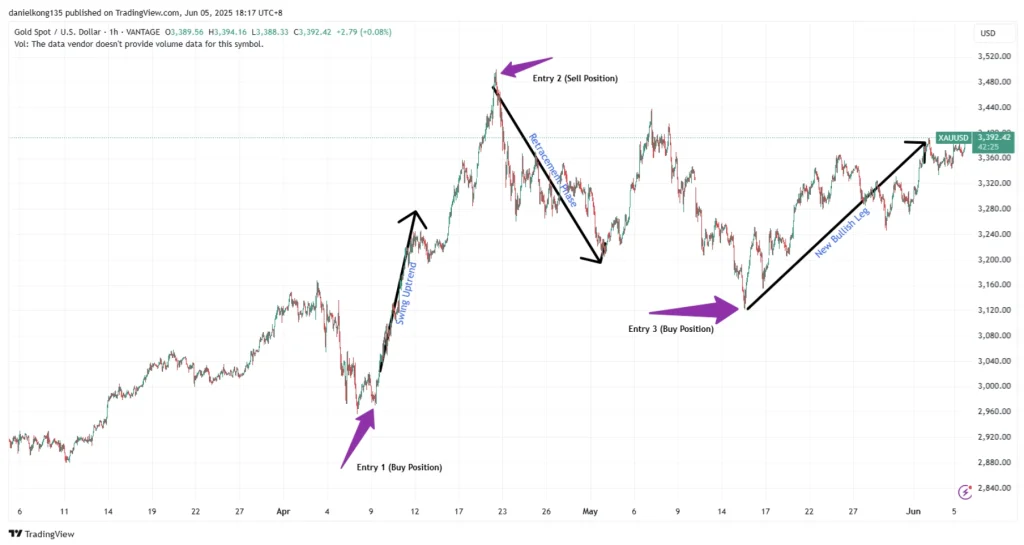
Chart 7: Gold Spot (XAU/USD), 1-Hour Chart Swing Trading Example. Source: tradingview.com
The chart shows several distinct price swings in gold (XAU/USD), ideal for illustrating a swing trading approach.
In early April, gold breaks out from consolidation and begins a strong ascent, forming a pattern of higher highs and higher lows. A swing trader may have entered a long position following the breakout, capturing the upside as momentum carried the price higher. As the rally began to fade, the position would be closed near the peak, locking in profits before conditions changed.
The trend then shifts into a downward correction, marked by lower highs and lows. A short position could be taken during this phase to benefit from the retracement, with the trade closed as price action began to stabilise heading into May.
By early May, gold finds support and starts to build higher lows again, indicating bullish momentum. A new long position may be taken as the price breaks above a prior resistance level, followed by a steady rise over the next several days. The trade is closed near a key resistance zone as the market pauses once more.
- Entry 1 (Buy Position): Early April — Initiated after a breakout from consolidation, supported by rising momentum and higher lows.
- Entry 2 (Sell Position): Mid-April — Short position taken during a corrective downtrend, confirmed by lower highs and weakening price structure.
- Entry 3 (Buy Position): Early May — Long position entered as the price rebounds from support, forming a new bullish swing with higher lows and strong follow-through.
This sequence highlights how swing traders aim to capture profit from directional moves, adjusting their positions as trends unfold. Rather than staying in for the entire cycle, trades are placed in response to key structural changes and momentum shifts—allowing flexibility across bullish, bearish, and range-bound conditions.
8. Position Trading
Position trading involves holding trades for an extended period—weeks, months, or even longer. It is grounded in macroeconomic analysis, fundamental factors, and long-term technical patterns. This strategy often ignores short-term noise and focuses on broader trends or economic cycles.

Chart 8: Coca-Cola Price Chart – A Classic Example of Long-Term Conviction. Source: tradingview.com
One of the most well-known real-world examples of position trading in action is Warren Buffett’s investment in The Coca-Cola Company (KO).
Following the 1987 market crash—also known as Black Monday—many investors remained cautious. But Buffett, chairman of Berkshire Hathaway, saw an opportunity in Coca-Cola’s underlying fundamentals. In 1988, he invested over $1 billion in the company, acquiring a 6.2% stake, which at the time became the largest single position in Berkshire’s portfolio.
Despite short-term uncertainty, Buffett’s rationale reflected a classic position trading mindset:
- Strong Brand Value: Coca-Cola was—and still is—one of the world’s most recognisable and globally distributed brands, with a dominant position in the non-alcoholic beverage sector.
- Consistent Business Growth: When Buffett began buying shares, Coca-Cola’s market capitalisation was around $16 billion. As of August 2024, that figure has grown to over $298 billion.
- Reliable Dividend Income: The company has maintained a track record of dividend growth. As of October 2024, Coca-Cola pays $0.485 per share in quarterly dividends, reflecting its enduring profitability.
Buffett’s philosophy of holding investments for the long term illustrates the patience and conviction often associated with position trading. However, this approach should be distinguished from CFD trading, where ongoing funding costs can make holding leveraged positions over extended periods less suitable. For CFD traders, position trading is generally focused on capturing medium- to longer-term market movements rather than holding positions indefinitely.
9. Range Trading
Range trading is based on the assumption that prices will continue to move between established support and resistance levels rather than forming a sustained trend.
Traders typically look for a range in which price has tested both the upper and lower boundaries multiple times and repeatedly reversed from them. This can create potential opportunities to enter long positions near support and consider short positions or take profits near resistance, provided the range remains intact.
Range trading is generally associated with sideways markets, although a breakout can occur at any time and invalidate the setup.

Chart 9: AAPL 5-Minute Chart – Defined Range in Sideways Market. Source: tradingview.com
The chart above shows Apple Inc. (AAPL) on a 5-minute timeframe, illustrating range-bound behaviour. Over the observed period, price repeatedly tests and rebounds from the horizontal support and resistance levels, marked in red and blue respectively. The repeated reactions at these levels help establish the boundaries of the range: price finds buying interest around the $201.14 support level on multiple occasions, while selling pressure emerges near $202.74 resistance, causing price to reverse rather than continue higher.
CFD traders using a range trading strategy may look for long entries near support when there are signs that the level is holding, and short positions or profit-taking opportunities near resistance when upward momentum appears to stall. Additional signals, such as increased volume around these boundaries, may provide further confirmation of a potential reversal. However, if price breaks decisively through either support or resistance, the range may no longer be valid, increasing the risk of losses for traders positioned on the assumption that it will hold.
10. News Trading
News trading is another commonly used CFD trading strategy. It’s based on the market’s reaction to economic data releases, geopolitical developments, or corporate announcements. Traders attempt to capitalise on the volatility and rapid price movements that follow news events. This strategy requires close attention to economic calendars and an understanding of how different markets respond to fundamental shifts.
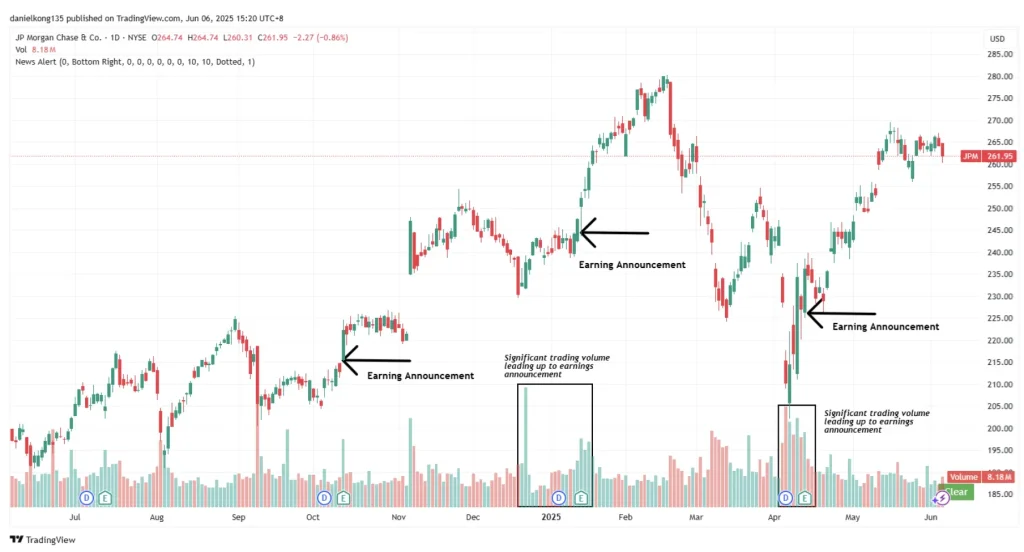
Chart 10: JPMorgan Chase & Co. (JPM) – Earnings as a News Trading Catalyst. Source: tradingview.com
Each marked earnings event is followed by a noticeable increase in price movement and trading volume. In some cases, volume even begins to rise before the announcement, as traders position themselves for the expected result. This kind of price and volume surge is exactly what news traders look for.
Rather than holding for the long term, news traders typically aim to enter and exit trades quickly—sometimes within the same day—based on how the market responds to the news.
Why news trading strategy is popular among CFD traders:
- Volatility Creates Opportunity: Prices can move fast after news, creating short-term trade setups.
- Events Are Scheduled: Economic data and earnings have set release times, making them easy to plan around.
- Volume Tells a Story: Sharp increases in trading volume can signal that a big move is coming.
- No Need to Predict the News: Some traders trade the reaction, not the result—waiting for confirmation before entering.
News trading can be powerful, but it requires discipline, quick decision-making, and solid risk management—especially in fast-moving markets which carry the risk of substantial losses if the markets move unfavourably.
Choosing the Right CFD Trading Strategy
From short-term approaches like day trading and breakouts to longer-term techniques such as swing and position trading, there are various CFD trading strategies tailored to different market conditions and trading styles. Each method aligns with specific objectives, whether capitalising on volatility, trend continuation, or market consolidation.
Choosing the right strategy depends on factors such as risk tolerance, time horizon, and asset preference. While trend and range strategies rely on market structure, news trading responds to real-time events, and position trading focuses on fundamentals. Regardless of the approach, disciplined risk management remains essential—particularly when using leverage in volatile environments.
Explore our platform to access live CFD products, analysis tools, and educational resources tailored to your trading journey. If you’re confident of your next market move, open a live trading account with Vantage today.
Disclaimer: The information is provided for educational purposes only and doesn’t take into account your personal objectives, financial circumstances, or needs. It does not constitute investment advice. We encourage you to seek independent advice if necessary. The information has not been prepared in accordance with legal requirements designed to promote the independence of investment research. No representation or warranty is given as to the accuracy or completeness of any information contained within. This material may contain historical or past performance figures and should not be relied on. Furthermore estimates, forward-looking statements, and forecasts cannot be guaranteed. The information on this site and the products and services offered are not intended for distribution to any person in any country or jurisdiction where such distribution or use would be contrary to local law or regulation.
The information has been prepared as of the date published and is subject to change thereafter. The information is provided for educational purposes only and doesn't take into account your personal objectives, financial circumstances, or needs. It does not constitute investment advice. We encourage you to seek independent advice if necessary. The information has not been prepared in accordance with legal requirements designed to promote the independence of investment research. No representation or warranty is given as to the accuracy or completeness of any information contained within. This material may contain historical or past performance figures and should not be relied on. Furthermore estimates, forward-looking statements, and forecasts cannot be guaranteed. The information on this site and the products and services offered are not intended for distribution to any person in any country or jurisdiction where such distribution or use would be contrary to local law or regulation.