
CFDs and Spread Bets are complex instruments and come with a high risk of losing money rapidly due to leverage. 72.65% of retail investor accounts lose money when trading CFDs and Spread Bets with this provider. You should consider whether you understand how CFDs and Spread Bets work and whether you can afford to take the high risk of losing your money.


 Login


SEARCH
-
Search query too short. Please enter a full word or phrase.
-

Keywords
Popular Search


SEARCH
-
Search query too short. Please enter a full word or phrase.
-
Keywords
Popular Search



Candlestick Patterns: A Beginner’s Guide to Reading Price Charts

Vantage Editorial Team >
7 January 2025 | Academy | 29 min read
Vantage Editorial Team >
Vantage is a global, multi-asset broker with a team of in-house writers and market analysts who produce educational and insightful trading content for traders of all levels.
Candlestick patterns are recurring shapes formed by one or more candlesticks on a price chart, and traders use them to read shifts in buying and selling pressure and to anticipate possible reversals or continuations in a trend. Each candle plots the open, high, low, and close for a set period, and the way those four prices relate to each other is what gives a candle — or a group of candles — its meaning.
This guide covers candlestick anatomy, how to read a chart, and 18 of the most widely used patterns, split into reversal and continuation groups, with a cheat sheet, real chart examples, and a section on where these patterns fall short. Whether you’re completely new to candlestick charts or already trading and want a fuller reference, start with the anatomy section below or jump straight to the cheat sheet.
What Is a Candlestick?
Candlesticks are a key tool used in trading to represent price movements of an asset over a specific time period. Each candlestick displays four essential pieces of information — its open, high, low, and close (often shortened to OHLC):
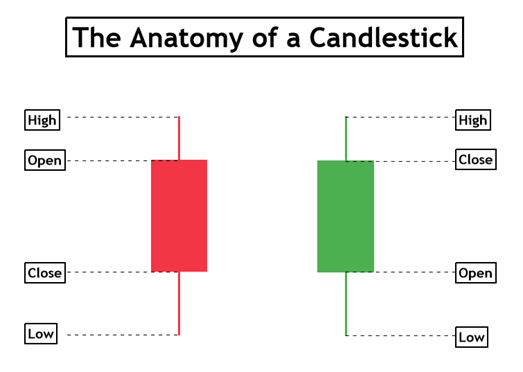
Open: The price of an asset at the start of the trading period, showing where the market begins. It provides a baseline for comparison with the close to determine whether the price has risen or fallen.
Close: The final price of an asset at the end of the trading period. It is a key indicator of market sentiment and is compared with the open to assess whether the market ended higher (bullish) or lower (bearish).
High: The maximum price reached by the asset during the trading period. It reflects the strongest point of buyer interest before the price retraces.
Low: The minimum price the asset reached within the trading period. It shows the lowest point of selling pressure before the price rebounded.
The rectangular part between the open and close is the real body; the thin lines above and below it are the wicks (or shadows), marking the high and low. With all this information derived from one humble candlestick, do not underestimate the value of using candlesticks in your trading — each one tells a certain story.
How to Read a Candlestick Chart
Interpreting candlestick charts is key to understanding market sentiment.
A bullish candle indicates that the price closed higher than it opened, signalling buyer dominance and an upward move. This is typically represented by a green candle. In contrast, a bearish candle shows that the price closed lower than it opened, reflecting stronger selling pressure and a downward move. This is usually represented by a red candle.
Beyond the basic colour of the candlestick, the length of the candle’s body and wicks can provide further insight. A long body suggests strong buying or selling pressure, while a short body indicates indecision or a lack of significant movement. Long wicks on either side of the body may reveal price rejection at those levels, suggesting potential reversals or trend changes — as the pattern sections below explain in more detail.
Why Use Candlestick Charts?
Candlestick charts are widely used by traders because they provide a clear visual representation of price movements within a specific period. One of the key advantages of candlesticks is that they offer more detail than simple line charts, allowing traders to quickly grasp market sentiment and identify potential trends.
The distinct shapes, colours, and patterns formed by candlesticks provide deeper insight into whether an asset is in a bullish or bearish trend, helping traders refine both their short-term and long-term strategies.
Candlestick charts can also reveal reversal or continuation patterns that may not be easily spotted using other chart types. By recognising these patterns, traders can factor them into their forex trading strategies, though — as covered later in this guide — a pattern alone is rarely a reason to enter a trade on its own.
Reversal Candlestick Patterns
Reversal patterns suggest that the prevailing trend may be losing momentum and could turn in the opposite direction. They’re grouped below by how many candles form the signal: one, two, or three. As a general rule, the more candles involved in a pattern, the more confirmation it carries — but no candlestick pattern should be traded in isolation. All of the patterns below are typically used alongside support and resistance levels, as in the case studies further down this section.
One-Candle Reversal Patterns
Single-candle patterns are quick to spot but carry the least confirmation on their own, so location — near a clear support or resistance level — matters more than for any other group.
Hammer
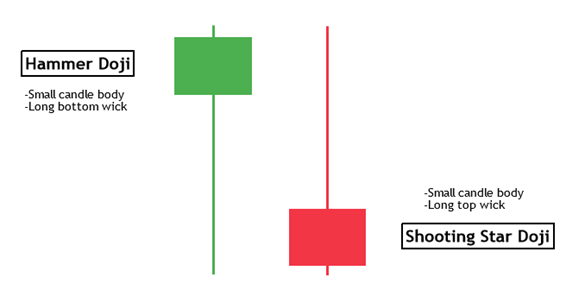
A Hammer has a small body near the top of its trading range, little or no upper wick, and a lower wick at least twice the length of the body. It forms after a downtrend and suggests that sellers pushed the price down during the session, but buyers stepped in and drove it back up by the close — a possible sign that selling pressure is fading.
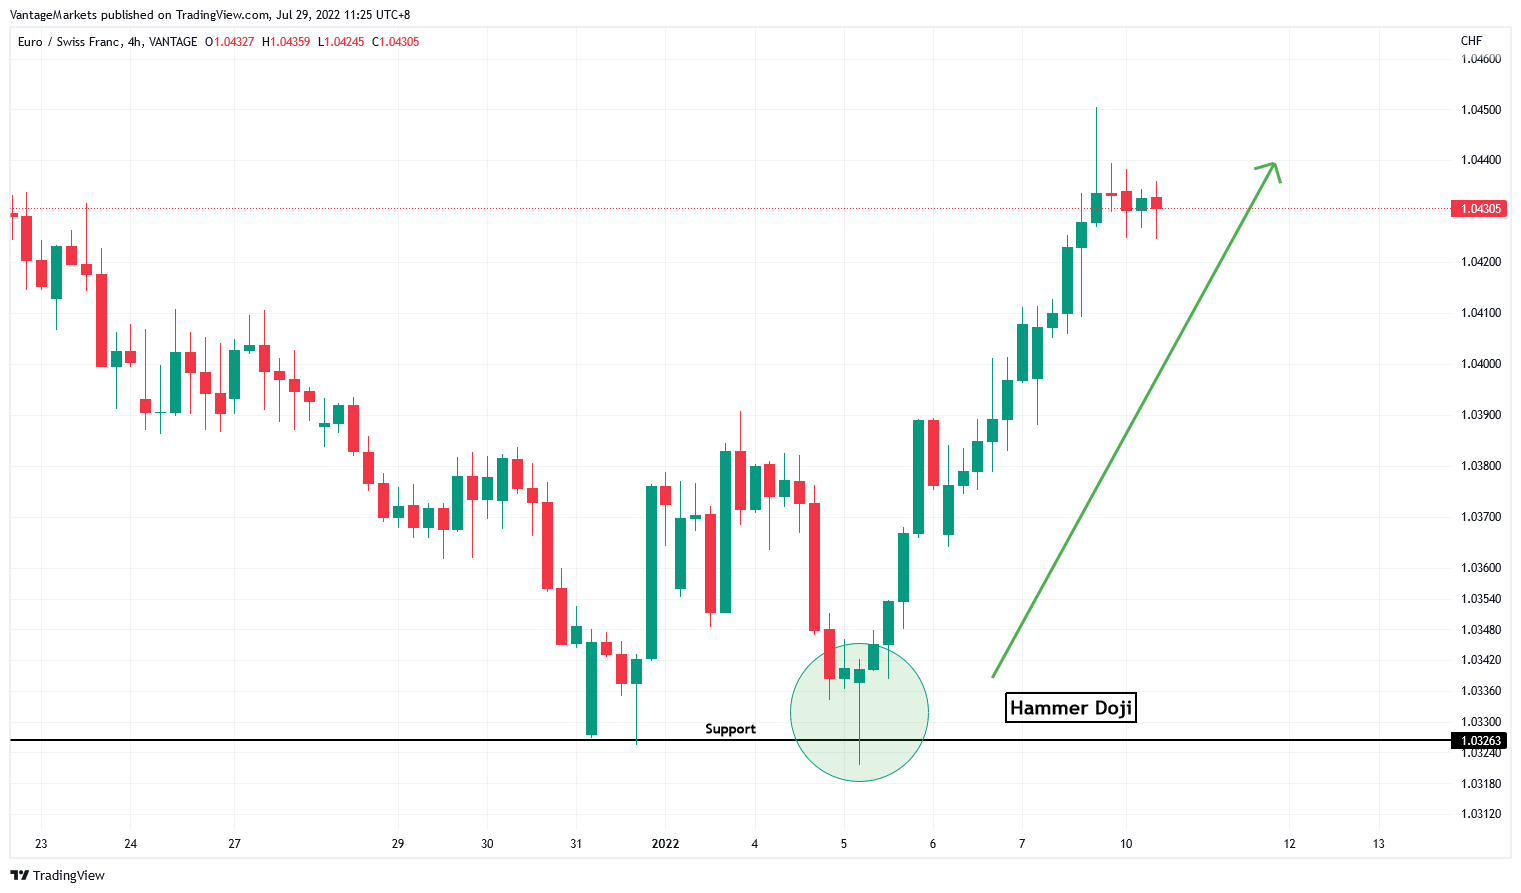
Case Study 1 – Hammer
In Figure 3, the formation of the Hammer at a support level suggests markets could turn from bearish to bullish.
Hanging Man
A Hanging Man looks identical to a Hammer — small body, long lower wick, little upper wick — but it appears after an uptrend rather than a downtrend. The long lower wick shows sellers took control during the session even though buyers dragged price back up by the close, which can be an early warning that buying pressure is running out. The shape is the same as a Hammer; only the location in the trend differs, which is why traders often confuse the two.
Inverted Hammer
An Inverted Hammer forms after a downtrend and has a small body near the bottom of its range with a long upper wick and little or no lower wick — the mirror image of a Hammer. It suggests buyers attempted to push price higher during the session; even though the close didn’t hold near the high, the attempt itself can signal fading seller control.
Shooting Star
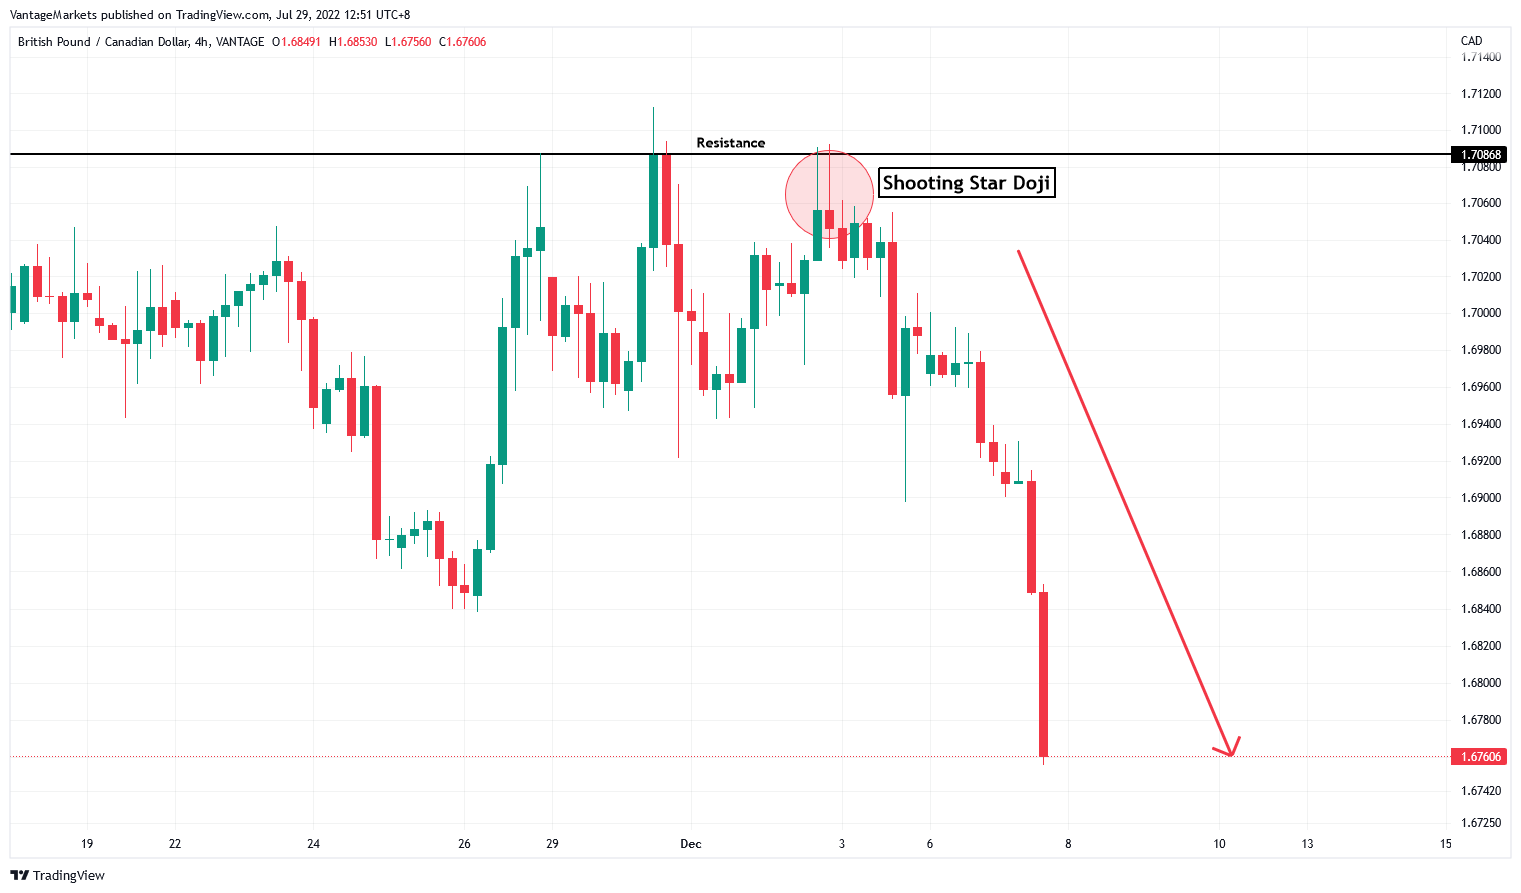
A Shooting Star has a small body near the bottom of its range, a long upper wick, and little or no lower wick. It forms after an uptrend and suggests that buyers pushed the price up during the session, but sellers took back control and dragged it down by the close — a possible sign that buying pressure is fading.
Case Study 2 – Shooting Star
Figure 4 depicts a Shooting Star forming at a critical resistance level, which can hint that markets could turn from bullish to bearish.
Doji
A Doji forms when the open and close are virtually equal, leaving little to no real body — just a thin cross or plus-sign shape. It reflects pure indecision: neither buyers nor sellers gained control during the period. A Doji after a strong trend can warn that momentum is stalling, though it needs a confirming candle in the same direction as the expected reversal before it means much on its own.
There are several recognised Doji variants:
- Gravestone Doji — long upper wick, no lower wick, open/close at the low of the range; more bearish when it appears after an uptrend
- Dragonfly Doji — long lower wick, no upper wick, open/close at the high of the range; more bullish when it appears after a downtrend
- Long-Legged Doji — long wicks on both sides, showing a wide intraday range that closed back near the open — strong indecision
Spinning Top
A Spinning Top has a small real body centred between two wicks of roughly similar length. Like a Doji, it signals indecision, but with a slightly larger body — buyers and sellers both pushed price around during the session without either side winning. A Spinning Top after an extended trend can be an early hint that the move is losing steam.
Two-Candle Reversal Patterns
Two-candle patterns carry more weight than single-candle signals because they show a shift in control from one session to the next, not just hesitation within one.
Bullish Engulfing
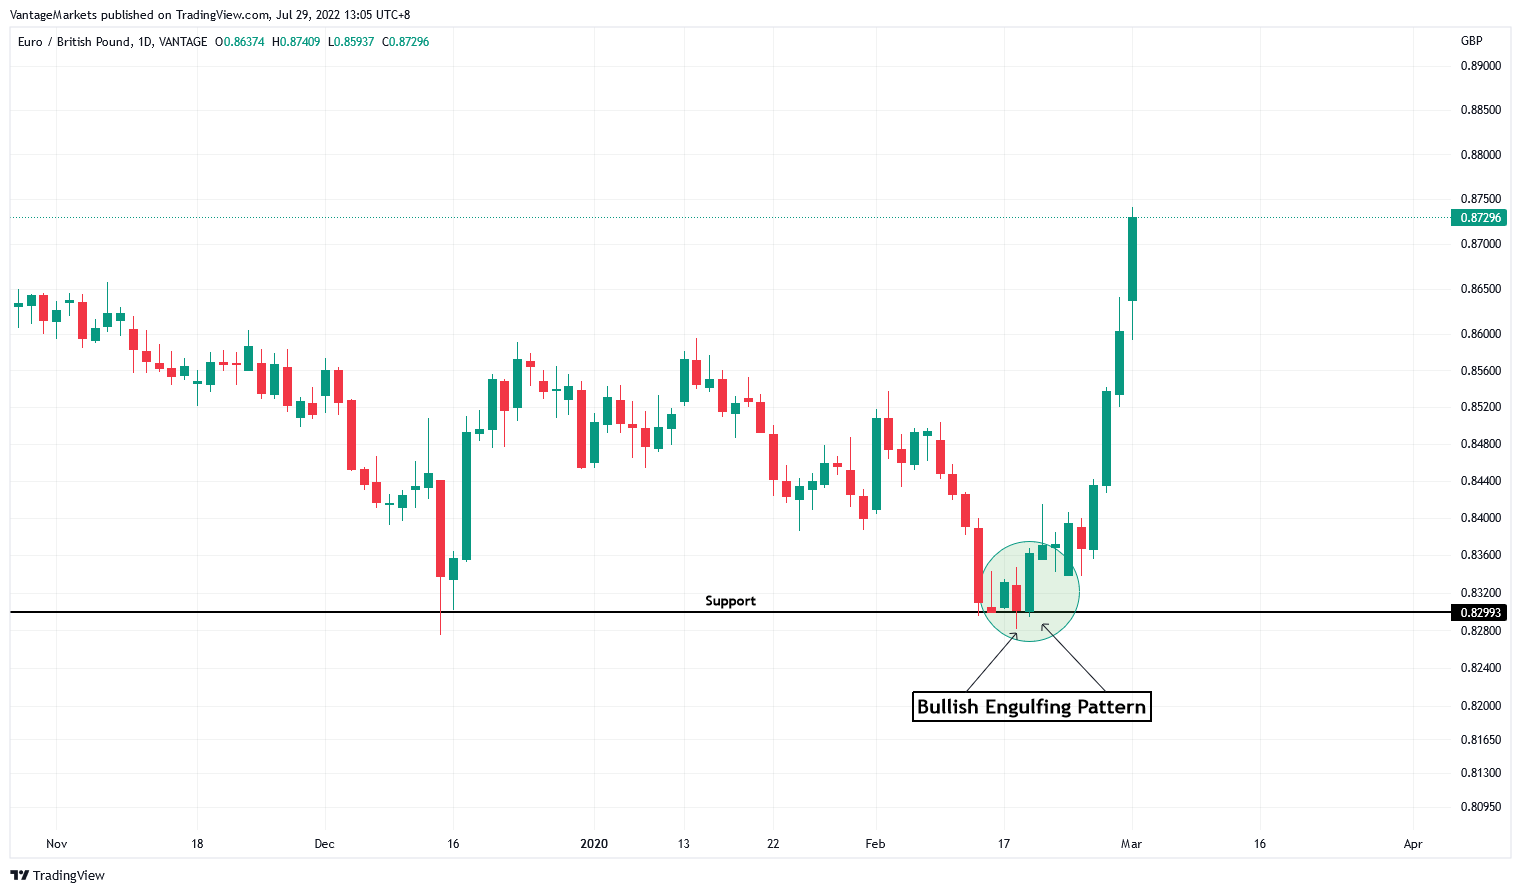
Engulfing patterns involve two candlesticks of opposite colours. The second candle’s body must be bigger than the first candle’s body — hence the term “engulfing”. A Bullish Engulfing pattern forms when a bearish candle is followed by a larger bullish candle that fully covers the first candle’s body, at the bottom of a downtrend, signalling that buyers have overwhelmed the prior selling pressure.

Case Study 3 – Bullish Engulfing
Figure 6 shows the bullish engulfing pattern in action. At a significant support level, a bullish engulfing on EURGBP preceded a shift from bearish to bullish market structure.
Bearish Engulfing
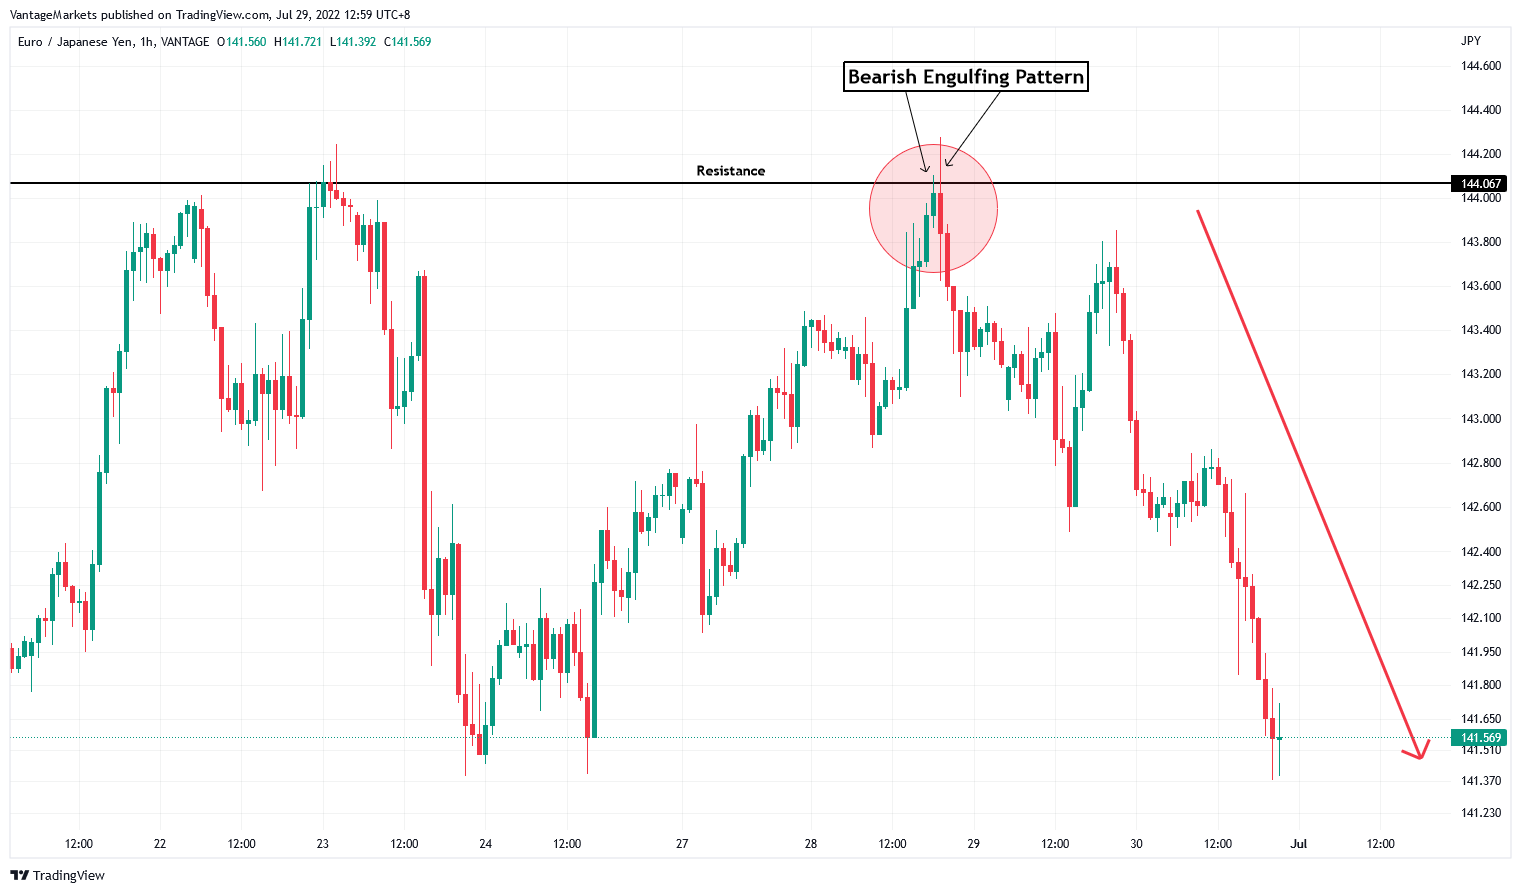
A Bearish Engulfing pattern is the mirror image: a bullish candle followed by a larger bearish candle that fully covers the first candle’s body, at the top of an uptrend, signalling that sellers have overwhelmed the prior buying pressure.
Case Study 4 – Bearish Engulfing
In Figure 7, a prominent resistance level can be seen, and at the third test of that resistance, the market prints a bearish engulfing pattern. A strong bearish push to the downside follows.
Piercing Line
A Piercing Line forms after a downtrend: a long bearish candle is followed by a bullish candle that opens below the prior candle’s low but closes more than halfway up into the first candle’s body. It’s a two-candle bullish reversal signal — a weaker cousin of Bullish Engulfing, since the second candle doesn’t fully cover the first.
Dark Cloud Cover
Dark Cloud Cover is the bearish mirror of the Piercing Line: after an uptrend, a long bullish candle is followed by a bearish candle that opens above the prior high but closes more than halfway down into the first candle’s body, suggesting the uptrend is losing control to sellers.
Harami
A Harami (“pregnant” in Japanese) forms when a large candle is followed by a much smaller candle whose entire body sits inside the first candle’s body. A Bullish Harami appears after a downtrend (large bearish candle, small bullish candle inside it); a Bearish Harami appears after an uptrend (large bullish candle, small bearish candle inside it). Either version signals that momentum has stalled and the market may be about to change direction.
Tweezer Top and Bottom
A Tweezer pattern forms when two consecutive candles reach almost the same high (Tweezer Top, bearish, after an uptrend) or almost the same low (Tweezer Bottom, bullish, after a downtrend), regardless of each candle’s colour. The matching highs or lows show that a level is being rejected twice in a row, which strengthens the case for a reversal at that price.
Three-Candle Reversal Patterns
Three-candle patterns unfold over three sessions and generally carry the strongest confirmation of the reversal groups, since they show the full handover from one side of the market to the other.
Three White Soldiers
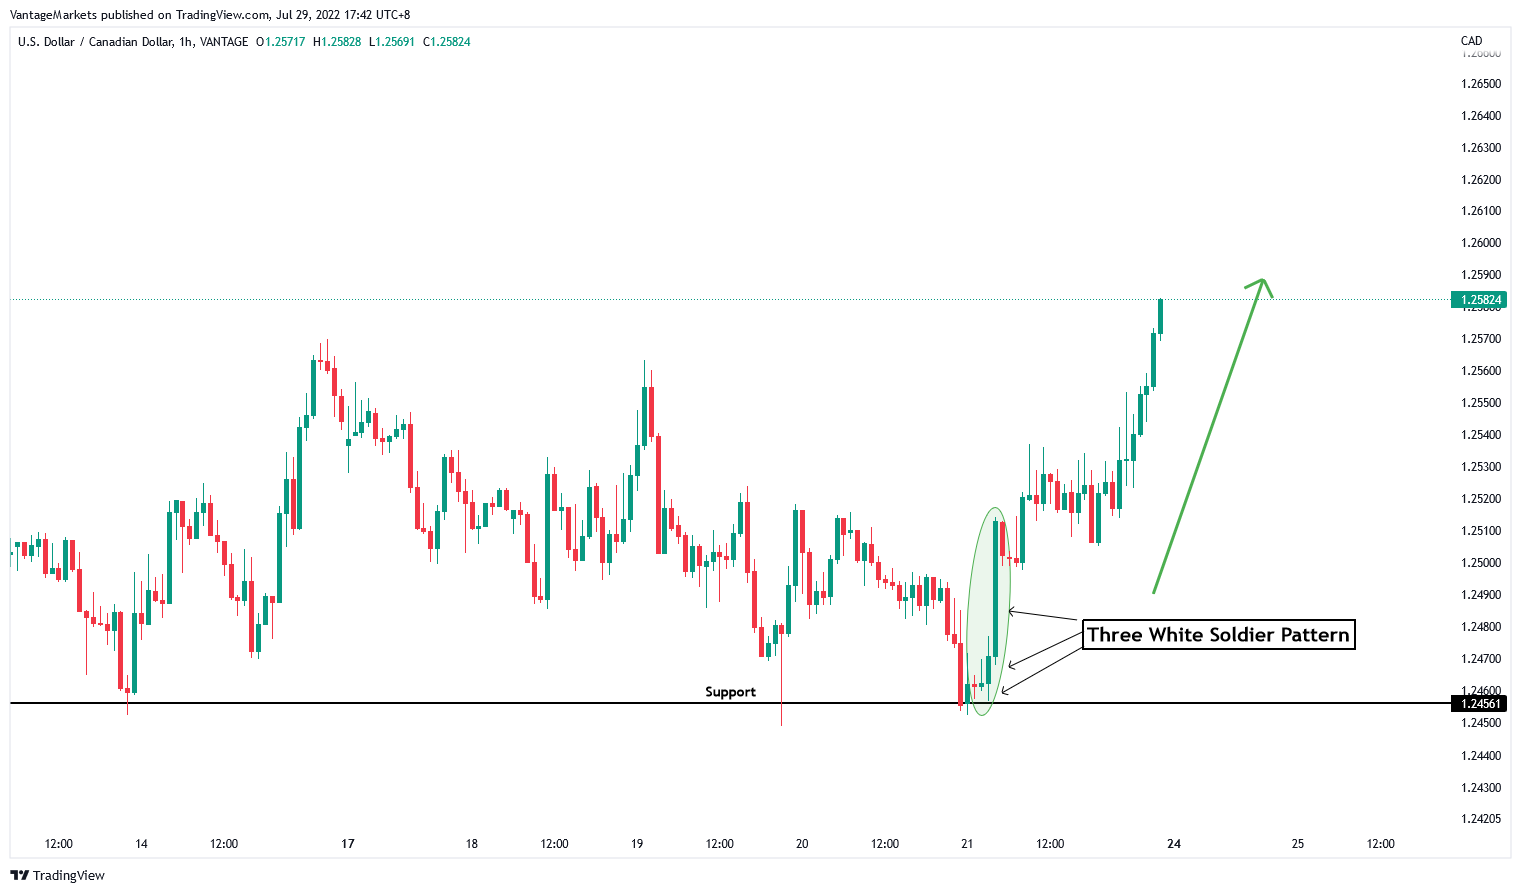
Three-candle patterns provide more confirmation than one or two-candle signals because they capture a fuller shift in control. Three White Soldiers consists of three consecutive bullish candles, each opening within the previous candle’s body and closing higher, with progressively larger bodies — a strong signal of an emerging uptrend, typically appearing after a downtrend or at support.

Case Study 5 – Three White Soldiers
Figure 9 shows the Three White Soldiers pattern forming at support. The three candles involved progressively get larger, signifying a possible emergence of a bull market.
Three Black Crows
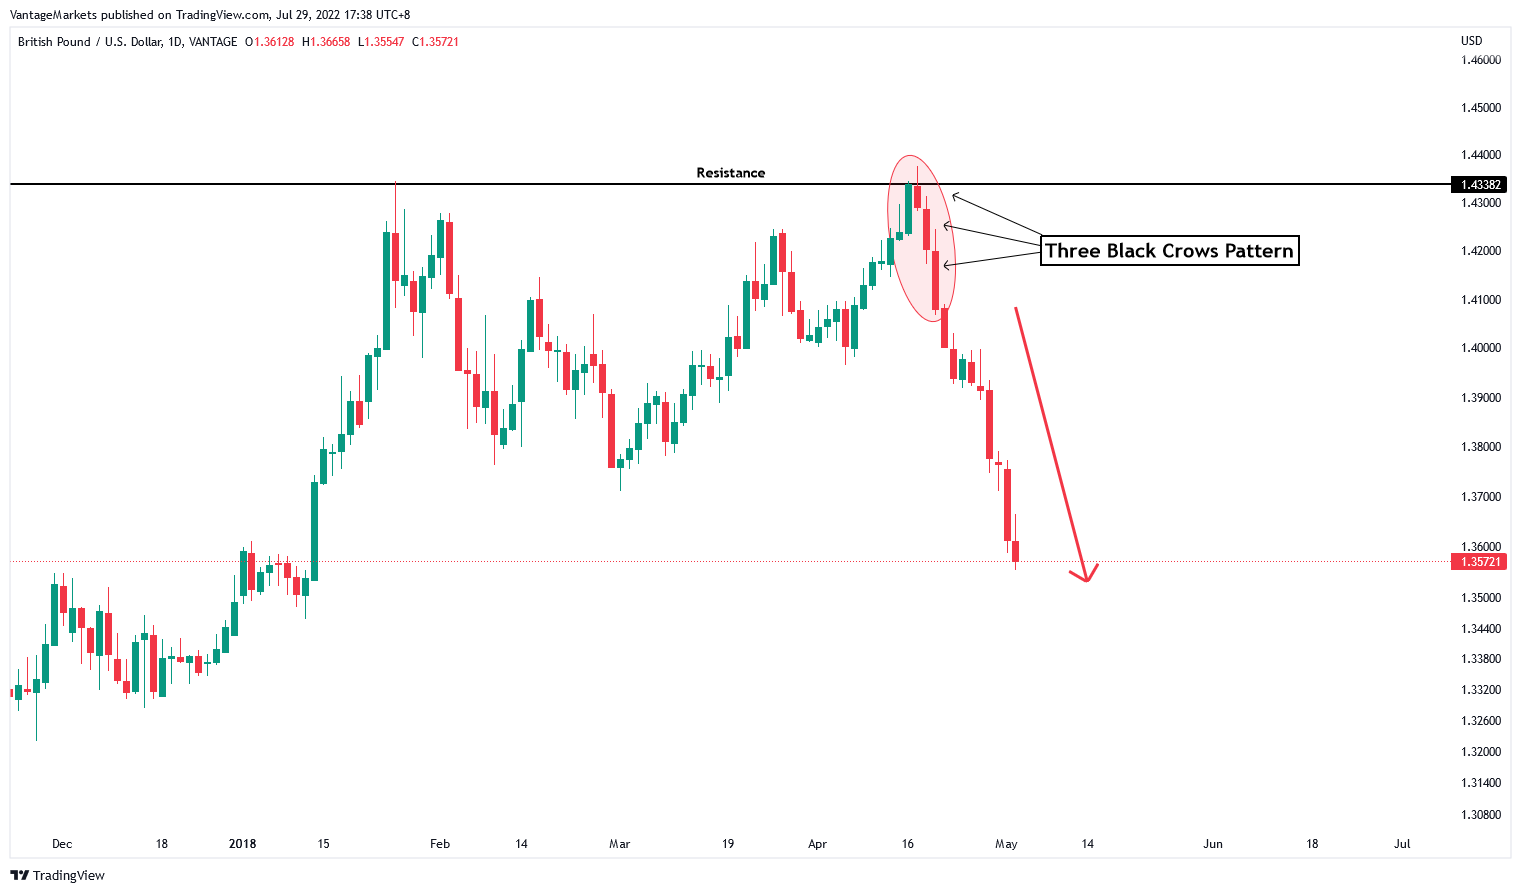
Three Black Crows is the bearish mirror: three consecutive bearish candles, each opening within the previous candle’s body and closing lower, with progressively larger bodies, typically appearing after an uptrend or at resistance.
Case Study 6 – Three Black Crows
The formation of Three Black Crows at a resistance level in Figure 10 highlights a high possibility of an incoming bearish move.
Morning Star
A Morning Star is a three-candle bullish reversal pattern that forms after a downtrend: a long bearish candle, followed by a small-bodied candle (the “star” — it can gap below the first candle and shows indecision), followed by a long bullish candle that closes well into the first candle’s body. It’s read as sellers losing control, a pause, then buyers taking over.
Evening Star
An Evening Star is the bearish mirror, forming after an uptrend: a long bullish candle, a small-bodied “star” candle, then a long bearish candle that closes well into the first candle’s body — buyers losing control, a pause, then sellers taking over.
Continuation Candlestick Patterns
Continuation patterns suggest that a pause in the market is temporary and that the existing trend is likely to resume, rather than reverse. They tend to involve more candles than reversal patterns because they need to show a trend, a pause, and then the trend reasserting itself.
Rising Three Methods
Rising Three Methods is a five-candle bullish continuation pattern: a long bullish candle, followed by three small bearish (or sideways) candles that stay within the range of the first candle, followed by a fifth long bullish candle that closes above the first candle’s high. It shows the uptrend briefly pausing for a pullback before resuming.
Falling Three Methods
Falling Three Methods is the bearish mirror: a long bearish candle, three small bullish (or sideways) candles contained within its range, then a fifth long bearish candle that closes below the first candle’s low — a downtrend pausing before it resumes.
Candlestick Patterns Cheat Sheet
Table 1 summarises all 18 patterns covered in this guide, their type, and the market direction they typically suggest. Save or bookmark this section as a quick-reference sheet.
| Pattern | Type | Candles | Characteristic | Typical Signal |
| Hammer | Reversal | 1 | Small body, long lower wick, appears in a downtrend | Bullish |
| Hanging Man | Reversal | 1 | Small body, long lower wick, appears in an uptrend | Bearish |
| Inverted Hammer | Reversal | 1 | Small body, long upper wick, appears in a downtrend | Bullish |
| Shooting Star | Reversal | 1 | Small body, long upper wick, appears in an uptrend | Bearish |
| Doji | Reversal / Indecision | 1 | Open and close virtually equal | Neutral / possible reversal |
| Spinning Top | Reversal / Indecision | 1 | Small body centred between two similar wicks | Neutral / possible reversal |
| Bullish Engulfing | Reversal | 2 | Bullish candle body fully covers prior bearish body | Bullish |
| Bearish Engulfing | Reversal | 2 | Bearish candle body fully covers prior bullish body | Bearish |
| Piercing Line | Reversal | 2 | Bullish candle closes above the midpoint of prior bearish candle | Bullish |
| Dark Cloud Cover | Reversal | 2 | Bearish candle closes below the midpoint of prior bullish candle | Bearish |
| Harami | Reversal | 2 | Small candle body sits inside the prior candle’s body | Bullish or bearish |
| Tweezer Top / Bottom | Reversal | 2 | Two candles with matching highs (top) or lows (bottom) | Bearish (top) / Bullish (bottom) |
| Three White Soldiers | Reversal | 3 | Three rising bullish candles, increasing body size | Bullish |
| Three Black Crows | Reversal | 3 | Three falling bearish candles, increasing body size | Bearish |
| Morning Star | Reversal | 3 | Bearish, small-bodied, bullish — closing into first candle’s body | Bullish |
| Evening Star | Reversal | 3 | Bullish, small-bodied, bearish — closing into first candle’s body | Bearish |
| Rising Three Methods | Continuation | 5 | Bullish candle, three small candles, bullish breakout candle | Bullish |
| Falling Three Methods | Continuation | 5 | Bearish candle, three small candles, bearish breakdown candle | Bearish |
A Brief History of Candlestick Charting
Candlestick charting is generally credited to Munehisa Homma, an 18th-century Japanese rice merchant who traded at the Dōjima Rice Exchange in Osaka — the world’s first organised futures market. Homma is said to have tracked price patterns in rice contracts and used them, alongside his observations of trader psychology, to build one of the most successful trading careers on record. His 1755 text, The Fountain of Gold — The Three Monkey Record of Money, is considered one of the earliest works on market psychology, though the visual candlestick chart format traders use today is thought to have developed later, in 19th-century Japan.
Candlestick charting remained largely unknown outside Japan until Steve Nison introduced it to Western traders in his 1991 book, Japanese Candlestick Charting Techniques. Since then, it has become one of the most widely used forms of price charting across forex, equities, commodities, and crypto markets.
How to Use Candlestick Patterns in Trading
Here’s how you can get started with candlestick trading:
Choosing a Trading Platform
When selecting a trading platform, prioritise those known for reliability and robust charting capabilities. Choose a platform that provides real-time market data, which is crucial for accurate chart analysis, with a user-friendly interface that’s easy to navigate — particularly if you’re new to trading. It’s worth comparing how to choose a forex broker more broadly, and looking for a platform that includes a demo account so you can practise reading patterns without financial risk.
Setting Up a Candlestick Chart
To set up a candlestick chart, start by accessing the charting section on your trading platform — see our guide on how to read MT5 forex charts for a platform-specific walkthrough. Select the financial asset you wish to trade, such as forex, indices, or commodities, and customise the time interval of the candlesticks to align with your trading strategy — choosing from options like 1-minute, 30-minute, or daily intervals depending on whether you trade short-term or hold positions for longer.
Identifying and Confirming Trading Opportunities
To effectively identify trading opportunities using candlestick charts, start by learning to recognise the patterns above and observe how they line up with existing support, resistance, and trend context — a pattern that appears mid-range with no nearby level carries far less weight than one forming exactly where the chart already suggests buyers or sellers are active.
A single candlestick pattern is rarely enough on its own. Most traders wait for confirmation — the next candle closing beyond the pattern’s high or low in the expected direction — before acting, and combine the pattern with the indicators covered in the next section. Sharpen your skills by practising with a demo account, and review historical chart data to see how similar patterns have played out in the past. Once you’ve identified an opportunity, set your risk management strategy alongside it, including stop-loss and take-profit levels — our guide to forex risk management covers this in more depth. Keeping a level head while doing so matters too; see our article on managing your emotions when trading if you find pattern-spotting tempts you into overtrading.
Combining Candlesticks with Other Indicators
While candlestick patterns are useful on their own, combining them with other technical indicators can provide more reliable signals. Indicators such as moving averages, the Relative Strength Index (RSI), and Bollinger Bands help confirm the signals provided by candlesticks, giving traders a clearer picture of market conditions.
For example, when a Bullish Engulfing pattern lines up with a moving average crossover, it can offer stronger confirmation of a possible uptrend. Similarly, the RSI shows whether an asset is overbought or oversold, and when read alongside a candlestick pattern, it helps traders more easily spot potential reversals. Bollinger Bands, which measure market volatility, combined with candlestick analysis, can highlight potential breakouts or trend shifts. Some traders also use forex trading signals as a further layer of confirmation alongside price action.
By using multiple indicators together, traders can better read market context and fine-tune their entry and exit points, rather than relying on a single candlestick pattern in isolation.
Vantage Tools for Spotting Candlestick Patterns
Beyond manually scanning charts, some platforms include built-in tools that flag candlestick patterns automatically. Vantage’s Adaptive Candlesticks indicator scans a chart for a defined set of trusted candlestick patterns, combining technical and quantitative analysis to help traders spot formations in context.
Adaptive Candlesticks
Candlestick patterns that illustrate important changes in supply and demand, the Adaptive Candlesticks scans for 16 trusted candlestick patterns on any chart. A combination of unique technical and quantitative analysis helps the trader to make decisions based on current context.

Technical Insights
The Technical Insights function offered by Vantage Protrader Tools separately highlights key price action patterns across major and minor forex pairs and commodities.

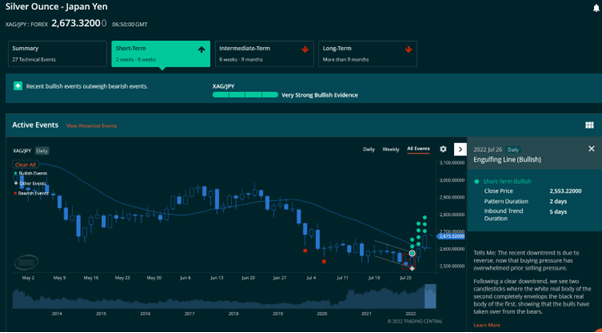
These tools can help surface patterns faster, but they work from the same principles covered in this guide — they don’t replace the need to understand what a pattern means, where it’s forming, or whether it’s been confirmed.
Want to have access to advanced candlestick patterns at your fingertips? Sign up for Vantage Live Account!
Limitations and Common Mistakes
Candlestick patterns describe what has already happened in the market, not what will happen next — they are a probability tool, not a guarantee. A handful of things are worth keeping in mind before trading off any of the patterns above:
- Patterns fail. No candlestick pattern works every time, and a pattern that forms without a clear trend or level behind it is far less reliable than one that does.
- Context matters more than shape. The same candle shape means different things depending on where it forms — a Hammer at support and the identical shape mid-range are not the same signal.
- Confirmation reduces (but doesn’t remove) false signals. Waiting for the next candle to close in the expected direction filters out some, though not all, false breaks.
- Timeframe changes reliability. Patterns on higher timeframes (daily, weekly) are generally considered more significant than the same pattern on a 1-minute or 5-minute chart, simply because more participants and more volume are behind the move.
- Combine, don’t rely on one signal. Pattern + trend + support/resistance + a confirming indicator is a stronger basis for a decision than any one of those alone.
Frequently Asked Questions
What is the most reliable candlestick pattern?
No single pattern is reliable in every market condition. Multi-candle patterns that form at a clear support or resistance level and are backed by a confirming candle — such as Bullish/Bearish Engulfing or Morning/Evening Star — are generally considered to carry more weight than single-candle patterns like a Doji or Spinning Top on their own.
What is the difference between a Hammer and a Hanging Man?
They look identical — a small body with a long lower wick — but the difference is entirely down to context. A Hammer forms after a downtrend and can suggest a bullish reversal; a Hanging Man forms after an uptrend and can suggest a bearish one.
How do I confirm a candlestick pattern before trading?
Most traders wait for the candle immediately after the pattern to close beyond the pattern’s high (for a bullish setup) or low (for a bearish setup) in the expected direction, and check that the pattern formed at a relevant support or resistance level, rather than acting on the pattern the moment it appears.
Can candlestick patterns be used for crypto and forex?
Yes. Candlestick patterns are chart-based and apply to any market that produces OHLC price data, including forex pairs like USD/JPY, commodities, indices, and crypto. The same shapes and rules apply; only the underlying volatility and typical trading hours differ.
What time frame is best for candlestick patterns?
There’s no single best time frame — it depends on your trading style. Patterns on daily or 4-hour charts tend to carry more weight for swing trading, while shorter time frames (5-minute, 15-minute) suit day trading but produce more frequent, lower-confidence signals. See our overview of simple forex trading strategies for how time frame choice fits into a broader approach.
Candlestick analysis gives traders a visual way to read market sentiment through the open, high, low, and close of each period, and — as this guide has covered — a wider vocabulary of patterns to recognise reversals and continuations as they form. Understanding the anatomy and the 18 patterns above is a strong foundation, but as the limitations section explains, no pattern should be read in isolation from trend, support and resistance, and confirmation.
If you’re ready to put candlestick analysis into practice, you can explore it further through our beginner’s guide to forex trading or open a live account to practise on a demo first.
RISK WARNING: CFDs and Spread Bets are complex instruments and come with a high risk of losing money rapidly due to leverage. 72.65% of retail investor accounts lose money when trading CFDs and Spread Bets with this provider. You should consider whether you understand how CFDs and Spread Bets work and whether you can afford to take the high risk of losing your money.
Disclaimer: The information is provided for educational purposes only and doesn’t take into account your personal objectives, financial circumstances, or needs. It does not constitute investment advice. We encourage you to seek independent advice if necessary. The information has not been prepared in accordance with legal requirements designed to promote the independence of investment research. No representation or warranty is given as to the accuracy or completeness of any information contained within. This material may contain historical or past performance figures and should not be relied on. Furthermore, estimates, forward-looking statements, and forecasts cannot be guaranteed. The information on this site and the products and services offered are not intended for distribution to any person in any country or jurisdiction where such distribution or use would be contrary to local law or regulation.
Key Points In This Article

Latest Academy Articles


Market News Tags
- # Asian Markets News Today
- # Crude Oil News Today
- # Earnings News Today
- # Economic News Today
- # Featured News
- # Federal Reserve News
- # Commodity Market News
- # Interest Rate News
- # Financial News
- # Forex News Today
- # Gold News Today
- # Market News Today
Related Articles
- Spread Betting vs. CFDs: What’s The Difference?
- Beginner’s Guide to Indices Trading (Updated 2026)
- Forex CFDs: Overview, How it Works, and How to Trade
- How to Paper Trade on TradingView: A Step-by-Step Guide
- Trading Psychology for Beginners
- What Does Bullish and Bearish Mean? Definitions, Technical Indicators, and Market Examples
- What Is Liquidity? Definition, Types & How It’s Measured
- XAU/USD Risk Management: Lot Size, Margin And Leverage