Technical Indicators
For a technical analyst, indicators are tools that may offer traders another perspective of the markets. These technical indicators act as an interpreter of the markets and traders can use such information to their advantage.
In general, technical indicators are derived from mathematical equations of price action – this means it is driven purely by data. Indicators are useful in many ways such as identifying the market condition and finding areas to enter or exit a trade.
Key Points
- Technical indicators, classified into trending, oscillating, and volume types, provide mathematical analysis of market trends and signals for entering or exiting trades.
- Custom technical indicators, developed independently, can enhance trading strategies with unique mathematical computations and are often combined with other indicators for improved analysis.
- Effective use of technical indicators requires understanding their limitations, avoiding ‘analysis paralysis’ from too many indicators, and incorporating other technical analysis methods like price action.
Types of Technical Indicators
Indicators come in many different shapes and sizes, but still fall under 3 main categories: Trending, Oscillating, and Volume indicators.
1. Trend Indicators
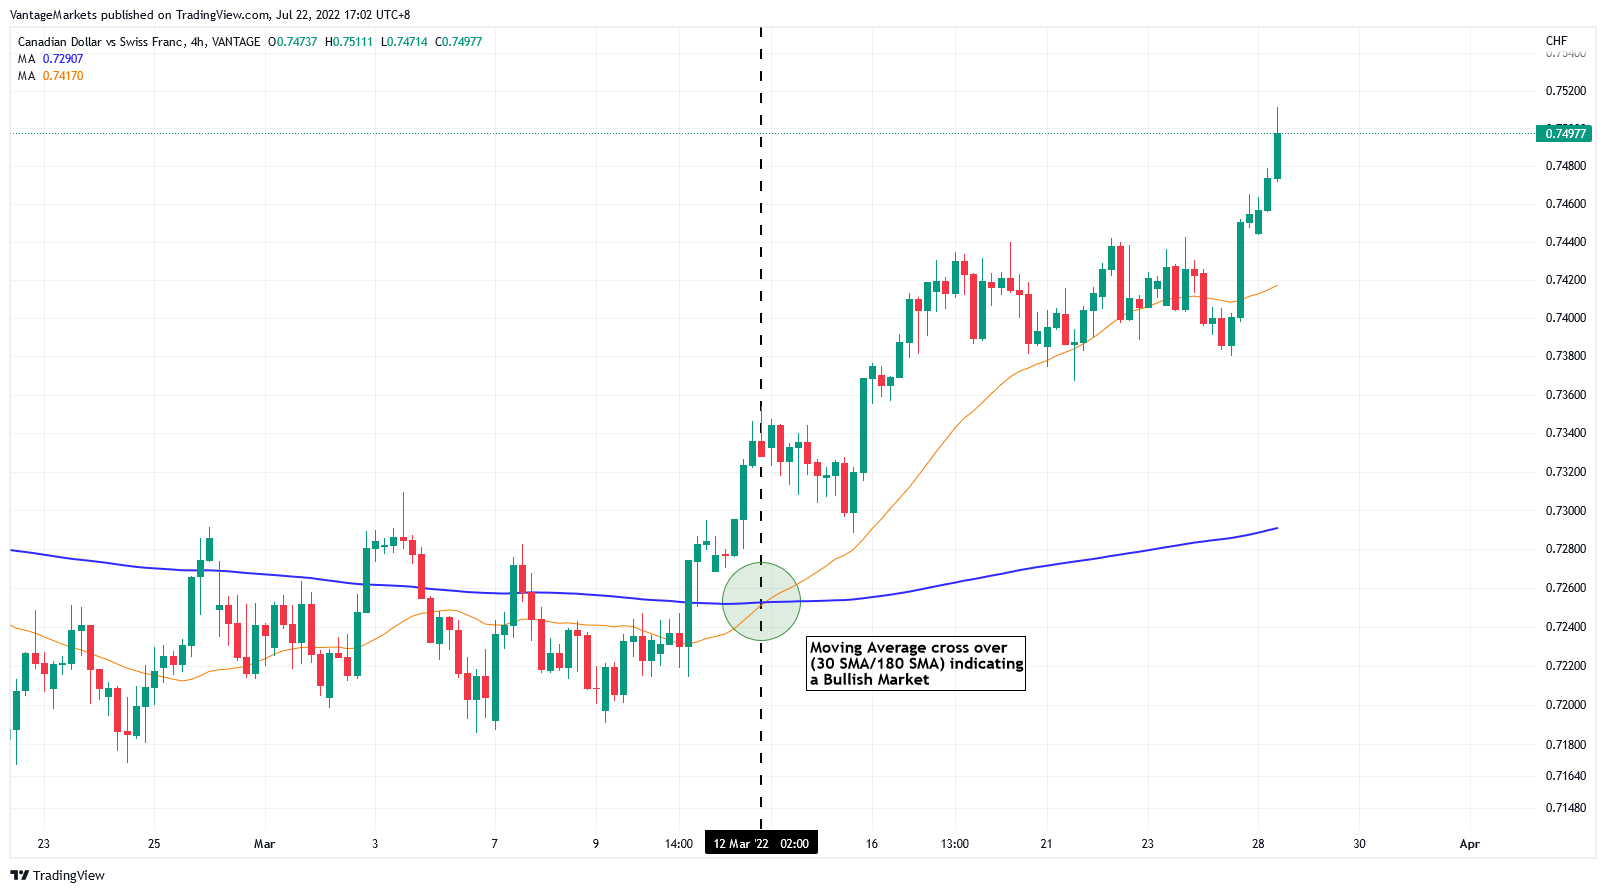
As the name suggests, trend indicators assist traders to identify the trend in the market. It is usually calculated from the averages of past price action, forming a smooth line. As the saying goes “the trend is your friend”, traders looking to trade trending markets should have a trend indicator in their arsenal [1].
- Popular Trend Indicator = Moving Average
A moving average is a commonly used technical analysis tool that calculates the average fluctuations of the price of an instrument by overlaying a smooth line over the chart.
2. Oscillator Indicators
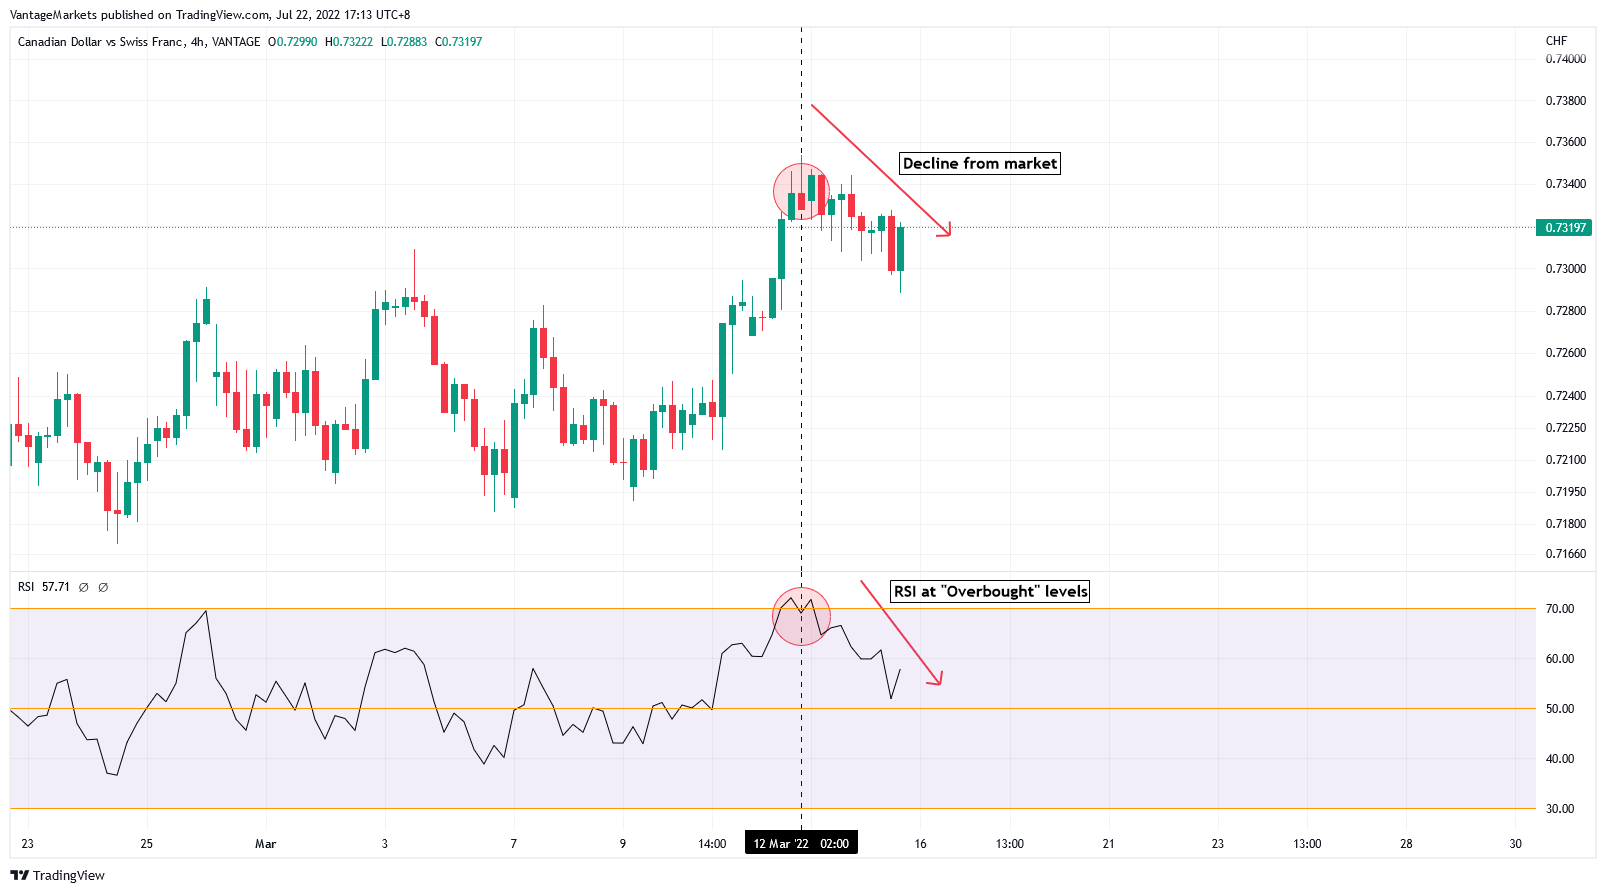
An indicator that assists traders in determining the strength of a trend, oscillator indicators move in tandem with the market’s highs and lows. The basic idea of an oscillator is the ability to determine “overbought” and “oversold” conditions in the market [2].
- Popular Oscillator Indicator = Relative Strength Index
The Relative Strength Index (RSI) is a momentum oscillator that measures the speed and change of price movements through a range of 30 (oversold) and 70 (overbought).
3. Volume Indicators
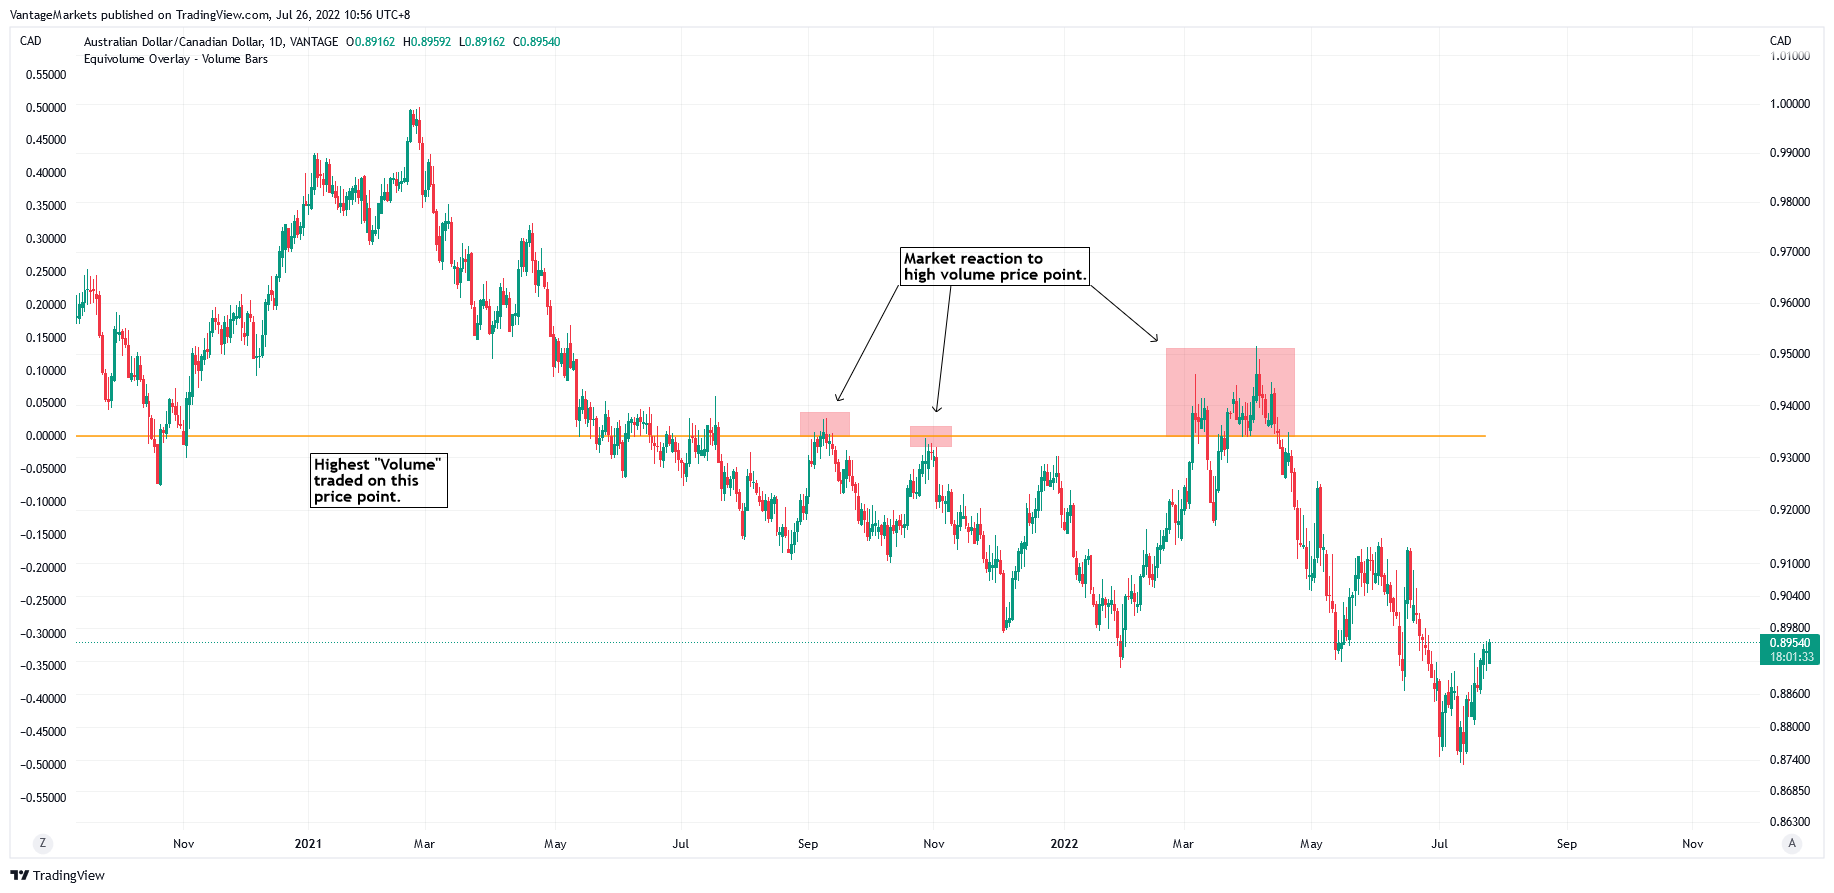
The measure of volume can also be translated into the number of market participants at a given time frame. This information can be valuable for traders who focus on volume. However, this concept only applies to stock trading. In the field of foreign exchange, volume is measured through the number of price changes during one bar, and it is believed that it also measures investor activity [3].
- Popular Volume Indicator = Volume Profile
A horizontal line showcasing the volume traded at a specific price over a specific period, the volume profile indicator has been gaining popularity in recent times.
Custom Technical Indicators
Apart from the well-known indicators, there are custom indicators which are programmed independently. These custom indicators follow unique mathematical calculations to forecast future price changes. Here are a few benchmarks to follow when creating a custom indicator:
- Determine the type of indicator
- Determine the components needed
- Determine the set of rules for the indicator to follow
- Back test and forward test the indicator
Best Custom Indicator to Consider
1. Analyst Views – Analyst Views is a custom indicator based on award-winning technical analysis methodology for market direction and key levels. Traders can leave the analysis to a team of experts who provides target levels, pivot points, and alternative targets.

2. Adaptive Candlesticks – Candlestick patterns that illustrate important changes in supply and demand, the Adaptive Candlesticks scans for 16 trusted candlestick patterns on any chart. A combination of unique technical and quantitative analysis help traders to make decision based on current context.

3. Adaptive Divergence Convergence (ADC) – For short term trading, the ADC serves as a replacement for the MACD. Offering timely signals and avoiding consolidations, this indicator allows traders to gain access to entries & exit signals, slow & fast price indicators, raw & smooth signal lines, and slow & fast oscillators.

Want to back test the markets with these custom indicators? Get them for free when you sign up for a Live Vantage Markets trading account and top up a minimum of $200. Terms & conditions apply.
Best Technical Indicator Combinations
Indicators work best when effectively used with other indicators. In the previous segment, it showcased the importance and variety of indicators available. This segment will go through some of the classic indicator combinations that have lasted the test of time. Generally, traders combine a trend indicator with an Oscillator to formulate an indicator-based trading strategy [4].
The examples below are used for educational purposes only. Past performance is not an indication of future results and any reliance on such is at your own risk.
1. Stochastic (Oscillator) + Moving Average (Trend)
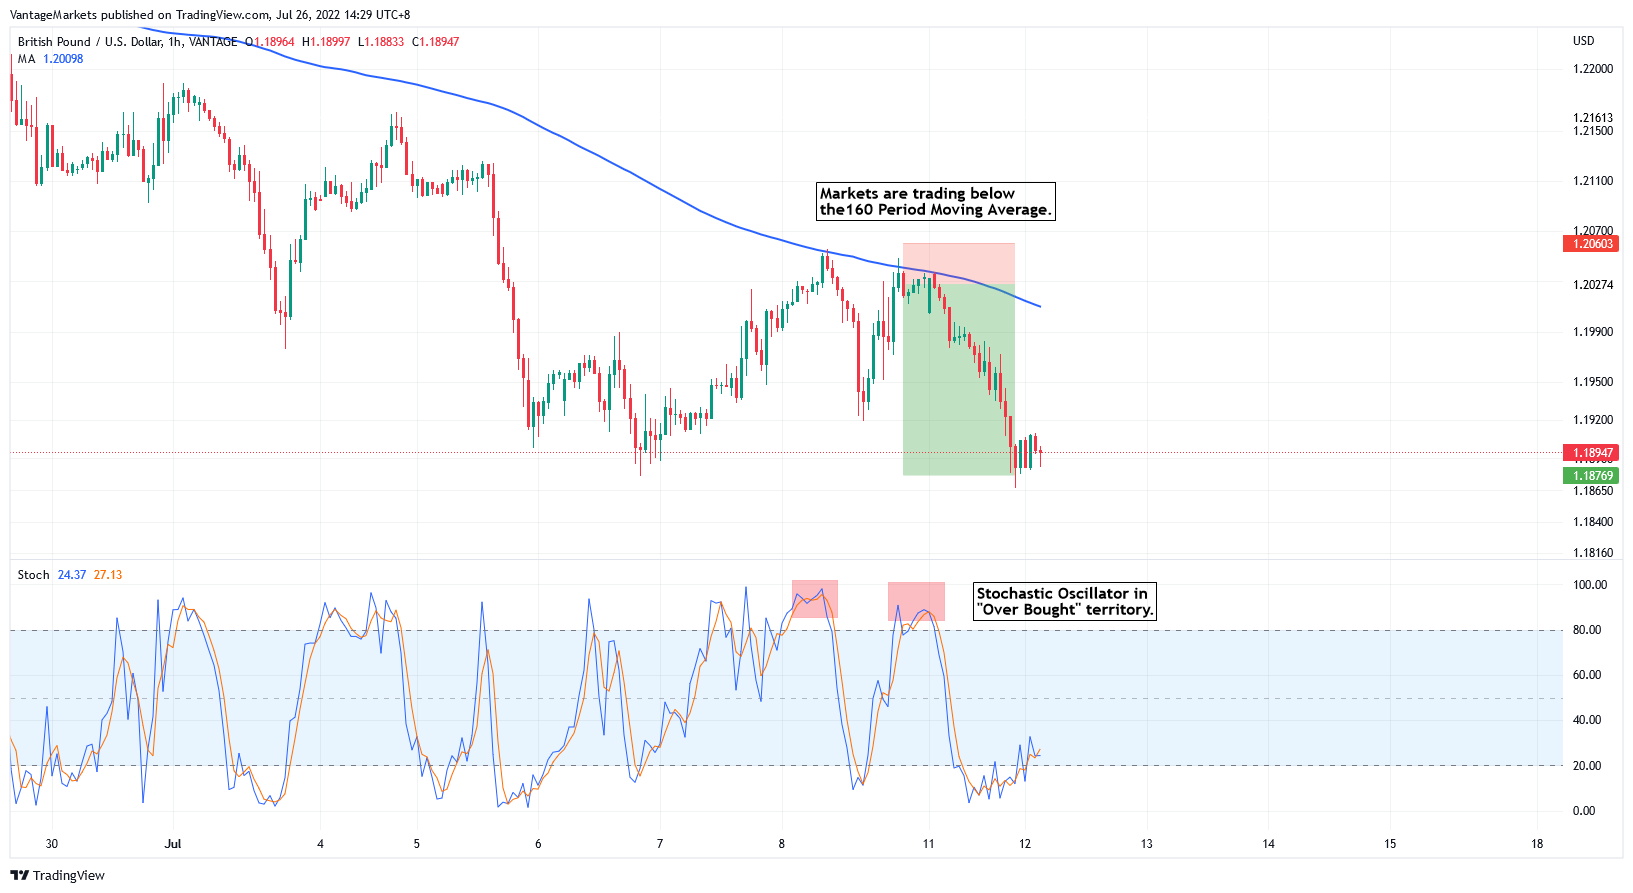
By using an oscillator and trend indicator, the information produced allows traders to make more decisive and confident trades. In figure 7, GBPUSD can be seen trading below the 160-period moving average indicating a bearish market while the stochastic oscillator point towards GBPUSD trading in an “Over Bought” market condition, also signaling a sell.
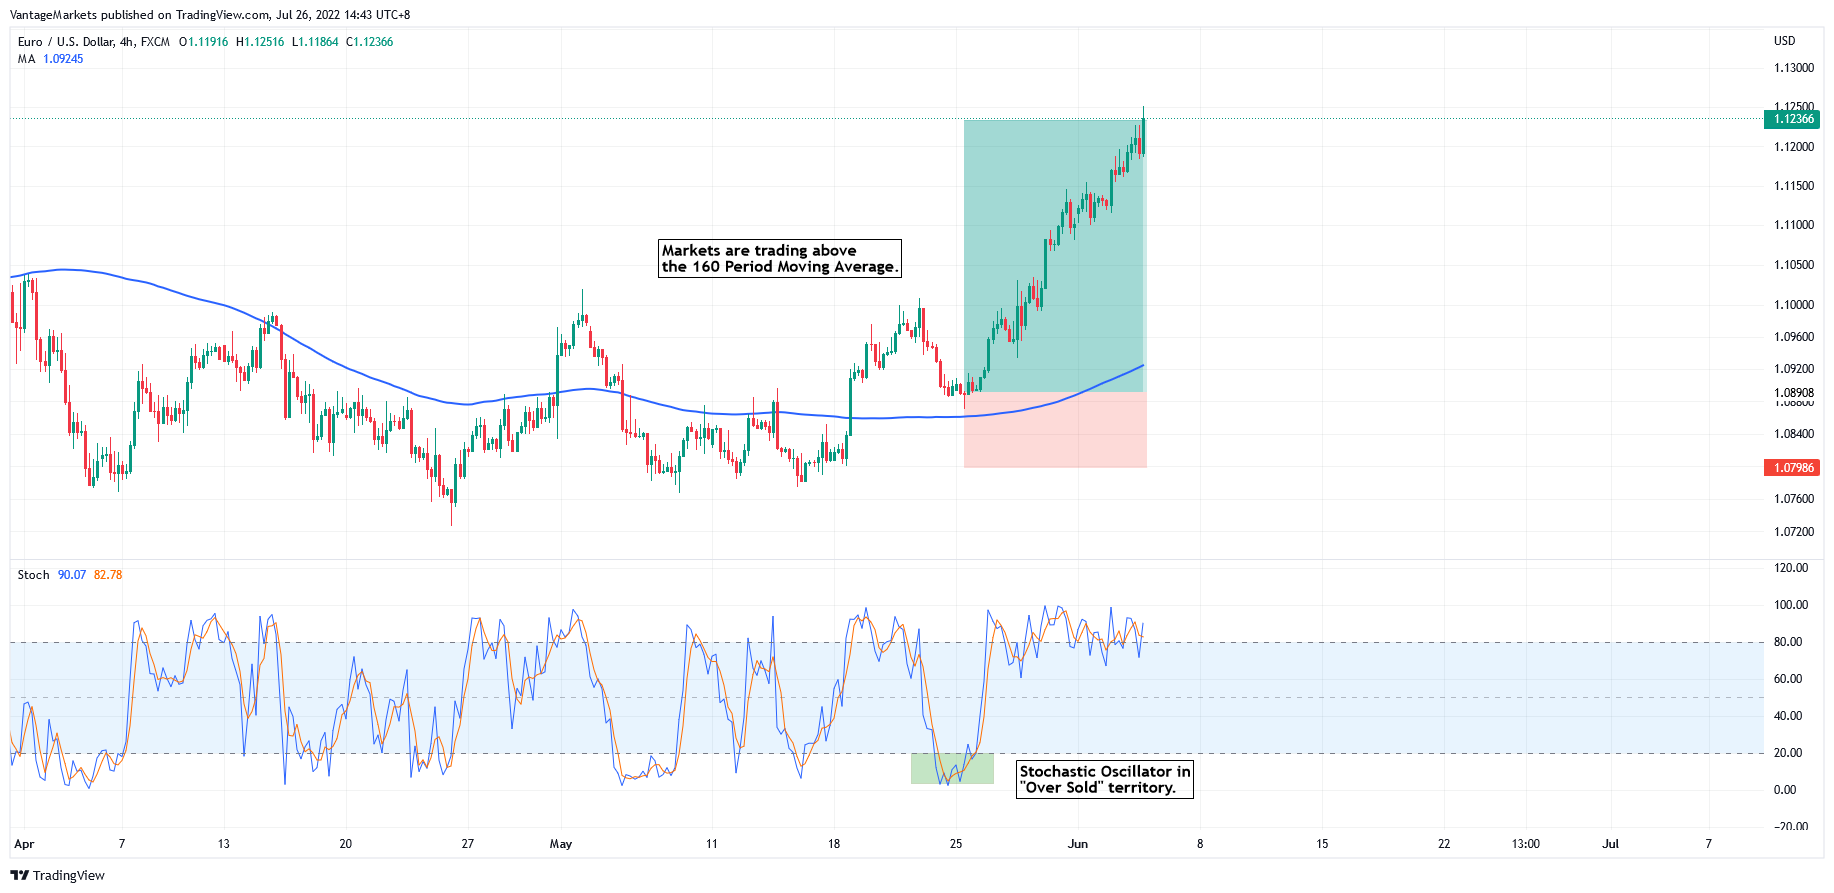
Figure 8 highlights the moving average and stochastic buy side example. With markets trading above the moving average and stochastic in “Over Sold” territory, both pointing towards a bullish market.
2. MACD (Oscillator) + Bollinger Bands (Trend)
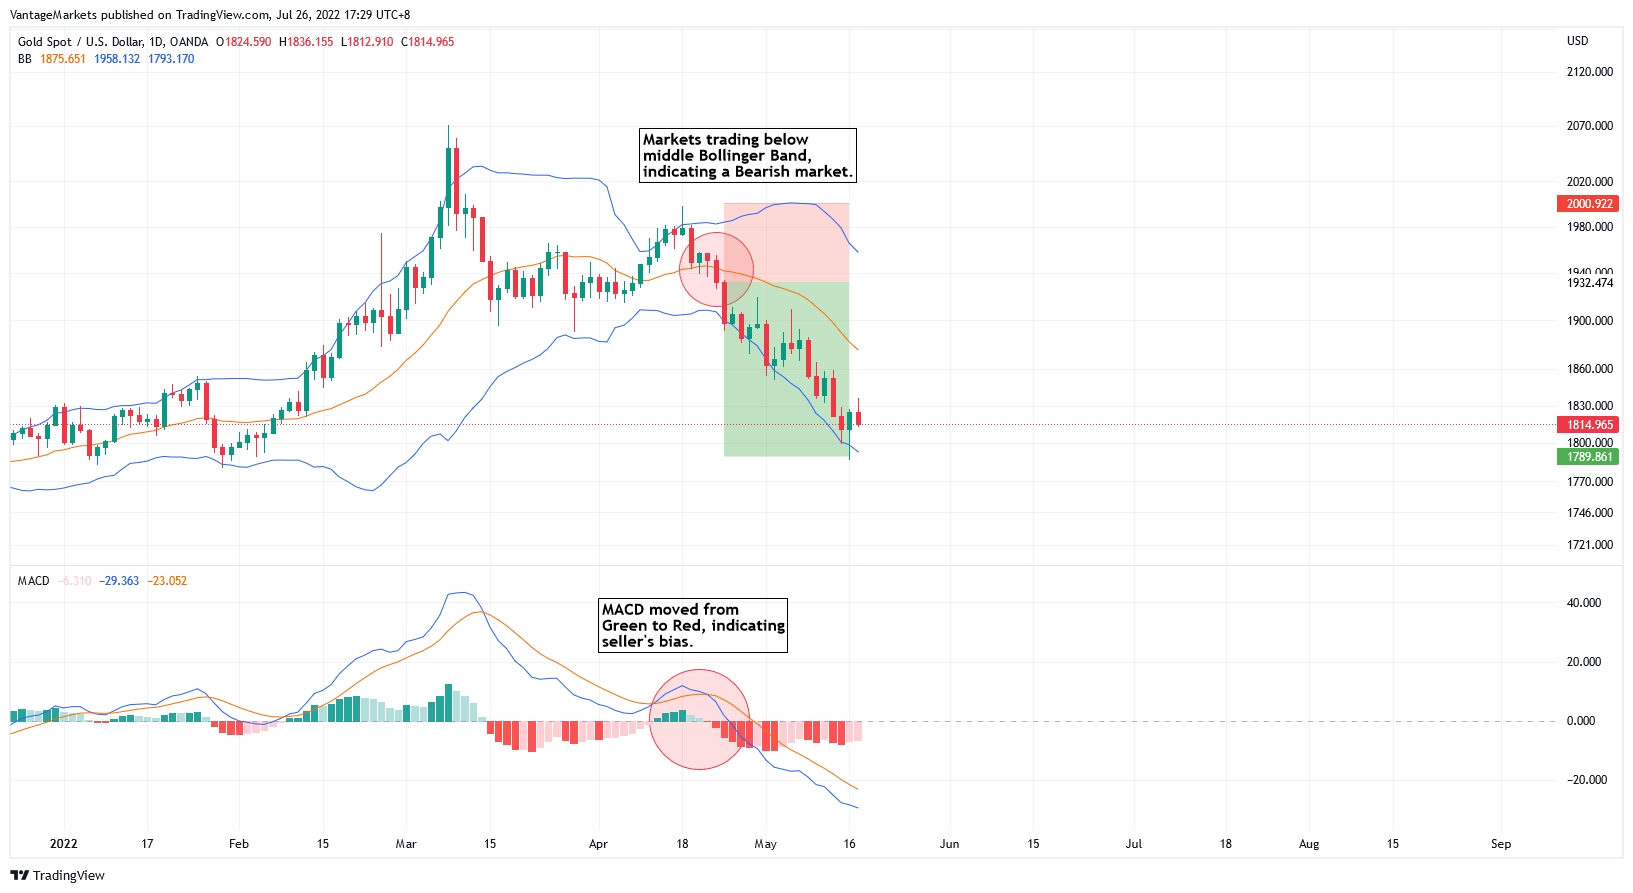
Figure 9 depicts gold markets on the daily chart with both indicators pointing towards a bearish market. MACD flipped from green to red which signals a sell while markets trading below the middle Bollinger Bands point towards a possible bearish market starting.
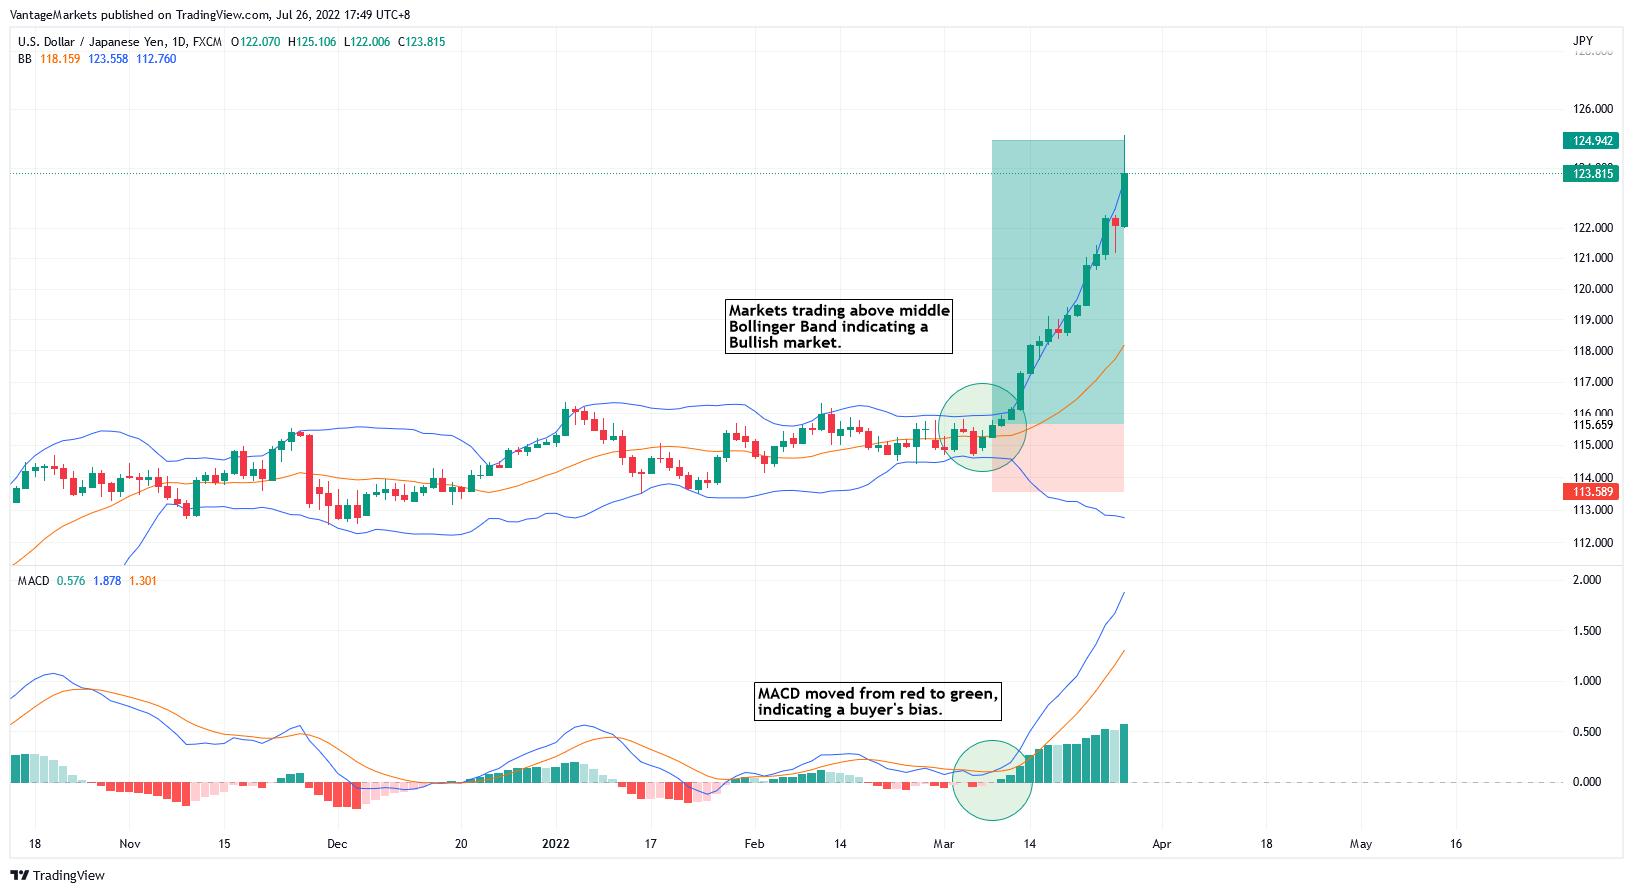
Figure 10 shows USDJPY markets going bullish, which is hinted by markets trading above the middle Bollinger Band and MACD flipping from red to green.
Reliability of Indicators
Although it could seem like indicators are the holy grail of trading, you shall not be mistaken. A common mistake traders using indicators would make is applying too many indicators on the chart. This often leads to “analysis paralysis”. Too much information is not necessarily a good thing so remember to keep your trading strategy focused.
Understanding that no indicator is perfect will help with the over reliance on them. Many traders base almost all trading decisions on these indicators. Remember that there are other forms of technical analysis such as price action that can yield the same efficiency as indicators.
Want to find out which combination of indicators work the best? Try practicing it through your own Forex Demo Account.
CFDs and Spreadbets are complex instruments and come with a high risk of losing money rapidly due to leverage. 70.5% of retail investor accounts lose money when trading CFDs and Spreadbets with this provider. You should consider whether you understand how CFDs and Spreadbets work and whether you can afford to take the high risk of losing your money.
The information has been prepared by Vantage UK as of 2nd January 2025 and is subject to change thereafter. The information is provided for educational purposes only and doesn’t take into account your personal objectives, financial circumstances, or needs. It does not constitute investment advice. We encourage you to seek independent advice if necessary. The information has not been prepared in accordance with legal requirements designed to promote the independence of investment research. No representation or warranty is given as to the accuracy or completeness of any information contained within. This material may contain historical or past performance figures and should not be relied on. Furthermore estimates, forward-looking statements, and forecasts cannot be guaranteed. The information on this site and the products and services offered are not intended for distribution to any person in any country or jurisdiction where such distribution or use would be contrary to local law or regulation.
Vantage is a trading name of Vantage Global Prime LLP which is authorised and regulated by the Financial Conduct Authority. FRN: 590299
References
- “Moving Average (MA): Purpose, Uses, Formula, and Examples – Investopedia”. https://www.investopedia.com/terms/m/movingaverage.asp. Accessed 21 Sept 2022.
- “Indicators for Overbought and Oversold Stocks – Investopedia”. https://www.investopedia.com/ask/answers/121214/what-are-best-indicators-identify-overbought-and-oversold-stocks.asp. Accessed 21 Sept 2022.
- “What are Volume Indicators (& How to Use Them) – BlueberryMarkets”. https://blueberrymarkets.com/learn/intermediate/volume-indicators/. Accessed 21 Sept 2022.
- “6 Killer Combinations for Trading Strategies – FX Leaders”. https://www.fxleaders.com/learn-forex/course/ch9-6-killer-combinations-for-trading-strategies/. Accessed 21 Sept 2022.
The information has been prepared as of the date published and is subject to change thereafter. The information is provided for educational purposes only and doesn't take into account your personal objectives, financial circumstances, or needs. It does not constitute investment advice. We encourage you to seek independent advice if necessary. The information has not been prepared in accordance with legal requirements designed to promote the independence of investment research. No representation or warranty is given as to the accuracy or completeness of any information contained within. This material may contain historical or past performance figures and should not be relied on. Furthermore estimates, forward-looking statements, and forecasts cannot be guaranteed. The information on this site and the products and services offered are not intended for distribution to any person in any country or jurisdiction where such distribution or use would be contrary to local law or regulation.