MetaTrader is the world’s preferred trading platform, with a 78.5% market share in 2020. Designed by MetaQuotes, MetaTrader 4 and MetaTrader 5 are multi-asset trading platforms on which you can view charts online, check live prices, and place orders directly from the charts. Both MT4 and MT5 are free to use and come packed with features that make it easy to access and analyse forex charts. To read MT5 forex charts correctly, let’s start with the basics.
MT5 Chart Basics
On MetaTrader 5, you can customise its appearance, apply or remove various objects from the chart, and open up to 100 charts at the same time. Here are some basic features of the MT5 interface.
Viewing the Charts
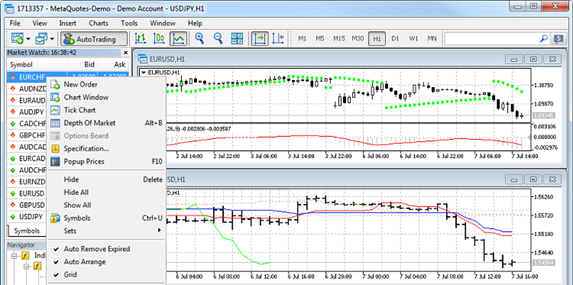
- To open a chart, simply go to the Market Watch section on the top left of the interface, select your preferred currency pair and drag and drop it in the chart area.
- You can choose the format of the chart, selecting from line chart, bar chart, and candlestick chart. This can be done using the chart shaped icons on the toolbar at the top.
- There are buttons on the toolbar to zoom in and zoom out of the chart.
- You can switch timeframes using the toolbar. While M1 to M30 refer to minutes (1 minute to 30 minutes), the Hs refer to hours, and D stands for day, W for week and MN for month.
Customising the Interface
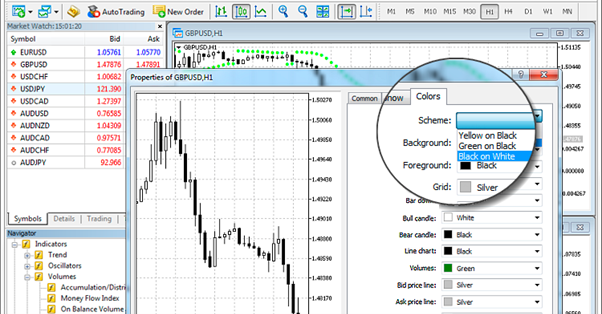
You may customise your forex chart on MetaTrader 5 by choosing from three colour schemes: yellow on black, green on black, or black on white. It’s also possible to set up colours for each individual element on the screen.
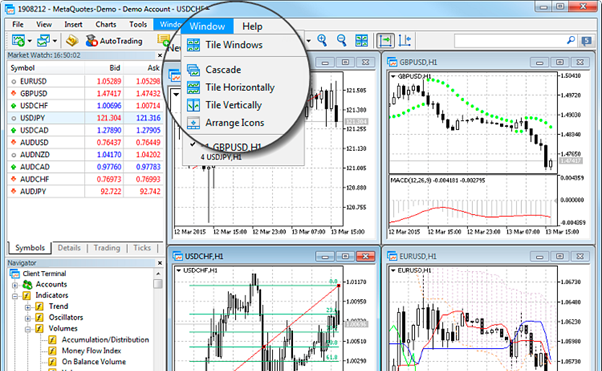
You can choose how the charts are arranged on the screen too. For this, you can select from the available chart arrangement types to organise the multiple open windows on your screen.

Tip: Remember to save the settings of your chart, as this will allow you to apply them to other forex charts that you may open later.

The crosshair option on the “Line Studies” toolbar as well as the Data Window allow you to view precise values on the chart. These could be price, time, or an indicator.
Things to Keep in Mind When Reading MT5 Forex Trading Charts
There are a few things to check when reading MetaTrader 5 forex trading charts:
Price and Time Axis
All trading charts represent time on the X-axis (horizontal) and price on the Y-axis (vertical). The time and date will change as you zoom into or out of the chart. A zoomed-out chart shows data over a longer period.
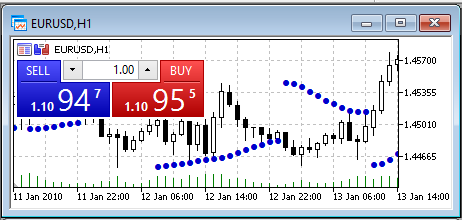
The price of the first currency (the base currency) is always reflected in units of the second currency. For instance, if you’re viewing the EURUSD forex chart, the prices on the Y-axis are the value of one euro, expressed in variable amounts of the US dollar. For instance, if the price shows as 1.45700, it means 1 euro is valued at $1.45700.
The current bid (buy) and ask (sell) price of your chosen forex pair will be visible at the top right corner of the chart. The difference between the two is the spread.
Forex prices are usually mentioned with four decimal places, which is why one pip (the smallest unit of price movement of an exchange rate) usually equals 0.0001. However, the MetaTrader 5 forex chart shows the quote with five digits after the decimal place, the final one being just one-tenth of a pip.
Timeframes
When trading forex, remember that:
- The monthly and weekly timeframes are most suitable for long-term investors
- The four-hourly, hourly and 30-minute timeframes are used mostly by intraday traders
- The 15-minute, 5-minute, and 1-minute timeframes are used by traders who actively monitor their charts and tend to hold their positions for a very short period.
Types of Trading Charts
Broadly speaking, there are three types of forex charts:
Line Chart
These connect points with a straight line and are the simplest charts used by forex traders. It represents only the closing price of the currency pair over the timeframe you are viewing. A line chart gives you the quickest snapshot of the forex market by focusing on the most important parameter, the closing price. While it cuts out the clutter, forex traders cannot view data of highs and lows and opening prices on a line chart.
Bar Chart
Bar charts are more informative than line charts as they show both opening and closing prices as well as the highs and lows during the chosen timeframe. Bar charts are also known as OHLC (open, high, low, close) charts. These comprise of a sequence of vertical lines that represent trading information.
The use of colours makes bar charts easier to read. Two colours are used in these charts, which are typically green and red. The green bar shows that the currency pair closed trading at a higher price than the opening price, while the red bar indicates the forex pair closed on a negative note, below the opening price. The green bars suggest that bulls are controlling the market and are called buyer bars. The red bars are called seller bars, as they indicate that bearish sentiment prevails in the market.
The open price is located on the left side of the vertical bar and is called ‘dash’. The close price is on the right side of the vertical bar and is represented by a horizontal line.
Candlestick Chart
Candlesticks are the most popular choice for reading forex charts. They are similar to bar charts as they also represent the open, high, close and low prices. The difference is that these charts have a box between the open and close values called the ‘body’ of the candlestick. While the vertical lines represent the range of trading price, the body shows the extent of price changes for the period.
How to Read Candlestick Charts
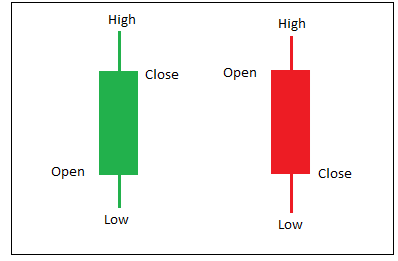
The coloured portions are the body of the candlestick. The vertical lines above and below each candle represent the highs and lows of the timeframe. For instance, if you are viewing a daily forex chart, these vertical lines will tell you how high or low the price reached on that day. These are also referred to as shadows, wicks or tails of the candle.
The body of the candle is coloured and are typically red and green. The red formation is the seller candle, indicating that the closing price was lower than the opening price. The green one is called the buyer candle, reflecting a higher close.
Bullish Patterns

Let’s say, the candle has a small body and a long wick below. This shape is known as the hammer candle and indicates a bullish pattern. Although the long wick below the body shows that sellers are pushing the market to new lows, the close price is much higher than the low, indicating that buyers are active and pushing the price back up. It suggests a possible upside, as the open and close prices are in the upper half of the candle.
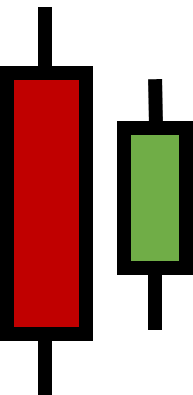
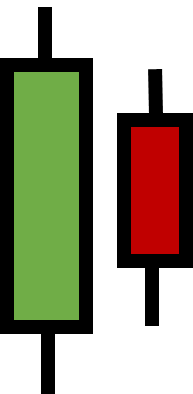
A red candle followed by a smaller green candle is called a ‘Bullish Harami’ or ‘inside candle’ formation. The green candle is formed inside the open and close prices of the previous red candle, suggesting the possibility of a breakout.
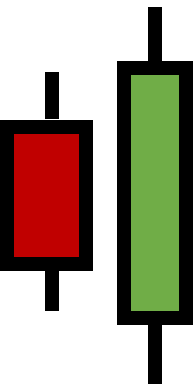
A smaller red candle followed by a bigger green candle is called a ‘bullish engulfing’ pattern. It suggests an improvement in market sentiment, as the second green candle engulfs the previous red candle’s open and close prices.
Bearish Patterns

An inverted hammer candle indicates that buyers are trying to push the market to a new high, but sellers are gaining momentum, pushing it down again. The inverted hammer is also known as a shooting star. It represents possible downside, as the open and close prices are in the lower half of the candle.
A green candle followed by a smaller red candle indicates a possible breakout. It is known as the ‘bearish harami’ pattern.
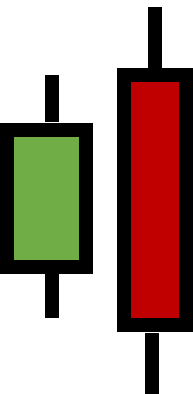
A green candle followed by a bigger red candle is called ‘bearish engulfing’ as the red candle engulfs the previous green candle’s open and close prices. It represents a shift in market sentiment to the downside.
The Simplest Patterns to Know for Reading MT5 Forex Charts
Forex traders use charts to identify patterns in past price movements for making predictions for the future. Some of the most common patterns are:
Head and Shoulders
As the name suggests, this pattern looks like a person’s head and shoulders. It is formed when a currency pair reaches a high, comes down the trendline, reaches another high that is higher than the previous high, and returns to the trendline. Following this, the currency pair reaches the third high, which is lower than the previous high, before returning to the trendline. The first and the third highs form the “shoulders” of the pattern, while the second high represents the “head”. The formation of such a pattern predicts a bullish-to-bearish trend reversal.
The mirror reflection of this pattern is called the inverse head and shoulders pattern, which predicts a bearish-to-bullish trend reversal.
Wedges (Triangle Patterns)
A rising wedge is formed on a forex chart when the currency pair makes a continued upward movement, then shoots up from a lower point and, after hitting several highs, comes down the trendline. In the falling wedge, the price exhibits a downward movement, following which it reaches several lows before shooting back above the trendline. A rising wedge is a bearish pattern, while a falling wedge is a bullish pattern.
Double Top & Bottom
During an uptrend, the currency pair may reach the same high at two different points in time, but faces resistance, and is unable to climb beyond it. This is known as the double top and indicates a possible downtrend.
The double bottom indicates a possible uptrend. This pattern occurs when the currency pair has hit the same low price twice at different points but does not decline more than that.
Cup and Handle
The cup and handle pattern is easy to identify. If the currency pair falls and then rises back to the previous value, it forms a cup shape. Following this, a smaller decline and rise occurs, forming the handle of the cup. This cup and handle pattern is considered a bullish signal, suggesting the continuation of an uptrend.
Bull and Bear Flags
These patterns are formed when trader sentiments fluctuate, and the market becomes indecisive. If a currency pair is trending upwards and the chart shows a little zig-zag pattern but remains mostly flat, this indicates the possibility of the pair continuing the uptrend. This is called a bull flag.
On the other hand, a bear flag is formed when the currency pair is on a downtrend and a zig-zag pattern appears but remains mostly flat. It suggests that the currency pair has further downside and may continue to decline.
Broadening Top
The broadening top pattern is formed by five consecutive rises and falls in the currency pair. Each time the price touches a high, it is higher than the previous one and substantially the price declines. This indicates a bearish trend.
To read MT5 charts better, you can drag and drop indicators from the “Trading Platform” section on the left of the charts. These indicators can help identify support and resistance levels and determine entry and exit points.
MetaTrader 5 gives you easy access to an ocean of information on the financial markets. This may seem overwhelming to a beginner. However, as you get familiar with the various features and tools, it will become easier to process all the information, especially since they are well arranged and visual. While MT5 forex charts are useful for making informed decisions while trading, it’s equally important to keep an eye on market-moving events like economic data releases and central bank announcements.
Power your trading with Vantage Markets.
Open a RAW ECN account and start trading with spreads from 0.0 pips.
The information has been prepared as of the date published and is subject to change thereafter. The information is provided for educational purposes only and doesn't take into account your personal objectives, financial circumstances, or needs. It does not constitute investment advice. We encourage you to seek independent advice if necessary. The information has not been prepared in accordance with legal requirements designed to promote the independence of investment research. No representation or warranty is given as to the accuracy or completeness of any information contained within. This material may contain historical or past performance figures and should not be relied on. Furthermore estimates, forward-looking statements, and forecasts cannot be guaranteed. The information on this site and the products and services offered are not intended for distribution to any person in any country or jurisdiction where such distribution or use would be contrary to local law or regulation.