


 Login





Why Texas Instruments Stock Edged Higher as Q4 Guidance Beat Estimates – TXN Analysis

Vantage Editorial Team >
Vantage Editorial Team >
Vantage is a global, multi-asset broker with a team of in-house writers and market analysts who produce educational and insightful trading content for traders of all levels.
 Updated Thu, 2026 October 22 06:34

Key Takeaways
- Texas Instruments (TI) reported Q3 2026 revenue of $6.06 billion, up 28% year on year, and earnings per share of $2.62 against a $2.40 consensus. 1,2
- TI guided Q4 revenue to $5.80 billion to $6.30 billion, a midpoint level with Q3 in a quarter that is usually seasonally weaker. 1,6
- After-hours reports were mixed, from a 2% gain to a 0.50% dip; 3,15 by 09:46 (GMT+8) on 22 October, TXN was quoted at $287.87 overnight, 1.22% above the $284.39 chart close.
Texas Instruments (NASDAQ:TXN) stock did almost everything right on 21 October and still got a mixed reception. The company beat on revenue, on earnings, and on guidance, yet after-hours reports ranged from a 2% gain 15 to a 0.50% slip to $283.35. 3 Some crowds are hard to please.
By 09:46 (GMT+8) on 22 October 2026, the overnight TXN stock quote on the TradingView chart had turned to $287.87. That split-then-settle reaction is the real TXN stock news. This piece unpacks why a beat-and-raise met hesitation at all, and what changes before NXP reports on 27 October and the Federal Reserve decides on 28 October.
Instrument snapshot: As of 09:46 (GMT+8) on 22 October 2026, the TXN stock price today was $287.87 in US overnight trading, 1.22% above the 21 October close of $284.39 on the TradingView chart (1.13% above the $284.65 official close reported by AskTraders); 5 the 52-week range is $152.73 to $334.03. 3 Texas Instruments Inc stock lists on Nasdaq, and US share CFDs on Vantage are priced from the underlying Nasdaq shares.
Why Is TXN Stock Up Today?
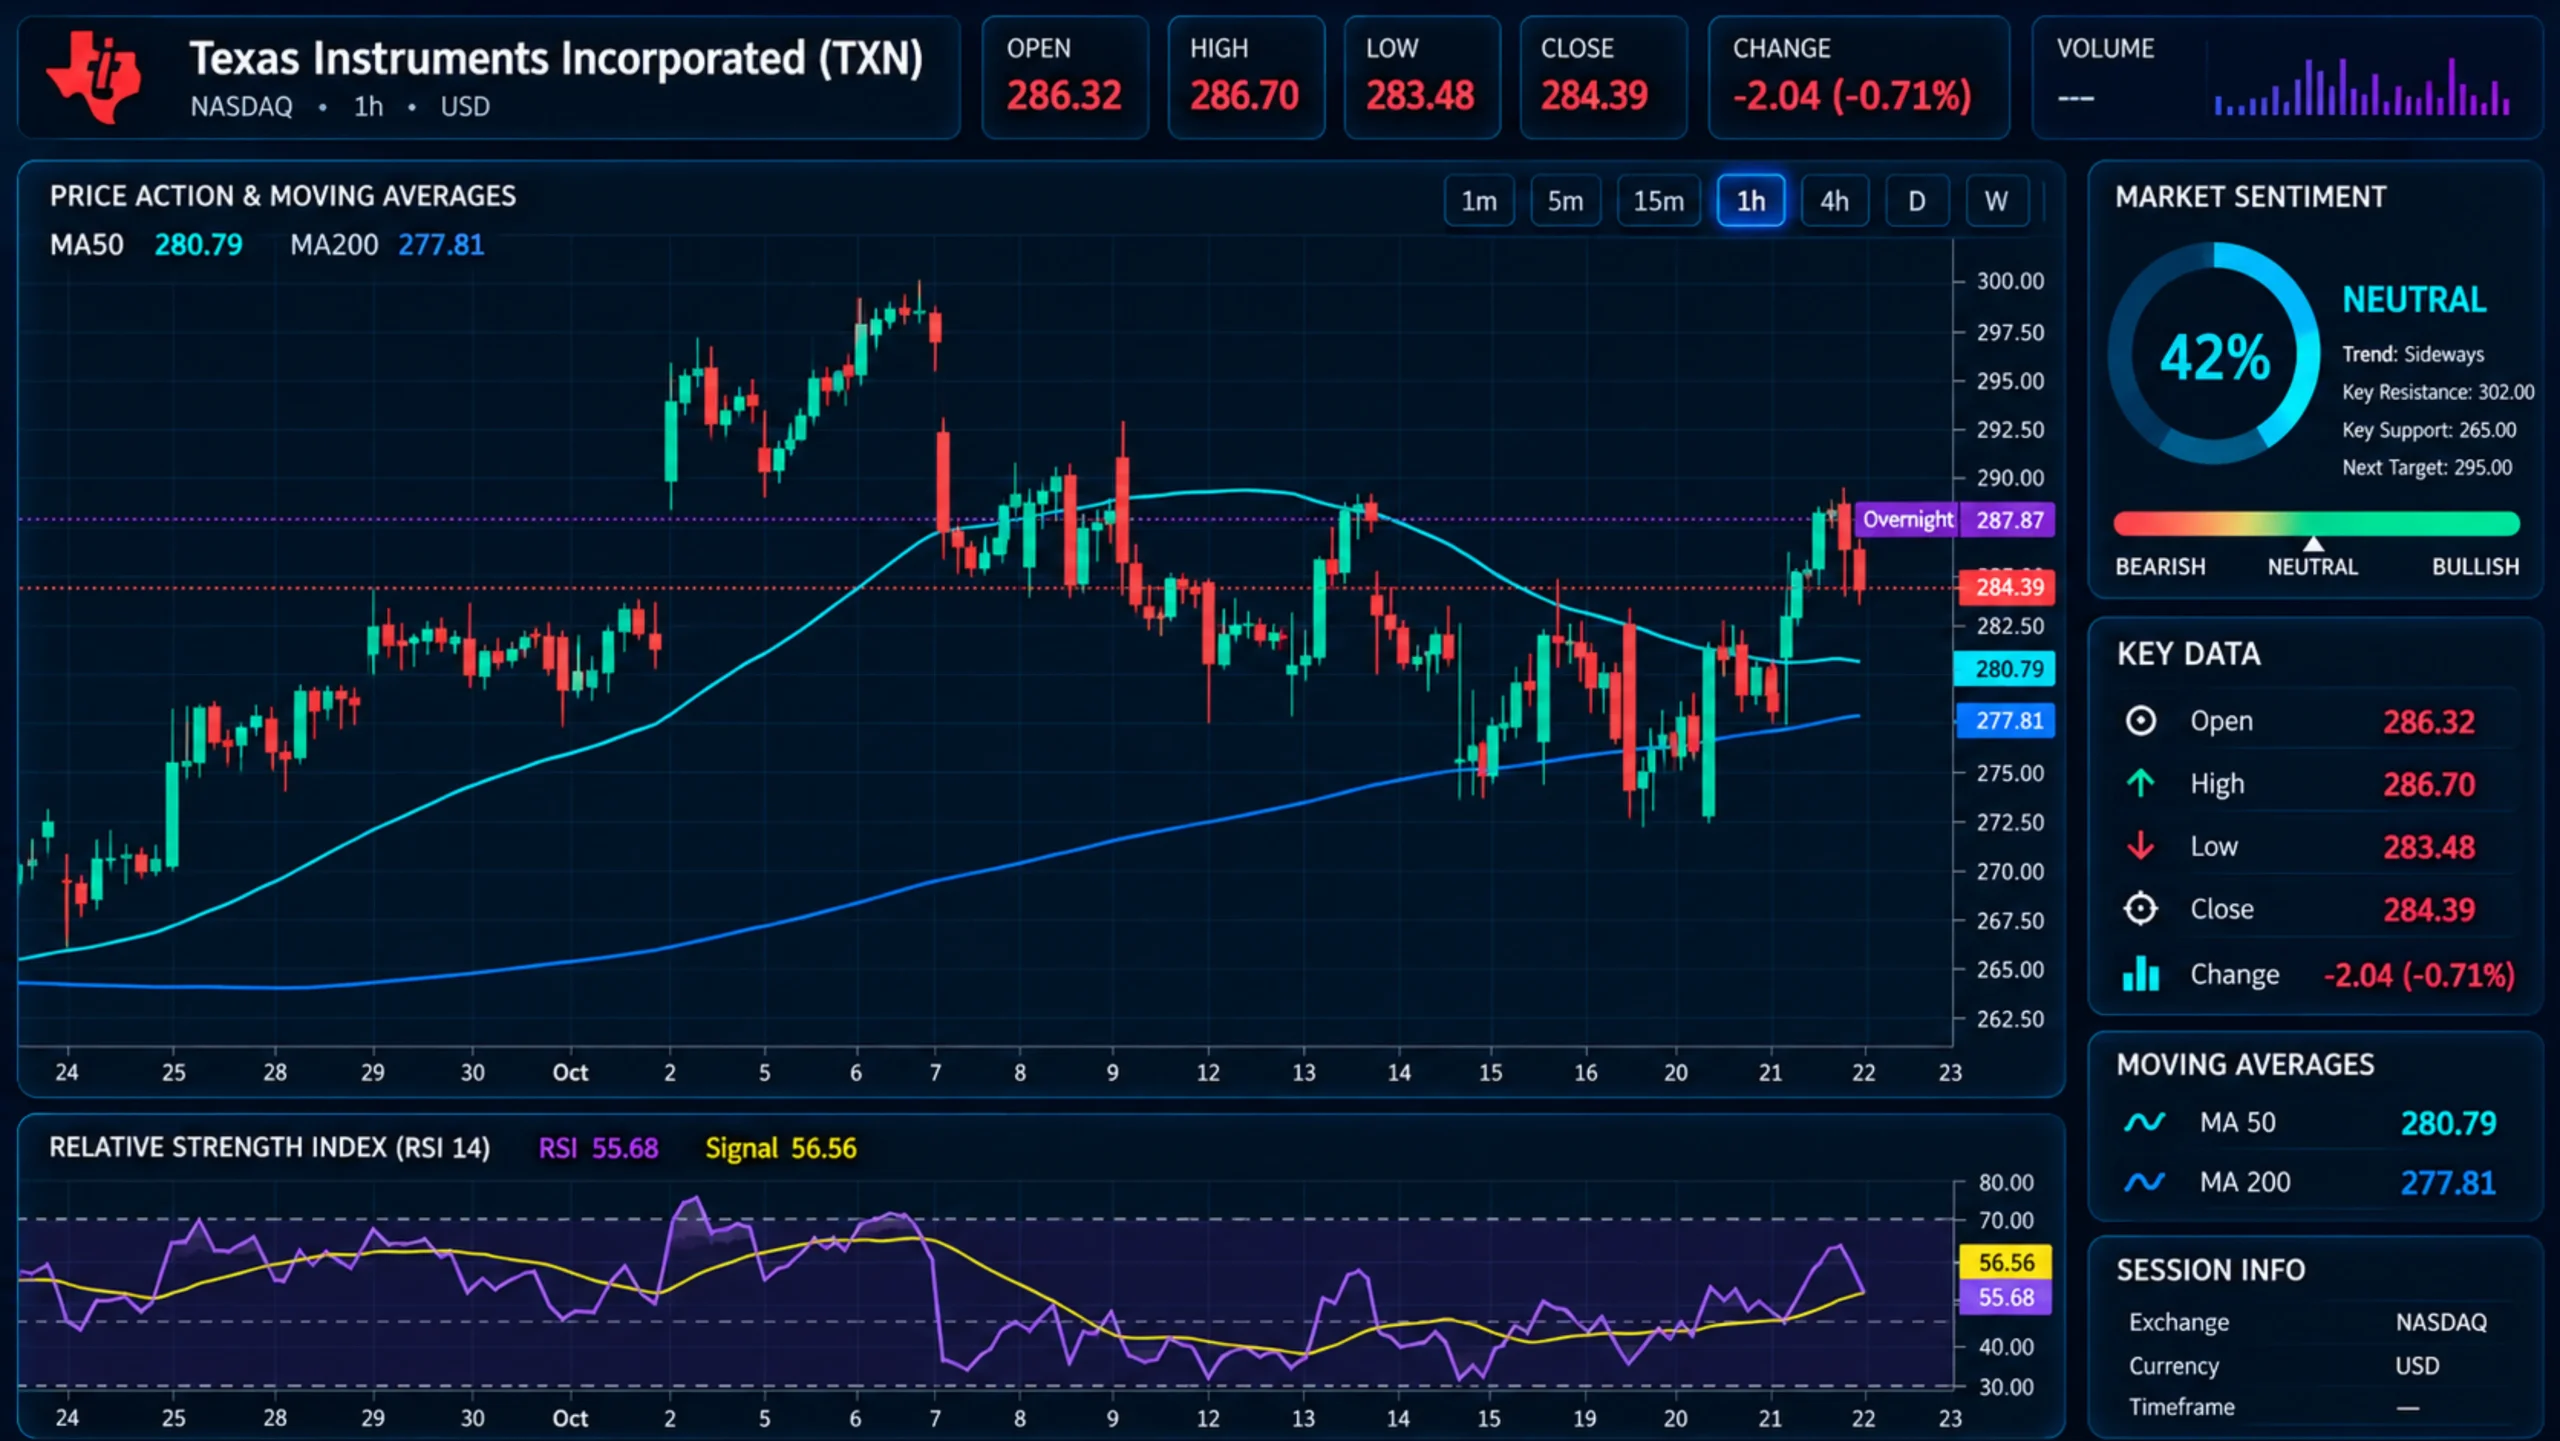
Texas Instruments stock edged higher overnight after TI beat third-quarter estimates and guided fourth-quarter revenue to $5.80 billion to $6.30 billion, flat with Q3 in a seasonally weaker quarter. After-hours trade was mixed, but by 09:46 (GMT+8) TXN was quoted 1.22% above its chart close.
For anyone checking the Texas Instruments stock price today from Asia, timing matters: TI published at 04:00 (GMT+8), and the next regular session opens at 21:30 (GMT+8). Most of the region slept through the whole plot twist.
Q3 Beat on Revenue and Earnings
TI’s third-quarter revenue rose 28% to $6.06 billion, and earnings per share (EPS) reached $2.62 against $1.48 a year ago. Nine analysts surveyed by Zacks Investment Research had pencilled in $2.40 and $5.93 billion, according to the Associated Press. Chief executive Haviv Ilan credited “continued broad growth in industrial, automotive and data center”. 1
| Metric | Reported or Guided | Analyst Estimate | Gap Versus Estimate |
| Q3 Revenue | $6.06B | $5.93B (Zacks) | +2.11% |
| Q3 EPS | $2.62 | $2.40 (Zacks) | +$0.22 (+9.17%) |
| Q4 Revenue Guide (Midpoint) | $6.05B ($5.80B to $6.30B) | $5.73B (Benzinga) | +5.58% |
| Q4 EPS Guide (Midpoint) | $2.62 ($2.45 to $2.79) | $2.29 (Benzinga) | +$0.33 (+14.41%) |
| Q3 Gross Margin | About 64% | Not published | Not applicable |
Table 1: TXN Q3 2026 Results and Q4 2026 Guidance Versus Estimates. Sources: TI Form 8-K, Associated Press, Benzinga; midpoint comparisons are Vantage calculations. Accessed on 22 October 2026.
The guide was the bigger beat: its EPS midpoint sat 33 cents above Benzinga’s Q4 consensus, 4 against a 22-cent beat on the quarter versus Zacks. 2 The only blemish was a one-cent EPS reduction TI had not guided for, 1 a footnote that needs reading glasses on a $2.62 print.
The numbers were fine. So why did after-hours trade not simply go one way?
Why Texas Instruments Stock Dipped First
Anyone asking why is Texas Instruments stock down got different answers depending on the time stamp of the report they read. The short answer to why TXN stock is down in some after-hours prints: a lot of good news was already in the price. TXN gained about 2.50% in the regular session before the release, closing at $284.65 by AskTraders’ count, with AskTraders also reporting a 0.30% after-hours dip, 5 and Investing.com linked the after-hours softness to investors banking gains after that run-up. 3
Analysts had also set the bar high. Cantor Fitzgerald flagged before the report that consensus for TI was the “most aggressive versus seasonal trends across the Analog group”. 7 On the call, Bernstein’s Stacy Rasgon put the seasonal problem plainly: “Usually Q4 just seasonally is down”. 8 TI answered by guiding flat. Ilan credited data centre revenue, which he described as non-seasonal and which rose about 95% year on year, plus industrial growth above 40%. 6
The quarter beat the Zacks EPS estimate by 22 cents. The Q4 guidance midpoint beat Benzinga’s estimate by 33 cents, and the stock had already climbed 2.50% before either was published.
On the reports cited here, the market priced much of the quarter in before the release, and the overnight quote settled after the guidance had been digested. J.P. Morgan’s Harlan Sur added a pricing angle, saying supply dynamics “feel like they’re getting worse, not better”. 9 Closer to home, TI said its new Malaysian assembly and test site is now its largest such facility. 6
The fundamentals point one way. The hourly chart shows how much of that the price had absorbed.
TXN Stock Chart: $289 Capped Twice
On the hourly (H1) chart, TXN spent 15 to 20 October between roughly $272 and $284, after a 7 October gap lower ended a run that peaked near $298.50. Price reclaimed the 200-period moving average (MA) late on 20 October, and the 21 October session broke out of the range, trading near $289 before closing at $284.39, above both the 50-period MA ($280.79) and the 200-period MA ($277.81) as of that close.
That $289 area also capped the stock on 13 to 14 October, and the $287.87 overnight quote sat just below it at the cut-off. Two stalls in the same place are a pattern worth noting, not a promise of a third.
The 14-period Relative Strength Index (RSI) on the TradingView setup used for this analysis eased from the mid-60s to 55.68 by the close, just under its 56.56 signal line: firm, but far from the near-80 reading of 2 October. Our guide to technical indicators explains how RSI and moving averages are read together.
| Level | Price Area | What the Chart Shows |
| Level 3 Resistance | ~$298.50 | 6 October high, before the 7 October gap lower |
| Level 2 Resistance | ~$292.50 | 9 October intraday spike high |
| Level 1 Resistance | ~$289.00 | Capped price on 13 to 14 and 21 October |
| Level 1 Support | $280.79 | 50-period MA (H1) |
| Level 2 Support | $277.81 | 200-period MA (H1) |
| Level 3 Support | ~$272.00 | 19 to 20 October lows |
Table 2: TXN Levels Traders Are Watching, as of 09:46 (GMT+8) on 22 October 2026. Source: TradingView TXN H1 chart (Nasdaq data). Overnight quote at the cut-off: $287.87. Indicative only.
Levels show where price has been (more in our technical analysis coverage); the calendar decides when the read gets tested.
TXN Stock Dividend and the Next Catalysts
The TXN stock dividend rose 7% to $1.52 a quarter in September, or $6.08 a year, marking 23 consecutive years of increases. 10 The board formally declared it on 15 October, payable on 10 November to holders of record on 30 October. 11 On the $284.39 close, that is a yield of about 2.14%, worked out without a TI calculator, though one would have been on-brand.
Texas Instruments Stock Checklist for the Next Two Weeks
- NXP Results, 27 October 2026: NXP Semiconductors (NASDAQ:NXPI) reports after the US close, about 04:00 (GMT+8) on 28 October, giving a peer read on TI’s industrial and auto view. 12
- Fed Decision, 28 October 2026: The Federal Open Market Committee (FOMC) statement is due at 14:00 US Eastern Time, or 02:00 (GMT+8) on 29 October. 13 Follow it on our Federal Reserve news page.
- Dividend Record Date, 30 October 2026: Holders of record receive the $1.52 Texas Instruments stock dividend on 10 November. 11
- US Clock Change, 1 November 2026: The Nasdaq open moves from 21:30 to 22:30 (GMT+8) for traders in Asia.
That leaves the analog read-across about 22 hours to itself before the Fed decision lands. The read weakens if price closes back below the 200-period MA near $277.81, or if NXP describes a softer industrial backdrop than TI did. It holds while price stays above both MAs and peer guidance lines up.
TXN Stock FAQ: Symbol, Forecast, and Price Target
What Is the Texas Instruments Stock Symbol?
The TXN stock symbol trades on Nasdaq. Type Texas Instrument stock, TXN stocks, stock TXN, or stock price Texas Instruments into a search bar and you land on the same company; the stock price TXN showed overnight was $287.87 at the cut-off. Our Nasdaq news today page tracks the wider index.
What Is the TXN Stock Forecast and Price Target?
Vantage does not publish a Texas Instruments stock forecast. Before the results, published TXN stock price target views ran from $225 at Goldman Sachs to $400 at KeyCorp, with a MarketBeat consensus of $304.26; 16 Benzinga’s list showed Bernstein at $290 and J.P. Morgan and Cantor Fitzgerald at $340. 14 All predate the Q4 guide.
Why Is TXN Stock Down Today?
At the 09:46 (GMT+8) cut-off, it was not: some after-hours reports showed a 0.30% to 0.50% dip, 3,5 but the overnight quote stood 1.22% above the chart close. Sector results continue on our earnings news today page.
Gap Risk Before NXP and the Fed
So why did Texas Instruments stock trade mixed after hours, then edge higher overnight? On the reports cited here, the pre-results run-up and the stronger guidance pulled in opposite directions before the guidance showed through. Whether that holds rests on the $277.81 to $289 band and on NXP and the Fed, both tracked in stock market news today and our wider stock market news.
Earnings land outside regular hours, so a share price can open well away from its prior close, as TXN’s overnight quote showed. A Stop Loss order can limit losses to a planned size in normal conditions, but when the market gaps through the set level, the order can be filled at a worse price. Positions held through NXP’s results and the FOMC decision carry the same gap risk.
Leverage is double-edged: it magnifies losses as well as gains. Vantage lists leverage of 1:33.3 for TXN share CFDs, which means margin of about 3% of a position’s value. At that ratio, the 1.22% overnight move equals roughly 41% of the margin posted, and a move of about 3% against a position would roughly equal all of it. Sizing positions as a share of account equity, rather than from a price level, keeps that arithmetic visible.
Related Reading
RISK WARNING: CFDs are complex financial instruments and carry a high risk of losing money rapidly due to leverage. You should ensure you fully understand the risks involved and carefully consider whether you can afford to take the high risk of losing your money before trading.
Disclaimer: The information is provided for educational purposes only and doesn’t take into account your personal objectives, financial circumstances, or needs. It does not constitute investment advice. We encourage you to seek independent advice if necessary. The information has not been prepared in accordance with legal requirements designed to promote the independence of investment research. No representation or warranty is given as to the accuracy or completeness of any information contained within. This material may contain historical or past performance figures and should not be relied on. Furthermore estimates, forward-looking statements, and forecasts cannot be guaranteed. The information on this site and the products and services offered are not intended for distribution to any person in any country or jurisdiction where such distribution or use would be contrary to local law or regulation.
References
[1] “TI Reports Third Quarter 2026 Financial Results and Shareholder Returns (Form 8-K, Exhibit 99) – SEC EDGAR” https://www.sec.gov/Archives/edgar/data/0000097476/000009747626000165/q32026txnex99-eredgar.htm Accessed on 22 October 2026.
[2] “Texas Instruments: Q3 Earnings Snapshot – WTOP (Associated Press)” https://wtop.com/national/2026/10/texas-instruments-q3-earnings-snapshot Accessed on 22 October 2026.
[3] “Why Is Texas Instruments Stock Slipping Today? – Investing.com” https://www.investing.com/news/stock-market-news/why-is-texas-instruments-stock-slipping-today-93CH-4964227 Accessed on 22 October 2026.
[4] “Texas Instruments Posts Strong Q3, Guides Q4 Revenue Above Estimates – Benzinga” https://www.benzinga.com/markets/earnings/26/10/62512709/texas-instruments-posts-strong-q3-guides-q4-revenue-above-estimates Accessed on 22 October 2026.
[5] “Texas Instruments Beats Third-Quarter Estimates and Guides Well Above Forecasts for Q4 – AskTraders” https://www.asktraders.com/analysis/texas-instruments-beats-third-quarter-estimates-and-guides-well-above-forecasts-for-q4/ Accessed on 22 October 2026.
[6] “Texas Instruments Q3 2026 Earnings Call: TI Posts 28% Revenue Surge to $6.1B, Guides Q4 Flat Sequentially – BigGo Finance” https://finance.biggo.com/news/US_TXN_2026-10-21 Accessed on 22 October 2026.
[7] “Cantor Fitzgerald Reiterates Neutral Rating on Texas Instruments Stock – Investing.com” https://investing.com/news/analyst-ratings/cantor-fitzgerald-reiterates-neutral-rating-on-texas-instruments-stock-93CH-4959964 Accessed on 22 October 2026.
[8] “Earnings Call Transcript: Texas Instruments Tops Q3 2026 Forecasts – Investing.com” https://in.investing.com/news/stock-market-news/earnings-call-transcript-texas-instruments-tops-q3-2026-forecasts-93CH-5646558 Accessed on 22 October 2026.
[9] “Texas Instruments Q3 2026 Earnings Call Transcript – Benzinga” https://www.benzinga.com/news/26/10/62514143/texas-instruments-q3-2026-earnings-call-transcript Accessed on 22 October 2026.
[10] “TI Increases Dividend 7% to $1.52 per Share, Marking 23 Consecutive Years of Increases (Form 8-K, Exhibit 99) – SEC EDGAR” https://www.sec.gov/Archives/edgar/data/0000097476/000095010326014118/dp253473_ex99.htm Accessed on 22 October 2026.
[11] “Texas Instruments Board Declares Fourth Quarter 2026 Quarterly Dividend – Finviz (PR Newswire)” https://finviz.com/news/403345/texas-instruments-board-declares-fourth-quarter-2026-quarterly-dividend Accessed on 22 October 2026.
[12] “NXP Semiconductors Announces Conference Call to Review Third Quarter 2026 Financial Results – Finviz (GlobeNewswire)” https://finviz.com/news/399191/nxp-semiconductors-announces-conference-call-to-review-third-quarter-2026-financial-results Accessed on 22 October 2026.
[13] “October 2026 Calendar – Board of Governors of the Federal Reserve System” https://www.federalreserve.gov/newsevents/2026-october.htm Accessed on 22 October 2026.
[14] “Texas Instruments Likely to Report Higher Q3 Earnings; These Most Accurate Analysts Revise Forecasts Ahead of Earnings Call – Benzinga” https://www.benzinga.com/analyst-stock-ratings/price-target/26/10/62491589/texas-instruments-likely-to-report-higher-q3-earnings-these-most-accurate-analysts-revise-forecasts-ahead-of-earnings-call-2 Accessed on 22 October 2026.
[15] “Texas Instruments (TXN) Shares Rise 2% After Strong Q3 Earnings Beat – GuruFocus” https://www.gurufocus.com/news/9135136/texas-instruments-txn-shares-rise-2-after-strong-q3-earnings-beat Accessed on 22 October 2026.
[16] “Texas Instruments Q3 Earnings Forecast Lifted by KeyCorp – MarketBeat” https://www.marketbeat.com/instant-alerts/estimates-texas-instruments-q3-earnings-forecast-lifted-by-keycorp-2026-10-19/ Accessed on 22 October 2026.
The information has been prepared as of the date published and is subject to change thereafter. The information is provided for educational purposes only and doesn't take into account your personal objectives, financial circumstances, or needs. It does not constitute investment advice. We encourage you to seek independent advice if necessary. The information has not been prepared in accordance with legal requirements designed to promote the independence of investment research. No representation or warranty is given as to the accuracy or completeness of any information contained within. This material may contain historical or past performance figures and should not be relied on. Furthermore estimates, forward-looking statements, and forecasts cannot be guaranteed. The information on this site and the products and services offered are not intended for distribution to any person in any country or jurisdiction where such distribution or use would be contrary to local law or regulation.
