


 Login





Why Gold Rose as Oil Eased on Trump’s Iran Pledge – XAUUSD Analysis

Vantage Editorial Team >
Vantage Editorial Team >
Vantage is a global, multi-asset broker with a team of in-house writers and market analysts who produce educational and insightful trading content for traders of all levels.
 Updated Mon, 2026 October 12 02:52

Key Takeaways
- Gold rose 0.92% to 4,171.03 on 9 October 2026, while the US Dollar Index slipped to around 102. 1,4
- Oil eased after President Donald Trump said the US would not attack Iran before the 3 November midterm elections. 1,2
- On the Vantage XAUUSD 4-hour chart, price sat above its 50-period average (4,150.22) and below its 200-period average (4,330.03) at 10:26 (GMT+8).
Gold rose 0.92% to 4,171.03 on 9 October 2026, hours after President Donald Trump ruled out US strikes on Iran before the midterms. 1,2 On the textbook view, a calmer Middle East should cool demand for a haven. Gold, it seems, skipped that chapter. As of 10:26 (GMT+8), XAUUSD traded at 4,171.12 on the Vantage feed.
That gap is what this piece unpacks: why gold prices today have been trading the Middle East conflict through oil, inflation, and the Federal Reserve rather than through fear, and what that changes into US CPI on 14 October. If you hold gold exposure, an oil headline can now push the metal the opposite way to the old haven playbook.
Snapshot: As of 10:26 (GMT+8) on 9 October 2026, the Vantage XAUUSD price was 4,171.12, 0.10% below the open of that 4-hour candle. Benchmark gold sat roughly 26% below its January 2026 record of 5,608.35 (4,171.03 ÷ 5,608.35 = 0.744). 1
Gold Price Today: The Short Answer
Gold rose 0.92% to 4,171.03 on 9 October 2026 as oil eased after President Trump ruled out strikes on Iran before the midterms, Treasury yields slipped, and the dollar softened. In 2026, gold has tended to trade the Middle East through oil and Fed pricing.
Here is how each driver lined up on the day. We log moves like this one in our gold price news coverage.
| Driver | Latest Reading | How Gold Responded |
|---|---|---|
| Oil | Brent rose above $104 on 8 October, then eased after Trump’s post 1,2 | Gold rose 0.92% on 9 October 1 |
| Fed Pricing | About 82% odds of an October hold, 81% of a December hike 1 | Hike pricing has weighed on gold since the conflict began in late February 11 |
| Yields and Dollar | Dollar Index near 102 after a strong 30-year auction 4 | A softer dollar coincided with the gain 4 |
| Central Banks | PBoC added 740,000 oz in September, its 23rd straight month 7,9 | Official demand cushioned losses, per ANZ 11 |
| Chart | Above the 4H 50-period average, below the 200-period average | Range of roughly 4,065 to 4,220 since 28 September |
Sources: Trading Economics, CNBC, PBoC data via Bloomberg and The Standard, Investing.com, accessed 9 October 2026. Chart readings from the Vantage XAUUSD 4-hour chart at 10:26 (GMT+8).
Gold Rose as Oil and Yields Eased
What struck us first: nothing about the bounce looked like panic. On Thursday, Brent rose more than 4% to above $104 a barrel after Trump said late Wednesday that renewed strikes on Iran were under consideration. 2 He then posted that the US was having “productive discussions” with Tehran and would not attack before the 3 November midterms, and oil came off its highs. 1,2 The barrel-by-barrel story sits in our crude oil news today feed.
The bond market added a second push. Treasury yields fell after a well-received 30-year auction, and the US Dollar Index slipped to around 102, still close to its strongest level since April 2025. 4 Lower yields and a softer dollar both trim the headwind on the gold USD price. Axios noted, though, that there was no sign the major differences between Washington and Tehran had narrowed. 3
Then there is the timing, which the wires skipped. On the Vantage XAUUSD feed, the largest 4-hour candle of the bounce covered 06:00 to 10:00 (GMT+8) on 9 October, lifting price from the mid-4,130s to above 4,170. Most of the lift landed before many Asian desks had poured a second coffee.
That explains the timing. It does not explain why a calmer oil market helped a metal people usually hold for protection.
Why Oil, Not Fear, Is Moving Gold

The obvious read is that gold is a war hedge. This year, the price has not cooperated: Investing.com noted gold was down about 20% since the conflict began in late February. 11 That is hard to square with a pure fear trade.
The explanation runs through the Federal Reserve. The Fed raised rates by 25 basis points to 3.75% to 4.00% on 16 September, its first increase in three years. 5 Minutes released on 7 October showed most policymakers saw another hike as appropriate before year-end, and markets priced around 81% odds of a December move as of 9 October. 1
Precious metals analysts at Heraeus spelled out the link in a note published on 5 October. With Brent around $100, they wrote, the worry was that “energy costs could keep inflation elevated and monetary policy tighter for longer”. 13 In plain terms: higher oil feeds inflation, inflation feeds hike pricing, and higher rates raise the cost of holding a metal with no yield. Oil has acted as the translator between the Middle East and the Fed.
This is not the first time 2026 has run this script. On 23 March, Trading Economics reported gold had fallen as much as 8% in one session after a week of surging oil, then trimmed losses once Trump postponed planned strikes. 8 That episode explains the mechanism; it is not a guide to what happens next.
In 2026, gold has tended to trade the Middle East through oil, and oil through the Fed.
That channel can push gold lower quickly. September showed something else working underneath it.
The Central Bank That Kept Adding Gold
The People’s Bank of China (PBoC) added 740,000 troy ounces of gold in September, lifting holdings to 77.47 million ounces and extending its accumulation streak to 23 months. 7,9 Kitco, citing the PBoC, put the addition at 21 tonnes; 6 our own arithmetic lands nearer 23 tonnes, and we have not reconciled the gap independently.
The timing is the interesting bit. Bloomberg reported the purchases stepped up as prices weakened toward $4,000 an ounce. 7 Analysts at ANZ said strong central bank demand helped limit gold’s losses even as higher yields and a firmer dollar pressured investors, 11 and ING made a similar point. 12
Not everyone is ready to pick a side, though. Kenny Zhu, Director of Research and Investment Strategy at Sprott, said gold holding its range while ETFs still drew inflows suggests “we’re at a point of indecision”. 14
One caveat: the PBoC is one participant among many, and its data arrives monthly, after the fact. For readers weighing XAUUSD investing over months rather than trading over sessions, that matters. Rate pricing resets by the session; reserve purchases show up in the data on a monthly clock.
So the fundamentals pull in two directions. The XAUUSD chart shows where that balance stood at the cut-off.
XAUUSD Chart Today: Above the 50, Below the 200
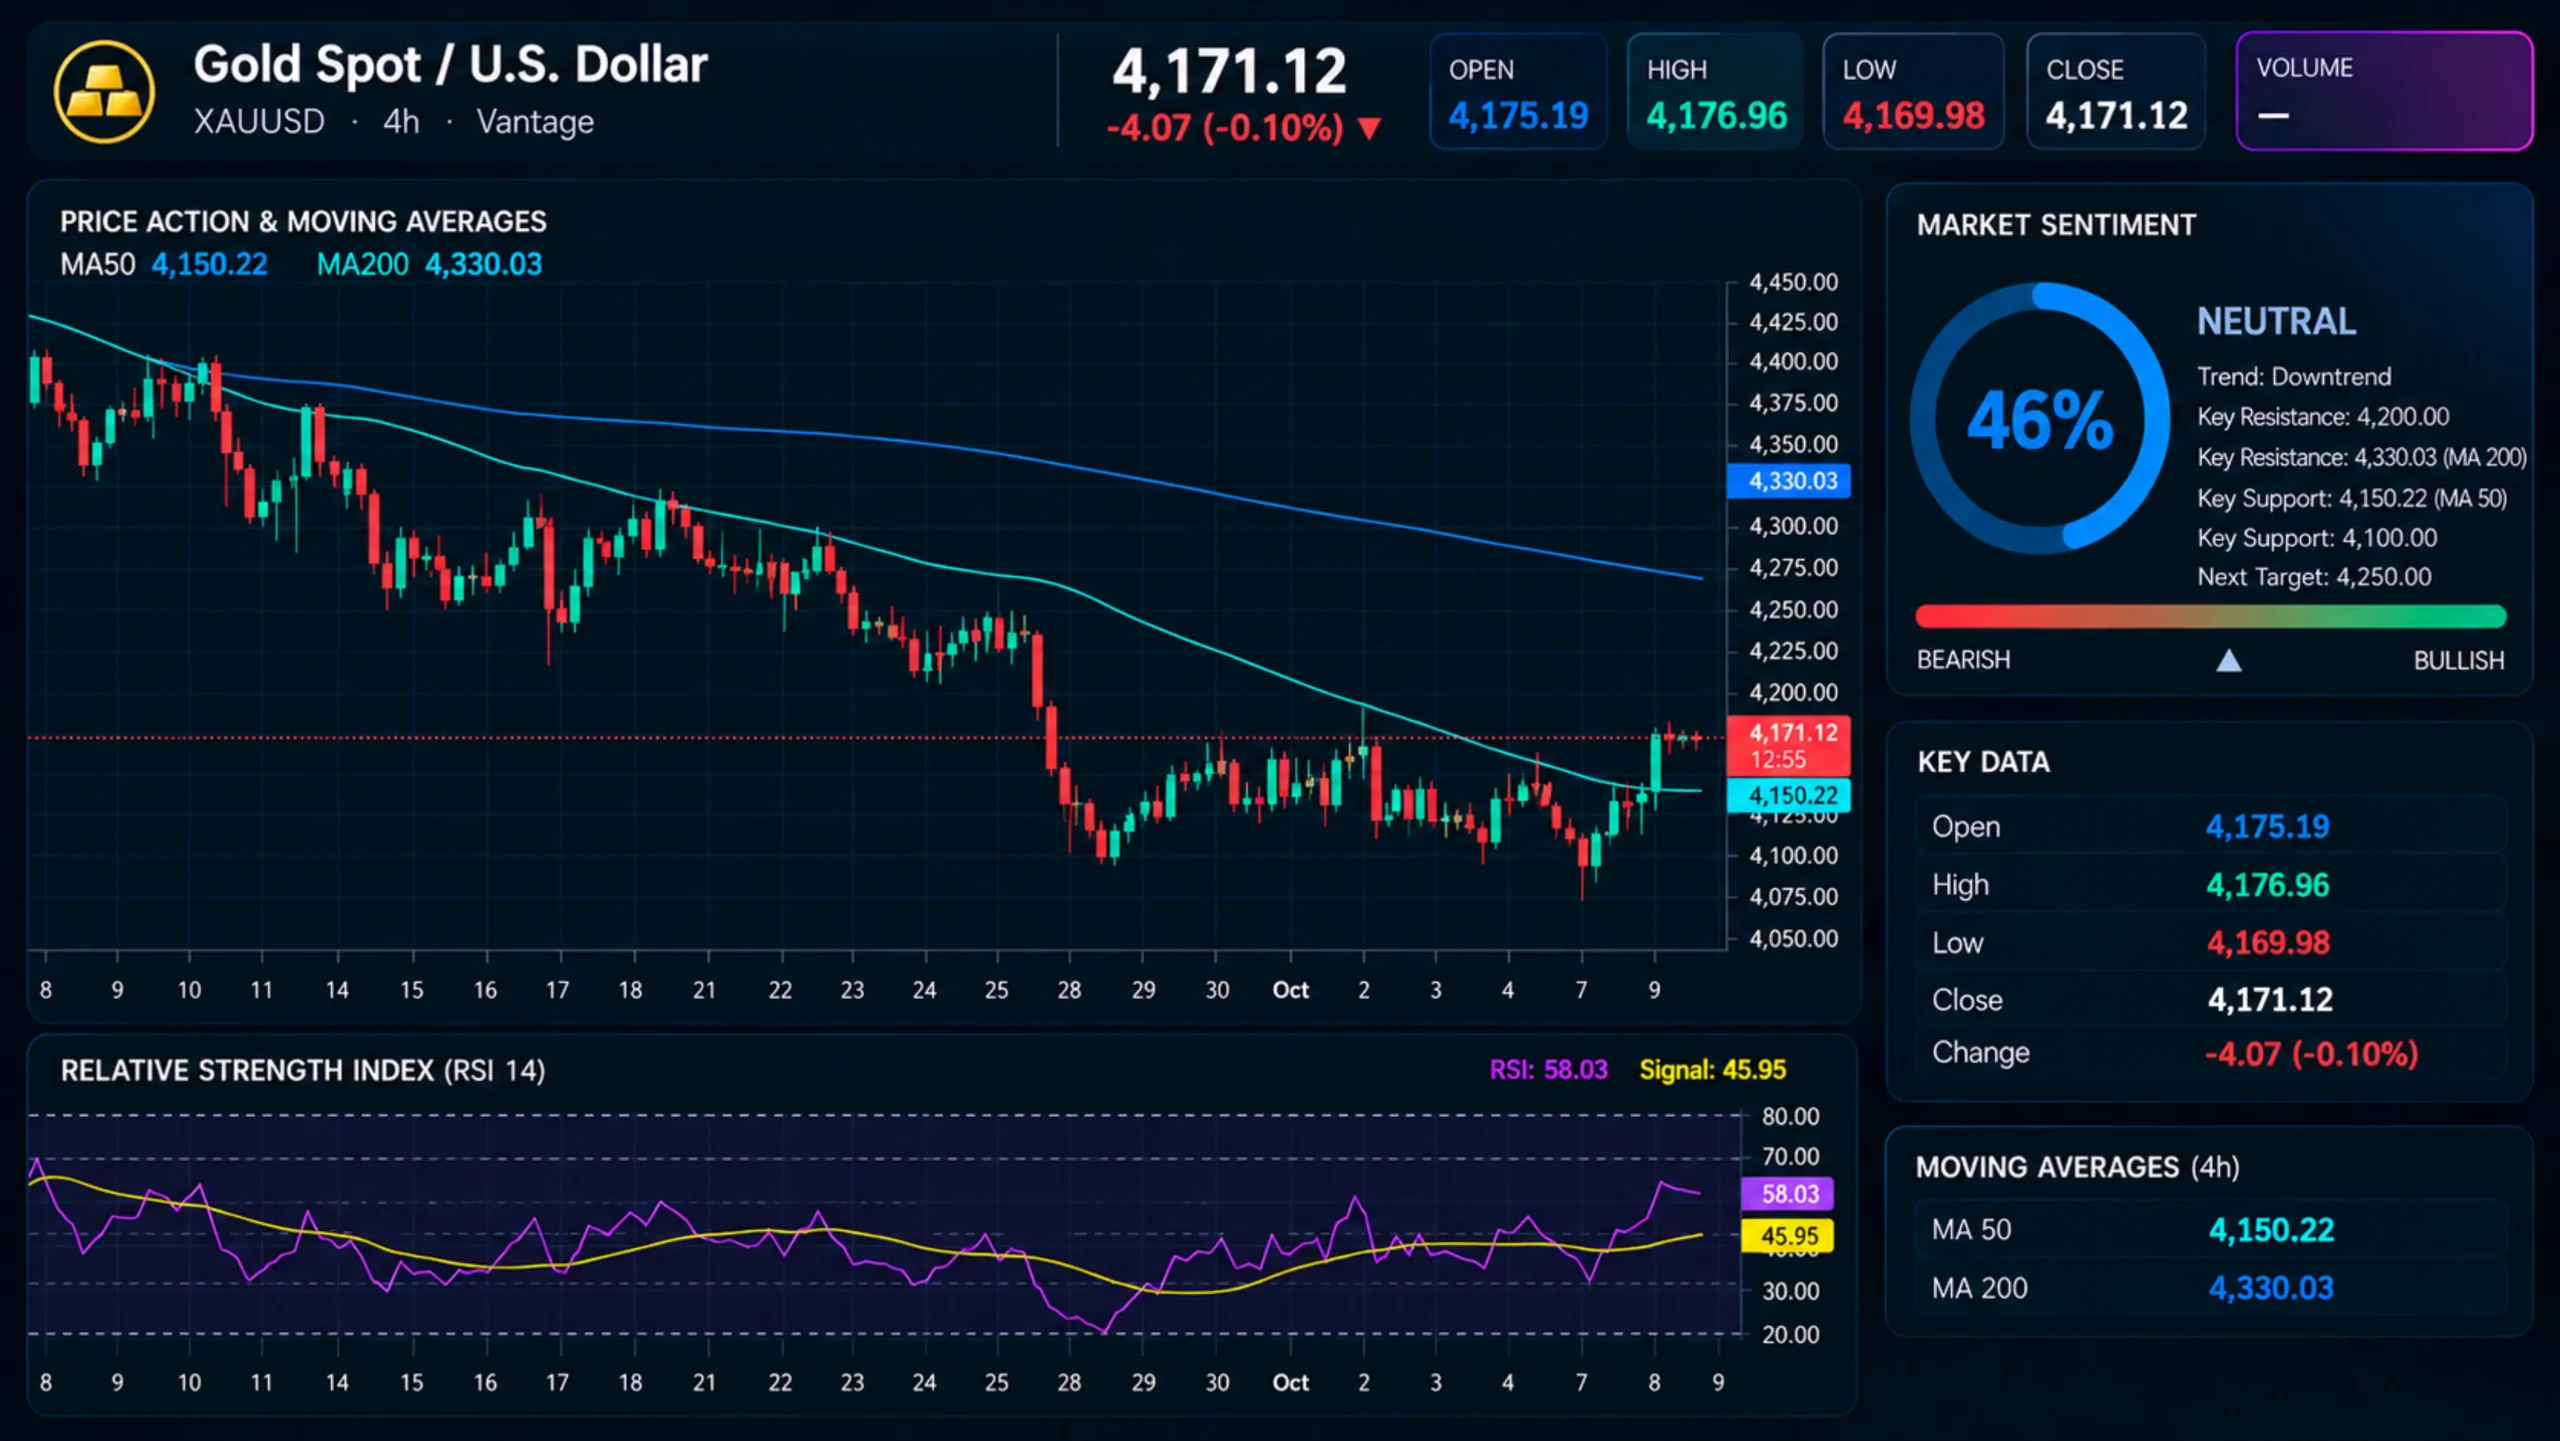
Here is the XAUUSD technical analysis today, straight from the 4-hour gold USD chart. At 4,171.12, price sat above the 50-period moving average at 4,150.22 and below the 200-period average at 4,330.03 as of 10:26 (GMT+8) on 9 October. Both lines still sloped lower, with the 50 below the 200 since mid-September.
Since late September, the gold price chart today has been a range: a drop from near 4,300 on 25 September to around 4,110 on 28 September, then a box between a wick low near 4,065 on 7 October and wick highs near 4,220. The 14-period Relative Strength Index (RSI) read 58.03 on the TradingView setup used for this analysis, up from around 22 in late September. RSI visited the basement in late September and has since reached the ground floor, well short of the 70 overbought line.
Levels Traders Are Watching: Vantage XAUUSD 4H, as of 10:26 (GMT+8), 9 October 2026
| Level | Reference on the Chart |
|---|---|
| Around 4,330 | Level 2 resistance: 200-period moving average (4,330.03) |
| Around 4,220 | Level 1 resistance: wick highs on 30 September and 2 October |
| 4,171.12 | Price at the cut-off |
| Around 4,150 | Level 1 support: 50-period moving average (4,150.22) |
| Around 4,110 | Level 2 support: 28 September low area |
| Around 4,065 | Level 3 support: 7 October wick low |
Levels read from the Vantage XAUUSD 4-hour chart on TradingView at 10:26 (GMT+8), 9 October 2026. Data indicative, for informational purposes only.
What would change the read: a 4-hour close back below the 50-period average would return price to the lower half of the range, while a close above the 4,220 area would mark the first break of the range ceiling since 28 September. Neither is a call on direction. See the latest analysts’ views on Gold price here.
Gold News Today: What to Watch Next
- US CPI, 14 October 2026: September consumer prices land at 20:30 (GMT+8). 10 August CPI was 3.4% year on year. 1 We will track the print in CPI news.
- FOMC Decision, 28 October 2026: The Fed’s next rate announcement, 13 due at 02:00 (GMT+8) on 29 October based on the usual 14:00 ET release.
- Oil and Strait of Hormuz Headlines, to 3 November 2026: Trump’s pledge runs to the midterms, while the blockade stays in place. 3 Fresh gold rate news lands in gold news today and XAUUSD news.
Gold Rate Today: Quick Answers
What Is the Gold Rate Today in USD?
As of 10:26 (GMT+8) on 9 October 2026, Vantage XAUUSD traded at 4,171.12, and benchmark gold was 0.92% higher on the day at 4,171.03. 1 That is the US gold rate today in dollar terms; for the gold price USD live, see the XAUUSD page.
How Does the Gold Futures Price Compare With Spot?
Futures usually trade a little above spot because they price in carrying costs. At 09:36 (GMT+8) on 8 October, Investing.com showed gold futures at 4,158.30 against spot XAUUSD at 4,134.19. 11
Is There a Gold Price Prediction or XAUUSD Forecast for Today?
Vantage does not publish gold price predictions or an XAUUSD forecast. Instead of an XAUUSD prediction today, here is what markets are pricing: about 82% odds of a Fed hold this month and around 81% for a December hike, as of 9 October. 1 The 14 October CPI print is the next piece of evidence, not a crystal ball.
Risk Picture Into CPI Week
So, back to the puzzle we started with. Gold rose on a de-escalation headline because, in this cycle, the headline appeared to reach gold through oil and the Fed. The read holds while oil and rate pricing keep moving together. It weakens if a Middle East shock lifts gold and oil at the same time, which would suggest haven demand had become the stronger force again.
Gold can move sharply around CPI releases and political headlines, and news that lands outside trading hours can open the market with a gap. A Stop Loss can help limit losses to a planned size, although it cannot guarantee execution at that exact price when markets gap.
Leverage magnifies gains and losses alike on XAUUSD CFDs, and a 1% move in gold has a larger effect on the account balance at higher leverage. Sizing positions in proportion to account equity, so that one position carries only a small percentage of the account at risk, is one way some traders keep a single headline from carrying outsized weight.
Related Reading
RISK WARNING: CFDs are complex financial instruments and carry a high risk of losing money rapidly due to leverage. You should ensure you fully understand the risks involved and carefully consider whether you can afford to take the high risk of losing your money before trading.
Disclaimer: The information is provided for educational purposes only and doesn’t take into account your personal objectives, financial circumstances, or needs. It does not constitute investment advice. We encourage you to seek independent advice if necessary. The information has not been prepared in accordance with legal requirements designed to promote the independence of investment research. No representation or warranty is given as to the accuracy or completeness of any information contained within. This material may contain historical or past performance figures and should not be relied on. Furthermore estimates, forward-looking statements, and forecasts cannot be guaranteed. The information on this site and the products and services offered are not intended for distribution to any person in any country or jurisdiction where such distribution or use would be contrary to local law or regulation.
References
[1] “Gold – Price – Chart – Historical Data – News – Trading Economics” https://tradingeconomics.com/commodity/gold Accessed on 9 October 2026.
[2] “Trump says U.S. will not attack Iran before midterm election – CNBC” https://www.cnbc.com/2026/10/08/iran-war-trump-midterm-election.html Accessed on 9 October 2026.
[3] “Trump: U.S. won’t attack Iran before midterms – Axios” https://www.axios.com/2026/10/08/trump-iran-strikes-midterm-elections Accessed on 9 October 2026.
[4] “United States Dollar – Quote – Chart – Historical Data – News – Trading Economics” https://tradingeconomics.com/united-states/currency Accessed on 9 October 2026.
[5] “FOMC rate decision: Fed hikes for the first time in three years – investingLive” https://investinglive.com/central-banks/fomc-rate-decision-fed-hikes-for-the-first-time-in-three-years/ Accessed on 9 October 2026.
[6] “China’s central bank buys 21 tonnes of gold in September, largest monthly purchase in 3 years – Kitco” https://www.kitco.com/news/article/2026-10-07/chinas-central-bank-buys-21-tonnes-gold-september-largest-monthly-purchase Accessed on 9 October 2026.
[7] “China’s Central Bank Adds Gold in September as Bullion Weakens – Bloomberg” https://www.bloomberg.com/news/articles/2026-10-07/china-s-central-bank-adds-gold-in-september-as-bullion-weakens Accessed on 9 October 2026.
[8] “Gold Trims Losses After Trump’s Iran Strike Delay – Trading Economics” https://tradingeconomics.com/commodity/gold/news/535552 Accessed on 9 October 2026.
[9] “China’s central bank adds to gold reserves for 23rd consecutive month – The Standard” https://www.thestandard.com.hk/finance/article/344814/Chinas-central-bank-adds-to-gold-reserves-for-23rd-consecutive-month Accessed on 9 October 2026.
[10] “Schedule of Releases for the Consumer Price Index – US Bureau of Labor Statistics” https://www.bls.gov/schedule/news_release/cpi.htm Accessed on 9 October 2026.
[11] “Gold holds near nine-week low as Hormuz tensions raise Fed hike bets – Investing.com” https://in.investing.com/news/stock-market-news/gold-holds-near-nineweek-low-as-hormuz-tensions-raise-fed-hike-bets-5623272 Accessed on 9 October 2026.
[12] “Gold slips as dollar firms on Fed minutes, oil prices rise in volatile session – Investing.com” https://in.investing.com/news/commodities-news/gold-holds-gains-as-oil-flows-recover-treasury-yields-ease-5621325 Accessed on 9 October 2026.
[13] “Gold price suffers under oil, yield pressures, Mexico’s silver production weakens in July – Heraeus – Kitco” https://www.kitco.com/news/article/2026-10-05/gold-price-suffers-under-oil-yield-pressures-mexicos-silver-production Accessed on 9 October 2026.
[14] “Gold gains ground as central banks retreat from dollar assets and inflation undermines bonds – Sprott’s Zhu – Kitco” https://www.kitco.com/news/article/2026-10-08/gold-gains-ground-central-banks-retreat-dollar-assets-and-inflation Accessed on 9 October 2026.
The information has been prepared as of the date published and is subject to change thereafter. The information is provided for educational purposes only and doesn't take into account your personal objectives, financial circumstances, or needs. It does not constitute investment advice. We encourage you to seek independent advice if necessary. The information has not been prepared in accordance with legal requirements designed to promote the independence of investment research. No representation or warranty is given as to the accuracy or completeness of any information contained within. This material may contain historical or past performance figures and should not be relied on. Furthermore estimates, forward-looking statements, and forecasts cannot be guaranteed. The information on this site and the products and services offered are not intended for distribution to any person in any country or jurisdiction where such distribution or use would be contrary to local law or regulation.
