


 Login





Why Gold Slipped as 10-Year Yields Hit a 2002 High – XAUUSD CFD Analysis

Vantage Editorial Team >
Vantage Editorial Team >
Vantage is a global, multi-asset broker with a team of in-house writers and market analysts who produce educational and insightful trading content for traders of all levels.
 Updated Mon, 2026 October 5 02:40

- Vantage XAUUSD CFD traded near 4,149 as of 09:43 (GMT+8) on 2 October 2026, below both four-hour moving averages.
- October Fed hike odds fell to roughly 37% from about 70% earlier in the week after softer August PCE data. 3
- The US 10-year Treasury yield touched about 5.34% on 1 October, its highest level since 2002. 3,5
Gold finally got the soft inflation print it had been waiting for, and the XAUUSD price still slipped. August core PCE rose 3.0% against 3.3% expected, 2 yet Vantage XAUUSD CFD traded near 4,149 as of 09:43 (GMT+8) on 2 October 2026.
Call it the week the Fed blinked and the bond market did not. That gap is what this piece unpacks: why long-dated yields, not the Fed’s October decision, appear to be steering gold prices, and what that changes about the risk picture into Friday’s Non-Farm Payrolls (NFP) report.
Gold price today readings come from the Vantage XAUUSD CFD feed on TradingView.
Why Did Gold Slip This Week?
Gold slipped as long-end US Treasury yields kept rising even while Fed hike odds fell. Softer August PCE data cut October hike pricing to about 37%, yet the 10-year yield touched 5.34%, its highest since 2002, lifting the cost of holding non-yielding bullion near 4,149.
| Driver | What Happened | How It Lined Up With Gold |
| October Fed Hike Odds | Fell to about 37% from roughly 70% 3 | Supportive |
| US 10-Year Treasury Yield | Touched about 5.34%, highest since 2002 3,5 | Headwind |
| ISM Prices Paid | Jumped to 77.9 from 71.1 5 | Headwind (inflation pressure) |
| Brent Crude | Rose above $105 on 28 September 4 | Headwind (via yields) |
Table 1: Gold’s drivers as of 09:43 (GMT+8), 2 October 2026. Sources: Kitco, Investrade, Investing.com.
One lever pointed up; three pointed down. The chart shows who won.
XAUUSD Technical Analysis: The 28 September Break Still Sets the Tone
Monday did the damage. Spot gold shed 3.9% to $4,116.60 by 16:47 ET on 28 September amid rising oil and yields. 4 On the XAUUSD chart, that single session broke through the 4,250 to 4,300 shelf that held the prior week.
What followed looks more like a breather than a turnaround. Price lifted from near 4,110 to the 4,200 to 4,215 area on 30 September, then gave ground again in Asia. As of 09:43 (GMT+8) on 2 October, the four-hour candle opened at 4,174.76, dipped to 4,133.83, and sat at 4,149.35.
The averages offer little comfort. At the cut-off, the 50-period moving average sat near 4,232 and the 200-period near 4,385, the first falling steeply since 25 September and the second rolling over after a 22 September peak.
The 14-period RSI on the TradingView setup used for this analysis sank to around 22 on 28 to 29 September, recovered to 41.41 by the cut-off, and sat just under its 43.02 signal line. Out of oversold, yes. Back above 50, no.
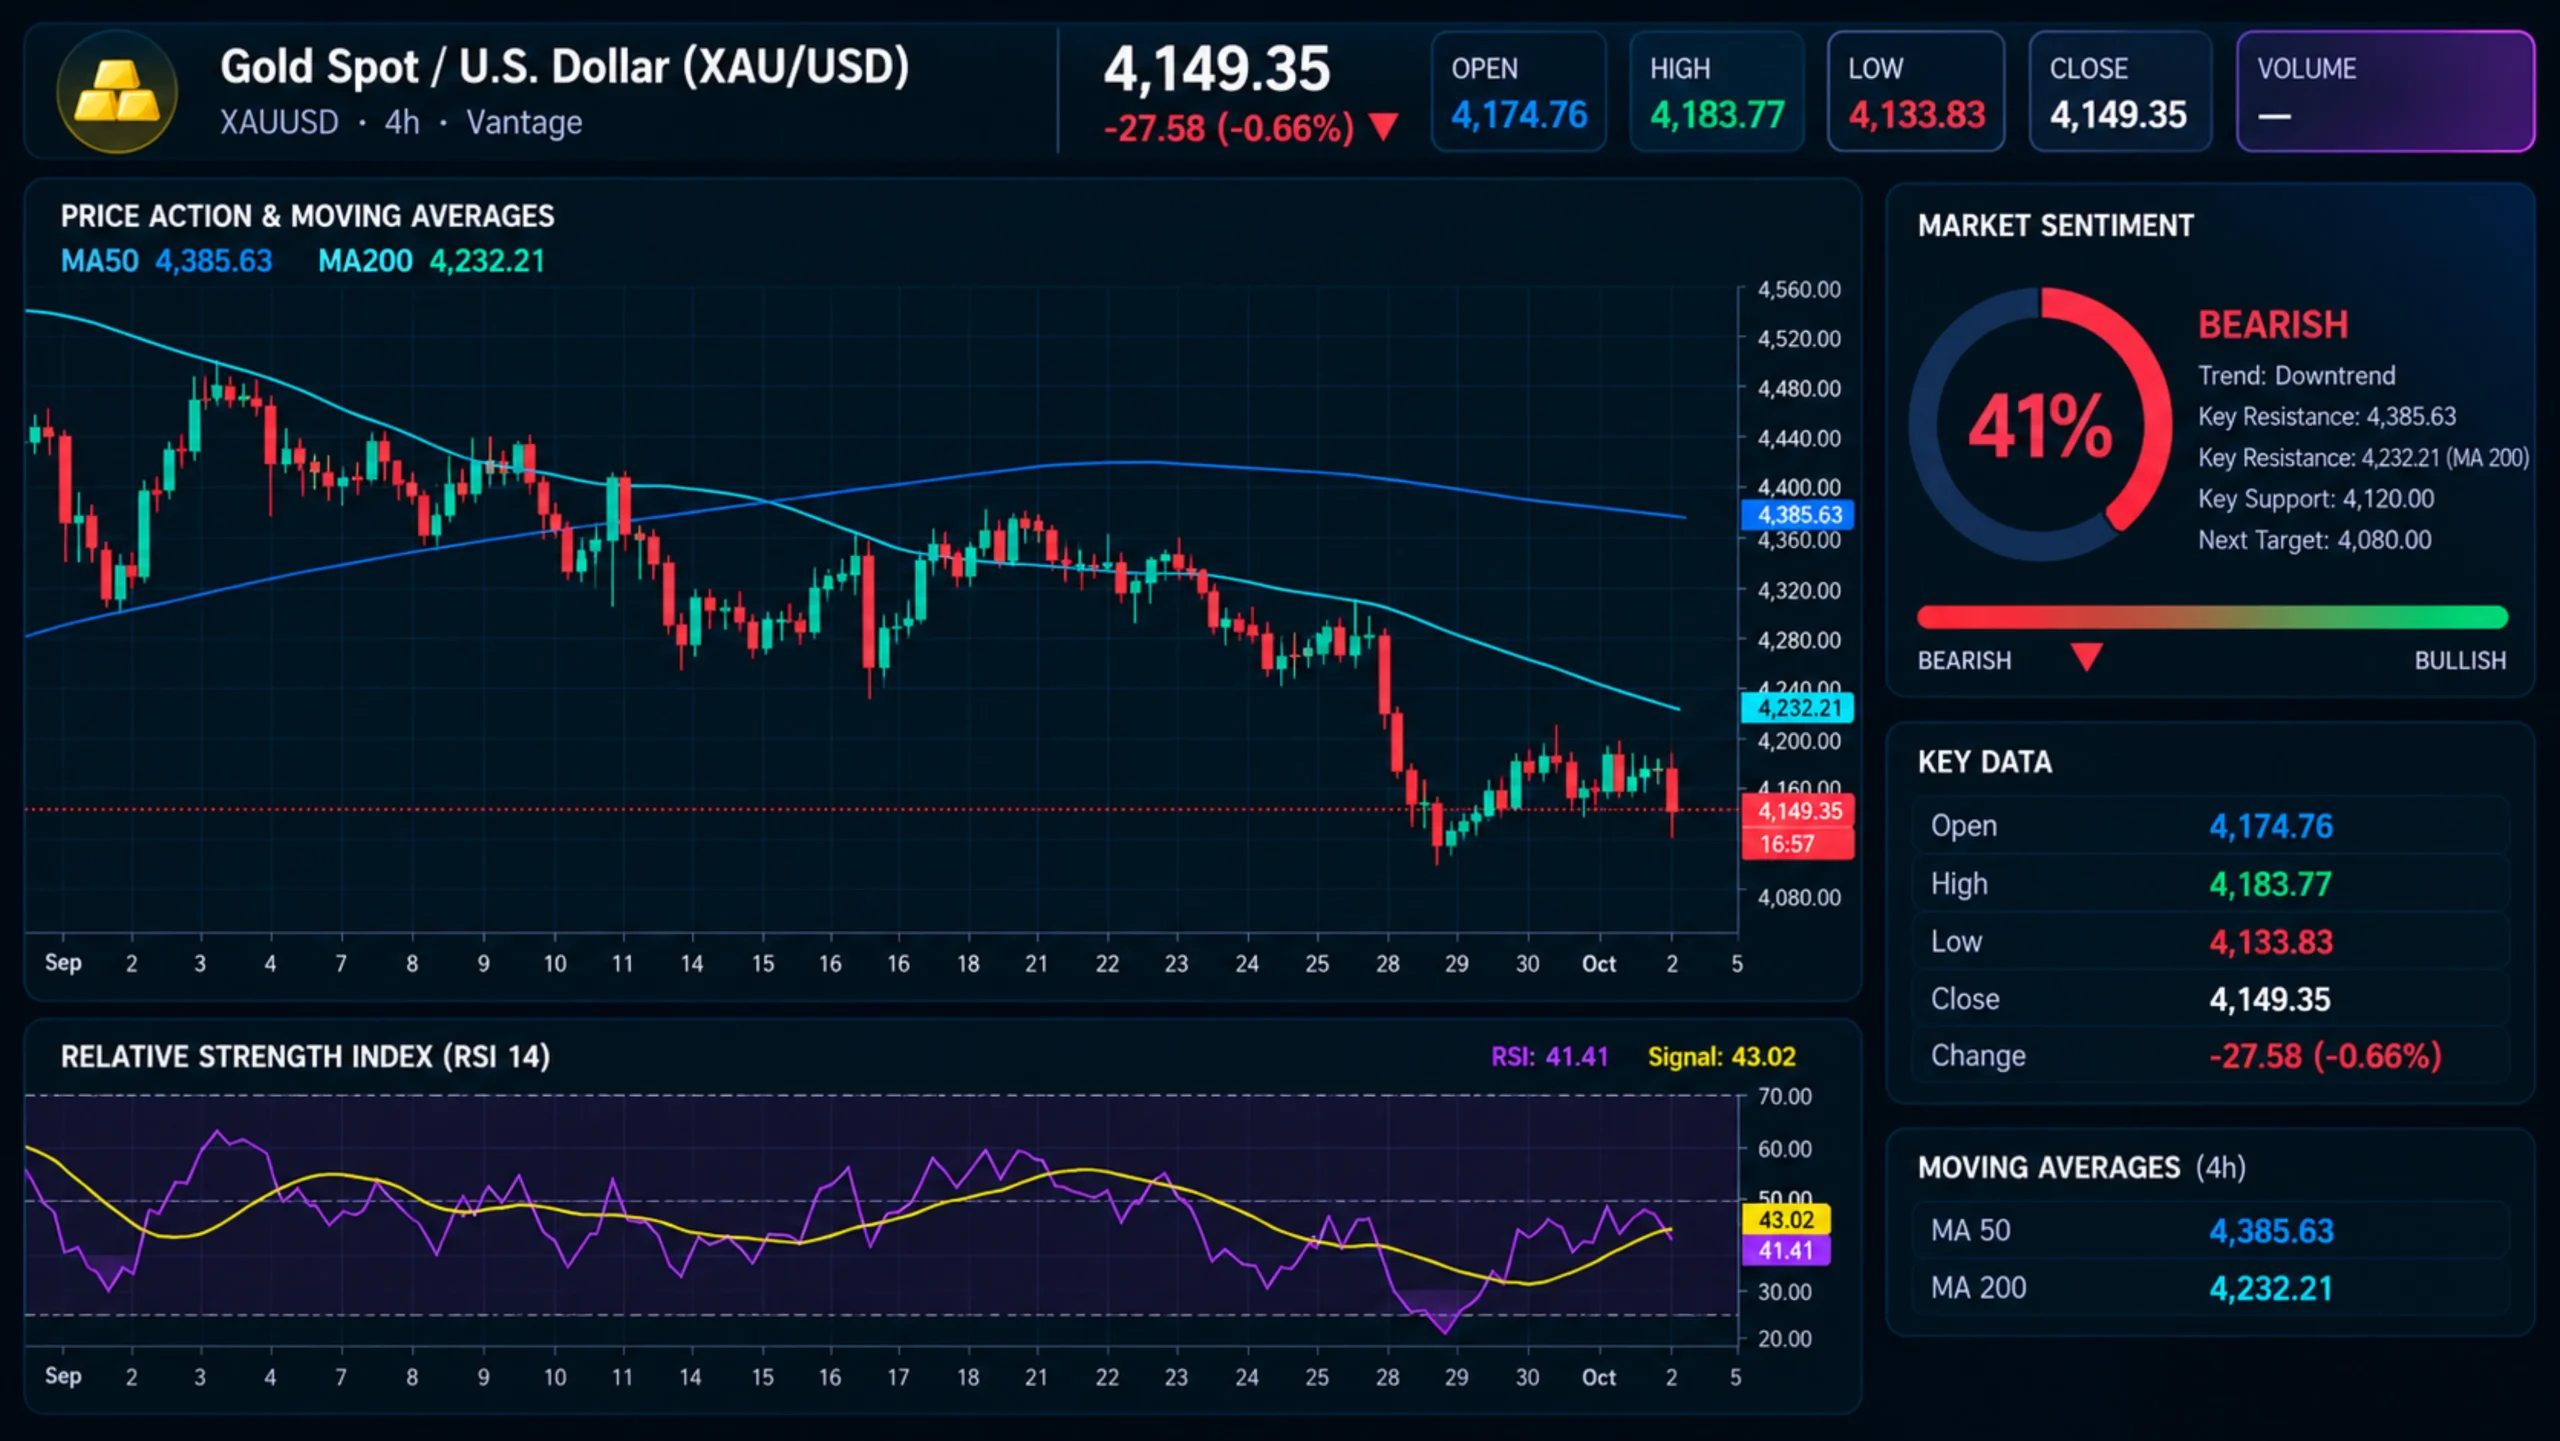
XAUUSD H4 “28 September Break and Falling Moving Averages, Cut-Off 09:43 (GMT+8)” (TradingView, https://www.tradingview.com/symbols/XAUUSD/) Accessed on 2 October 2026. Data indicative, for informational purposes only.
So the XAUUSD TradingView chart shows the damage. The harder question is why softer inflation did not repair it.
Softer PCE Halved Hike Odds, but Yields Kept Climbing
The Federal Reserve raised rates by 25 basis points to 3.75% to 4.00% on 16 September, its first hike since 2023, and signalled another this year. 1 This week’s data became a vote on October.
PCE looked like a vote against. Headline inflation rose 3.4% in August against 3.7% expected, core rose 3.0% against 3.3%, helped by revised government methodology. 2 Still, Navy Federal Credit Union chief economist Heather Long said the figures “show no progress in August on inflation”. 2 Markets still trimmed October hike odds to around 37%. 3
The long end ignored the memo. The 10-year yield touched about 5.34% on 1 October as energy inflation, deficit concerns, and heavy debt issuance weighed on long-dated Treasuries. 3
Independent metals trader Tai Wong called it “a disappointing day for gold”, 10 while UOB Group analysts noted that “elevated real yields continued to cap the bullion’s upside”. 8
The Fed lever moved in gold’s favour. The bond lever moved against it, and the bond lever won.
Why the Bond Market, Not the Fed, Is Setting Gold’s Price
Here is the part the headlines skip. A softer PCE print can trim the odds of one hike, but it does nothing to the supply of long-dated debt or the price of crude, and that is where gold’s pressure has come from.
That flips the usual geopolitics script for gold. On 28 September, Brent rose above $105 after President Trump rejected an Iranian proposal on the Strait of Hormuz and a halt to hostilities, and gold fell 3.9% in the same session. 4 No safe-haven rush, just higher oil sitting alongside higher yields.
This week, the Middle East conflict reached gold through the bond market, not the safe-haven trade.
The Asia session adds a twist. The World Gold Council noted that in the first half of 2026, gold’s rebounds generally came during Asian hours. 9 On 2 October, the Asian morning ran the other way, giving back 0.66% by 09:43 (GMT+8) before US desks had even logged on.
For scale, 4,149.35 at the cut-off sat roughly 26% below the January all-time high of 5,608.35 recorded by Trading Economics. 7
Which makes Friday’s payrolls the next piece of gold news with a direct line into both the Fed and the long end.
XAUUSD Levels Traders Are Watching Into Friday’s NFP Report
These four-hour zones framed the week’s XAUUSD news flow. They are reference levels, not trade signals.
| Level | Zone | What Happened There |
| 4,385 | 200-Period MA (H4) | Rolled over after a 22 September peak |
| 4,232 | 50-Period MA (H4) | Price has stayed below it since the 28 September break |
| 4,200 to 4,215 | 30 September Rebound High | Capped the post-break recovery |
| 4,134 | 2 October Session Low | Asia-session low at the cut-off |
| 4,110 | 28 to 29 September Low | Low of the week on the four-hour chart |
Table 2: Key XAUUSD levels as of 09:43 (GMT+8), 2 October 2026. Source: Vantage XAUUSD CFD on TradingView. Indicative only.
Dates to note:
- US Non-Farm Payrolls, 2 October, 20:30 (GMT+8): Consensus sits near 90,000 against 162,000 in August, with Bank of America at 60,000. 6
- US CPI, 14 October: September inflation, the last CPI print before the 27 to 28 October FOMC meeting.
- US 10-Year Yield, Ongoing: Whether the long end holds near its 2002-era high.
So why could softer inflation not lift gold? As of the cut-off, the Fed was never the only lever; the long end and oil carried more weight. That read holds while the 10-year sits near multi-decade highs, and payrolls test it by moving hike odds and yields together. Follow updates on our gold price news and gold trading pages.
Payrolls sessions tend to squeeze a week of repricing into minutes, and gold has already moved 3.9% in one session this week. 4 A Stop Loss does not prevent a loss; it limits losses to a planned size, though fast markets can fill orders beyond the set level. Gold and US dollar pairs can also stack exposure when yields drive both.
Trading XAUUSD as a CFD involves leverage, which is double-edged: it magnifies losses as well as potential returns relative to the capital committed. Our XAUUSD risk management guide explains how traders size positions as a percentage of account equity, so a single move affects a known share of their account balance.
RISK WARNING: CFDs are complex financial instruments and carry a high risk of losing money rapidly due to leverage. You should ensure you fully understand the risks involved and carefully consider whether you can afford to take the high risk of losing your money before trading.
Disclaimer: The information is provided for educational purposes only and doesn’t take into account your personal objectives, financial circumstances, or needs. It does not constitute investment advice. We encourage you to seek independent advice if necessary. The information has not been prepared in accordance with legal requirements designed to promote the independence of investment research. No representation or warranty is given as to the accuracy or completeness of any information contained within. This material may contain historical or past performance figures and should not be relied on. Furthermore estimates, forward-looking statements, and forecasts cannot be guaranteed. The information on this site and the products and services offered are not intended for distribution to any person in any country or jurisdiction where such distribution or use would be contrary to local law or regulation.
References
[1] “Fed Approves Interest Rate Hike, Signals One More to Come This Year – CNBC” https://www.cnbc.com/2026/09/16/fed-rate-decision-september-2026.html Accessed on 2 October 2026.
[2] “Fed’s Preferred Gauge Showed Core Inflation at 3.0% in August, Much Lighter Than Expected – CNBC” https://www.cnbc.com/2026/09/30/feds-preferred-gauge-showed-core-inflation-at-3point0percent-in-august-much-lighter-than-expected.html Accessed on 2 October 2026.
[3] “Gold, Silver Rise as Jobless Claims Temper PCE-Driven Fed Repricing – Kitco” https://www.kitco.com/news/article/2026-10-01/gold-silver-rise-jobless-claims-temper-pce-driven-fed-repricing-kitco-am Accessed on 2 October 2026.
[4] “Gold Slips 4% to Fall Below $4,200 on Firmer Dollar, Bond Rout, and Fed Hike Bets – Investing.com via Yahoo Finance” https://finance.yahoo.com/markets/commodities/articles/gold-falls-below-4-300-014352852.html Accessed on 2 October 2026.
[5] “Mid-Morning Look: October 01, 2026 – Investrade” https://investrade.com/mid-morning-look-october-01-2026/ Accessed on 2 October 2026.
[6] “US Nonfarm Payrolls Prep – FinancialJuice” https://features.financialjuice.com/2026/09/28/us-nonfarm-payrolls-prep-15/ Accessed on 2 October 2026.
[7] “Gold – Price – Chart – Historical Data – News – Trading Economics” https://tradingeconomics.com/commodity/gold Accessed on 2 October 2026.
[8] “Gold Recovers Above $4,150 as US Yields Retreat Ahead of US September Jobs Data – FXStreet” https://www.fxstreet.com/news/gold-recovers-above-4-150-as-us-yields-retreat-ahead-of-us-september-jobs-data-202610012349 Accessed on 2 October 2026.
[9] “Gold Mid-Year Outlook 2026: Point Break – World Gold Council” https://www.gold.org/goldhub/research/gold-mid-year-outlook-2026 Accessed on 2 October 2026.
[10] “Gold Forecast, News and Analysis (XAU/USD) – FXStreet” https://www.fxstreet.com/commodities/gold Accessed on 2 October 2026.
The information has been prepared as of the date published and is subject to change thereafter. The information is provided for educational purposes only and doesn't take into account your personal objectives, financial circumstances, or needs. It does not constitute investment advice. We encourage you to seek independent advice if necessary. The information has not been prepared in accordance with legal requirements designed to promote the independence of investment research. No representation or warranty is given as to the accuracy or completeness of any information contained within. This material may contain historical or past performance figures and should not be relied on. Furthermore estimates, forward-looking statements, and forecasts cannot be guaranteed. The information on this site and the products and services offered are not intended for distribution to any person in any country or jurisdiction where such distribution or use would be contrary to local law or regulation.
