


 Login





Why the US Dollar Index Rose as Fed Hike Bets Faded – USDX Analysis

Vantage Editorial Team >
Vantage Editorial Team >
Vantage is a global, multi-asset broker with a team of in-house writers and market analysts who produce educational and insightful trading content for traders of all levels.
 Updated Mon, 2026 October 12 02:51

Key Takeaways
- The ICE US Dollar Index reached 102.54 on 5 October 2026, its highest level since April 2025. 1,2
- September payrolls rose by 29,000, and by 5 October CME FedWatch pricing for an October Fed hold stood at 78%, up from 36% a week earlier. 3,4
- As of 10:13 (GMT+8) on 8 October 2026, the Vantage USDX price was 101.926, above its hourly 50-period moving average at 101.868.
The US Dollar Index (USDX) touched 102.54 on Monday 5 October, its highest level since April 2025, just three days after the jobs data that was meant to take the wind out of it. 1,2 September payrolls rose by a meagre 29,000, and by Monday pricing for an October Federal Reserve (Fed) hold stood at 78%, up from 36% a week earlier. 3,4 Rate markets rewrote their October plans. The dollar, it seems, kept its own.
As of 10:13 (GMT+8) on 8 October 2026, the Vantage USDX price stood at 101.926 on the hourly (H1) chart, 0.02% lower on the hourly candle, while the ICE US Dollar Index’s 52-week range ran from 95.55 to 102.54. 1
So which part of the basket did the heavy lifting, and what does the USDX chart say about momentum into US inflation data on 14 October? For anyone with dollar exposure, the snag is that the usual driver stopped explaining the moves, and the action ran on Europe’s clock.
Why the US Dollar Index Rose: The Short Answer
The US Dollar Index hit an 18-month high of 102.54 on 5 October as euro weakness appeared to outweigh fading Fed hike bets. French bond stress pushed the euro, 57.6% of the index, to its weakest since May 2025, while US Treasury yields stayed elevated.
Table 1: What Moved the US Dollar/USDX Index This Week
| Driver | What Happened | How the Index Responded |
| Fed Hike Bets | October hold odds reached 78% from 36% in a week capped by payrolls of 29,000 | Rose regardless, with a December hike still priced |
| Euro Weakness | Euro fell to $1.1161 on 5 October, a 17-month low | Largest basket weight (57.6%) moved in the dollar’s favour |
| French Bond Stress | France-Germany 10-year spread hit 154 bps on 2 October | Dipped on 6 October as spreads narrowed, rose again on 7 October as they widened |
| Long-Dated Yields | US 10-year yield moved above 5.35% on 7 October | Ebury linked higher yields to demand for US assets |
Sources: Reuters,4 BLS,3 Bloomberg,5 Forbes,6 Bankrate.7 Data as of 8 October 2026.
Hike Odds Fell, the Index Rose Anyway
On paper, Friday 2 October should have been the dollar’s quiet weekend. Non-Farm Payrolls (NFP) rose by 29,000 and unemployment edged up to 4.2%, according to the US Bureau of Labor Statistics (BLS). 3 The FactSet median estimate was 90,000, so the headline missed by about two-thirds. 8
Brown Brothers Harriman (BBH) wrote that the soft report “took some steam out of the USD rally”. 9 Fair enough. Yet two details kept the US dollar standing.
First, in market pricing the next Federal Reserve hike was postponed, not cancelled. Traders still priced a December move and two more in the first half of 2027, Reuters reported, 4 and the Fed had already lifted its policy rate to a 3.75% to 4.00% range on 16 September. 10
Second, long-dated yields kept marching. The 10-year Treasury yield moved above 5.35% on 7 October, its highest since 2002, Forbes reported. 6 Mike Sanders, head of fixed income at Madison Investments, told CNBC the climb “can no longer be attributed simply to concerns over the deficit”. 11
That explains why the index did not fall. It does not explain why it hit an 18-month high.
The Euro Did the Heavy Lifting
Here is the detail that often gets lost in the headlines: the euro carries a 57.6% weight in the USDX index, with the yen at 13.6% and sterling at 11.9%. 7 When EURUSD slides, the dollar index rises almost by arithmetic.
And the euro had plenty to slide on. The gap between French and German 10-year yields in the bond market hit 154 basis points (bps) on 2 October, on course for its widest since 2011, Bloomberg reported. 5 By Monday’s Asian session, the euro had sunk to $1.1161, its weakest since May 2025. 4
Line that up against the USDX chart and the pattern is hard to miss. The Vantage USDX price jumped toward 102.30 in Monday’s Asian session as the euro hit that low. It dipped near 101.50 on 6 October after French spreads had narrowed for two days, then climbed back to about 102.25 on 7 October as the spread widened again and the euro slipped 0.47%. 13
That is our visual read, not a formal correlation study, and it sets aside the other 42.4% of the basket as well as the pull from Treasury yields. Still, the euro and the spread lined up with the index’s biggest hourly moves.
For most of this week, the US Dollar Index appeared to trade less like a verdict on the Fed and more like a gauge of French bond stress.
Ebury’s Matthew Ryan added a second tailwind, telling Reuters that higher Treasury yields and a global debt slide were both drawing money into the greenback. 4
If the euro did the lifting, is the USDX chart still showing the demand behind it?
USDX Chart: Price Held, Momentum Cooled
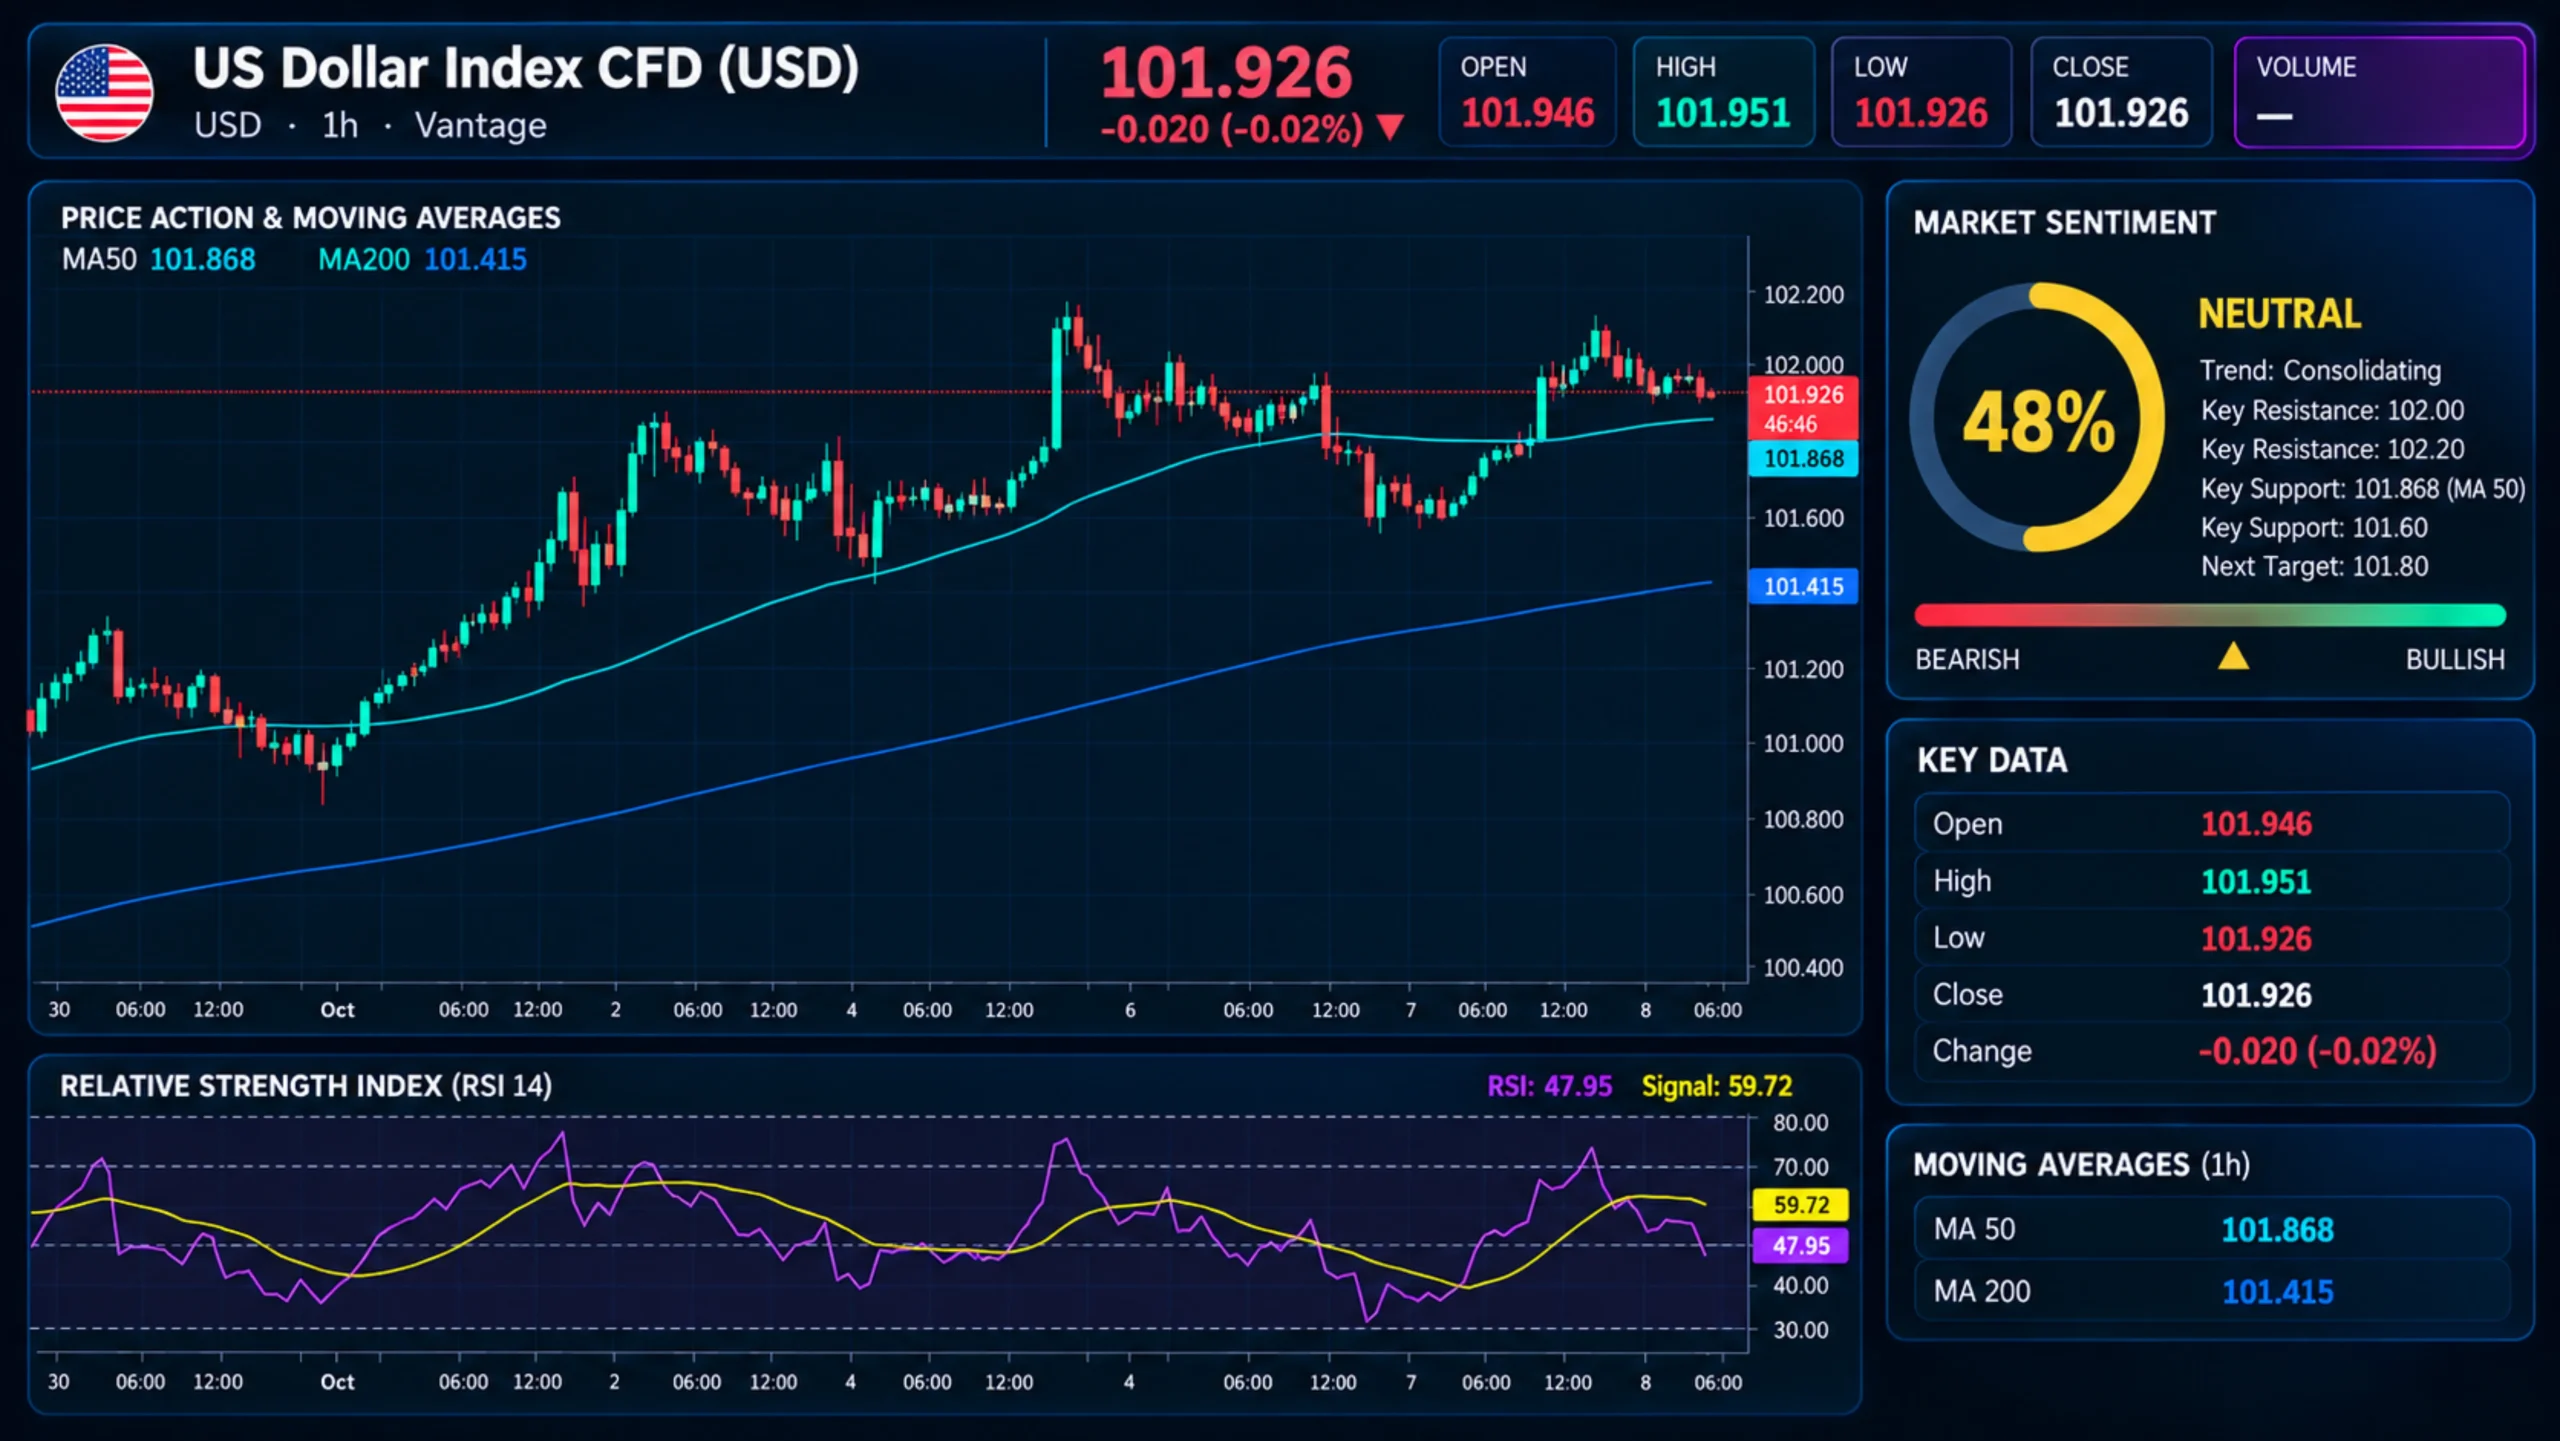
If you have had the USDX chart live on screen this week, the climb was hard to miss: the index rose from a wick low near 100.75 on 30 September to a high near 102.30 on 5 October, roughly 1.5%. At the cut-off it sat above its 50-period moving average (MA) at 101.868 and its rising 200-period MA at 101.415, though the 50-period MA has flattened since 6 October: an hourly trend that has lost its slope, if not its footing.
Momentum tells a quieter story. The Relative Strength Index (RSI) on the TradingView setup used for this analysis read 47.95 at the cut-off, below the 50 midline and its own signal line at 59.72. Its peaks have stepped down like a staircase, from roughly 79 on 1 October to 76 on 5 October and 74 on 7 October, even as price held near its highs.
A housekeeping note for anyone checking the US Dollar Index today: Vantage’s hourly high near 102.30 compares with the ICE cash index’s 102.54, 1 and ICE traded near 102.25 on 8 October. 14 Same name, about a quarter of a point apart, so it is worth noting which one a headline quotes.
Table 2: US Dollar Index Current Levels Traders Are Watching, as of 10:13 (GMT+8), 8 October 2026
| Level | Area | What the H1 Chart Shows |
| Upper Reference Area | 102.25 to 102.30 | Highs on 5 October and 7 October |
| Cut-Off Price | 101.926 | Last print at 10:13 (GMT+8) |
| Reference 1 | 101.868 | H1 50-period MA |
| Reference 2 | 101.45 to 101.55 | Lows on 2 October and 6 October |
| Reference 3 | 101.415 | H1 200-period MA |
| Reference 4 | Near 100.75 | Wick low on 30 September |
Levels are read from the TradingView setup used for this analysis on the Vantage USDX feed, as of 10:13 (GMT+8) on 8 October 2026. Indicative only.
The chart sets the reference points. The calendar decides which driver gets tested next.
Catalysts on the GMT+8 Clock
- 30-Year Treasury Auction, 8 October (Early 9 October in GMT+8): A gauge of appetite for long-dated US debt after this week’s climb in long-end yields. 13
- US Consumer Price Index (CPI), 14 October, 20:30 (GMT+8): The September print is the next test of October Fed pricing, which stood at a 78% chance of a hold on 5 October. 15
- French-German Bond Spread, Daily: A narrowing spread alongside a steady index would weaken the euro-led read, while the read holds as long as the two keep moving in step.
- Federal Open Market Committee (FOMC) Decision, 29 October, 02:00 (GMT+8): The statement from the 27 to 28 October meeting lands overnight in GMT+8, before the Asian open. 16
Before those dates arrive, a few quick answers on the index itself.
Quick Answers on the Dollar Index
What Is the Ticker Symbol for the US Dollar Index?
The US Dollar Index ticker most data providers use is DXY, for the ICE index also branded USDX. 7,17 The DXY index, USDX, and the US Dollar Index DXY quote describe one basket: one index, several nicknames.
How Is the Dollar Index (USDX) Calculated?
It is a weighted geometric average of the dollar against six currencies: the euro, yen, sterling, Canadian dollar, Swedish krona, and Swiss franc. 7 The euro’s 57.6% share is why euro moves can outweigh US data on some days, as they appeared to this week.
Do USDX Futures Trade at the Same Price as the Index?
Not necessarily. USDX futures trade on ICE for about 21 hours a day, 7 and like most futures they can price away from the cash index, partly reflecting interest-rate differences until expiry. The Vantage USDX price also sat below the ICE cash index this week, so levels are best compared like for like.
Risk Picture for USDX Traders
Last Friday’s jobs report knocked out the dollar’s most-quoted support, and the index climbed to an 18-month high anyway, with the euro’s 57.6% weight and French bond stress appearing to carry the move. US CPI on 14 October tests which driver it answers to next; our US dollar index news page tracks each update.
This week’s biggest swings landed in Asian and European hours. A Stop Loss order sets in advance the price at which a position closes, which can limit losses to a planned size; in fast or gapping markets, though, it may be filled at a worse price than the level set.
Trading the index through Contracts for Difference (CFDs) involves leverage, which magnifies losses as well as gains. At 1:10, a 0.50% move in the index equals about a 5% change relative to the margin committed, and at 1:100 about 50%; the 6 October dip was roughly 0.5% from peak to trough. Position sizing relative to account equity is one way traders keep that exposure proportionate.
Related Reading
RISK WARNING: CFDs are complex financial instruments and carry a high risk of losing money rapidly due to leverage. You should ensure you fully understand the risks involved and carefully consider whether you can afford to take the high risk of losing your money before trading.
Disclaimer: The information is provided for educational purposes only and doesn’t take into account your personal objectives, financial circumstances, or needs. It does not constitute investment advice. We encourage you to seek independent advice if necessary. The information has not been prepared in accordance with legal requirements designed to promote the independence of investment research. No representation or warranty is given as to the accuracy or completeness of any information contained within. This material may contain historical or past performance figures and should not be relied on. Furthermore estimates, forward-looking statements, and forecasts cannot be guaranteed. The information on this site and the products and services offered are not intended for distribution to any person in any country or jurisdiction where such distribution or use would be contrary to local law or regulation.
References
[1] “ICE U.S. Dollar Index (.DXY) Quote – CNBC” https://www.cnbc.com/quotes/.DXY Accessed on 8 October 2026.
[2] “Dollar Gains as Euro Slides – Trading Economics” https://tradingeconomics.com/united-states/currency/news/589353 Accessed on 8 October 2026.
[3] “The Employment Situation: September 2026 – US Bureau of Labor Statistics” https://www.bls.gov/news.release/archives/empsit_10022026.htm Accessed on 8 October 2026.
[4] “Euro Sinks to 17-Month Low as French Fiscal Woes Spur Contagion Fears – Reuters via WMBD” https://wmbdradio.com/2026/10/04/dollar-holds-firm-as-french-fiscal-woes-keep-euro-on-back-foot/ Accessed on 8 October 2026.
[5] “French Bond Risk Hits Euro-Crisis Levels as Fiscal Concerns Grow – Bloomberg” https://www.bloomberg.com/news/articles/2026-10-02/europe-s-bond-spread-blowout-prompts-bets-on-fewer-ecb-hikes Accessed on 8 October 2026.
[6] “Why the 10-Year Treasury Yield Just Hit a 24-Year High – Forbes” https://www.forbes.com/sites/garthfriesen/2026/10/07/why-the-10-year-treasury-yield-just-hit-a-24-year-high/ Accessed on 8 October 2026.
[7] “What Is the US Dollar Index (USDX)? – Bankrate” https://www.bankrate.com/investing/what-is-us-dollar-index-usdx/ Accessed on 8 October 2026.
[8] “Total Nonfarm Payrolls for September 2026 Are Projected to Rise By 90,000 – FactSet Insight” https://insight.factset.com/total-nonfarm-payrolls-for-september-2026-are-projected-to-rise-by-90000 Accessed on 8 October 2026.
[9] “Drivers for the Week of October 5, 2026 – Brown Brothers Harriman” https://www.bbh.com/us/en/insights/blog/mind-on-the-markets/Drivers-for-the-Week-of-October-5-2026.html Accessed on 8 October 2026.
[10] “Federal Reserve Issues FOMC Statement, 16 September 2026 – Board of Governors of the Federal Reserve System” https://www.federalreserve.gov/newsevents/pressreleases/monetary20260916a.htm Accessed on 8 October 2026.
[11] “30-Year Treasury Yield Hits Highest Level Since 2004 as Bond Market Rout Continues – CNBC” https://www.cnbc.com/2026/09/24/us-treasury-yields-bonds-fed-inflation.html Accessed on 8 October 2026.
[12] “Euro Hits 17-Month Low as French Debt Fears Mount and Spain Heads for Snap Election – Euronews” https://www.euronews.com/2026/10/05/euro-hits-17-month-low-as-french-debt-fears-mount-and-spain-heads-for-snap-election Accessed on 8 October 2026.
[13] “European Shares, Euro Fall as Energy Shock, Fiscal Worries Bite – MarketScreener” https://www.marketscreener.com/news/european-shares-euro-fall-as-energy-shock-fiscal-worries-bite-ce785dd9d08bf72d Accessed on 8 October 2026.
[14] “US Dollar Index Historical Data (DXY) – Investing.com” https://www.investing.com/indices/usdollar-historical-data Accessed on 8 October 2026.
[15] “Schedule of Releases for the Consumer Price Index – US Bureau of Labor Statistics” https://www.bls.gov/schedule/news_release/cpi.htm Accessed on 8 October 2026.
[16] “Meeting Calendars and Information – Board of Governors of the Federal Reserve System” https://www.federalreserve.gov/monetarypolicy/fomccalendars.htm Accessed on 8 October 2026.
[17] “US Dollar Index (DXY) – Investing.com” https://www.investing.com/indices/usdollar Accessed on 8 October 2026.
The information has been prepared as of the date published and is subject to change thereafter. The information is provided for educational purposes only and doesn't take into account your personal objectives, financial circumstances, or needs. It does not constitute investment advice. We encourage you to seek independent advice if necessary. The information has not been prepared in accordance with legal requirements designed to promote the independence of investment research. No representation or warranty is given as to the accuracy or completeness of any information contained within. This material may contain historical or past performance figures and should not be relied on. Furthermore estimates, forward-looking statements, and forecasts cannot be guaranteed. The information on this site and the products and services offered are not intended for distribution to any person in any country or jurisdiction where such distribution or use would be contrary to local law or regulation.
