
CFDs and Spread Bets are complex instruments and come with a high risk of losing money rapidly due to leverage. 72.65% of retail investor accounts lose money when trading CFDs and Spread Bets with this provider. You should consider whether you understand how CFDs and Spread Bets work and whether you can afford to take the high risk of losing your money.


 Login


SEARCH
-
Search query too short. Please enter a full word or phrase.
-

Keywords
Popular Search


SEARCH
-
Search query too short. Please enter a full word or phrase.
-
Keywords
Popular Search



 Market Analysis Daily Analysis Brent Crude Oil Price Pressured as Midterms Lifted Iran Peace Bets – UKOUSD and USOUSD Analysis
Brent Crude Oil NewsCommoditiesCommodities NewsCommodity Market NewsCrude Oil News TodayEconomic News TodayIran NewsOil NewsOil Price News TodayTechnical AnalysisVantage NewsWTI Crude OIl News
Brent Crude Oil Price Pressured as Midterms Lifted Iran Peace Bets – UKOUSD and USOUSD Analysis

Vantage Editorial Team >
10 November 2026 | Daily Analysis | 14 min read
Vantage Editorial Team >
Vantage is a global, multi-asset broker with a team of in-house writers and market analysts who produce educational and insightful trading content for traders of all levels.

Key Takeaways
- Brent fell from near $118.70 on 30 October to near $97.00 on 5 November, then traded at $102.81 as of 10:10 (GMT+8) on 6 November 2026.
- WTI moved from near $105.50 to near $87.10 over the same stretch and traded at $91.71 at the same cut-off.
- The Brent vs WTI gap narrowed from about $12.00 to about $9.90, then widened back to $11.10.
The Brent crude oil price lost about 18% between the 30 October high and the 5 November low on the Vantage UKOUSD feed. A drop that size usually means barrels are coming back. These were not: Iran reported three more tankers attacked in the Strait of Hormuz on Thursday.1
As of 02:10 (UTC) / 10:10 (GMT+8) on 6 November 2026, Brent traded at $102.81 and WTI crude oil at $91.71 on the Vantage feed, both roughly 12% below the previous Friday’s close. Front-month futures carried 52-week ranges of $58.72 to $126.41 for Brent and $54.98 to $117.63 for WTI.2,3
So the market priced a peace deal before the shipping data showed one. We read that gap as the most useful thing on the screen this week: it explains where oil prices today sit, why Brent fell further than WTI and then recovered faster, and what tests the read before OPEC+ meets on 29 November.4
Brent Crude Oil Price Today: The Quick Answer
Brent crude fell about 18% from its 30 October high as US midterm results lifted bets on a Middle East settlement, then recovered about 6% as Hormuz tanker attacks continued. WTI tracked it, while the Brent-WTI gap narrowed and widened again: some conflict premium remains.
Brent vs WTI This Week at a Glance
| Measure | Brent (UKOUSD) | WTI (USOUSD) |
| Benchmark Basis | Seaborne, North Sea crude | Cushing, Oklahoma delivery |
| High, 30 October | Near $118.70 | Near $105.50 |
| Low, 5 November | Near $97.00 | Near $87.10 |
| Drop From High to Low | About 18% | About 17% |
| Price at Cut-Off | $102.81 | $91.71 |
| Recovery From Low | About 6% | About 5% |
| Futures Settlement, 4 November | $94.62 | $88.12 |
| One-Hour 50-Period MA | $102.51 | $91.57 |
| One-Hour 200-Period MA | $111.57 | $98.88 |
| RSI (14), One-Hour | 65.14 | 61.39 |
Cash prices, moving averages and RSI from the Vantage UKOUSD and USOUSD feeds on TradingView, as of 10:10 (GMT+8) on 6 November 2026; futures settlements from Investing.com.2,3 Data indicative, for informational purposes only.
Housekeeping note: the Vantage feed tracks cash prices, while wire reports quote Brent futures and crude oil WTI futures tied to a contract month, so the numbers never quite match.
How the Midterms Drained the Oil Premium

Oil walked into the week carrying a premium: crude gained more than 10% in October as the market priced the risk of escalation after the US midterms, CNBC reported.5
Monday pulled the first thread. Iranian President Masoud Pezeshkian said the government had authority for peace talks, and Qatari mediators travelled to Tehran. UBS analyst Giovanni Staunovo described a market reacting with “extreme sensitivity to every headline out of the Middle East”, while Raymond James analyst Pavel Molchanov urged scepticism after earlier false starts.6
Tuesday’s vote did the rest. Democrats took both the Senate and the House,1 and on Wednesday Brent crude oil futures settled at $94.62, down 8.67% on the day.2 In futures, WTI crude oil settled at $88.12, and its three-day drop of about 15% was the steepest since November 2021, Yahoo Finance reported.7
Bloomberg linked the market sell-off to the view that a Democratic Congress may constrain US military action, with front-month futures heading for their biggest weekly loss since April 2020.8 That was the crude oil news most people read. The detail most coverage skipped sat in the spread.
Brent vs WTI: The Spread Moved First
Brent prices much of the seaborne crude that moves through the Gulf; WTI is priced at Cushing, Oklahoma.9 When Middle East shipping risk shifts, Brent tends to feel it first.
On the Vantage one-hour charts, the Brent vs WTI gap sat around $12.00 at the end of October. Near Thursday’s lows it had narrowed to roughly $9.90, as Brent gave up about $21.70 against about $18.40 for WTI. By the cut-off, it was back at $11.10.
Put simply, the market pulled about $2 of Gulf risk out of Brent as peace bets peaked, then put a little over half back. If the spread is a thermometer for that risk, it cooled sharply on Wednesday and has been warming since.
The Brent vs WTI gap gave up about $2 as peace bets peaked and has recovered a little over half of it: the conflict premium shrank, but it did not vanish.
The reason sits on the water. UKMTO data suggested tanker attacks were running near a record pace, and ANZ senior commodity strategist Daniel Hynes put Hormuz flows at under 60% of capacity, noting that crude “rebounded as traders viewed Wednesday’s selloff as overdone”.1 ADNOC chief executive Sultan Al Jaber said the world has drawn nearly 1 billion barrels from inventories since the disruption began.6
Our Brent crude oil news and WTI crude oil news pages track both legs. The spread says some risk is still priced; the charts show how much ground each leg has recovered.
What the Brent Crude Oil Price Chart Shows
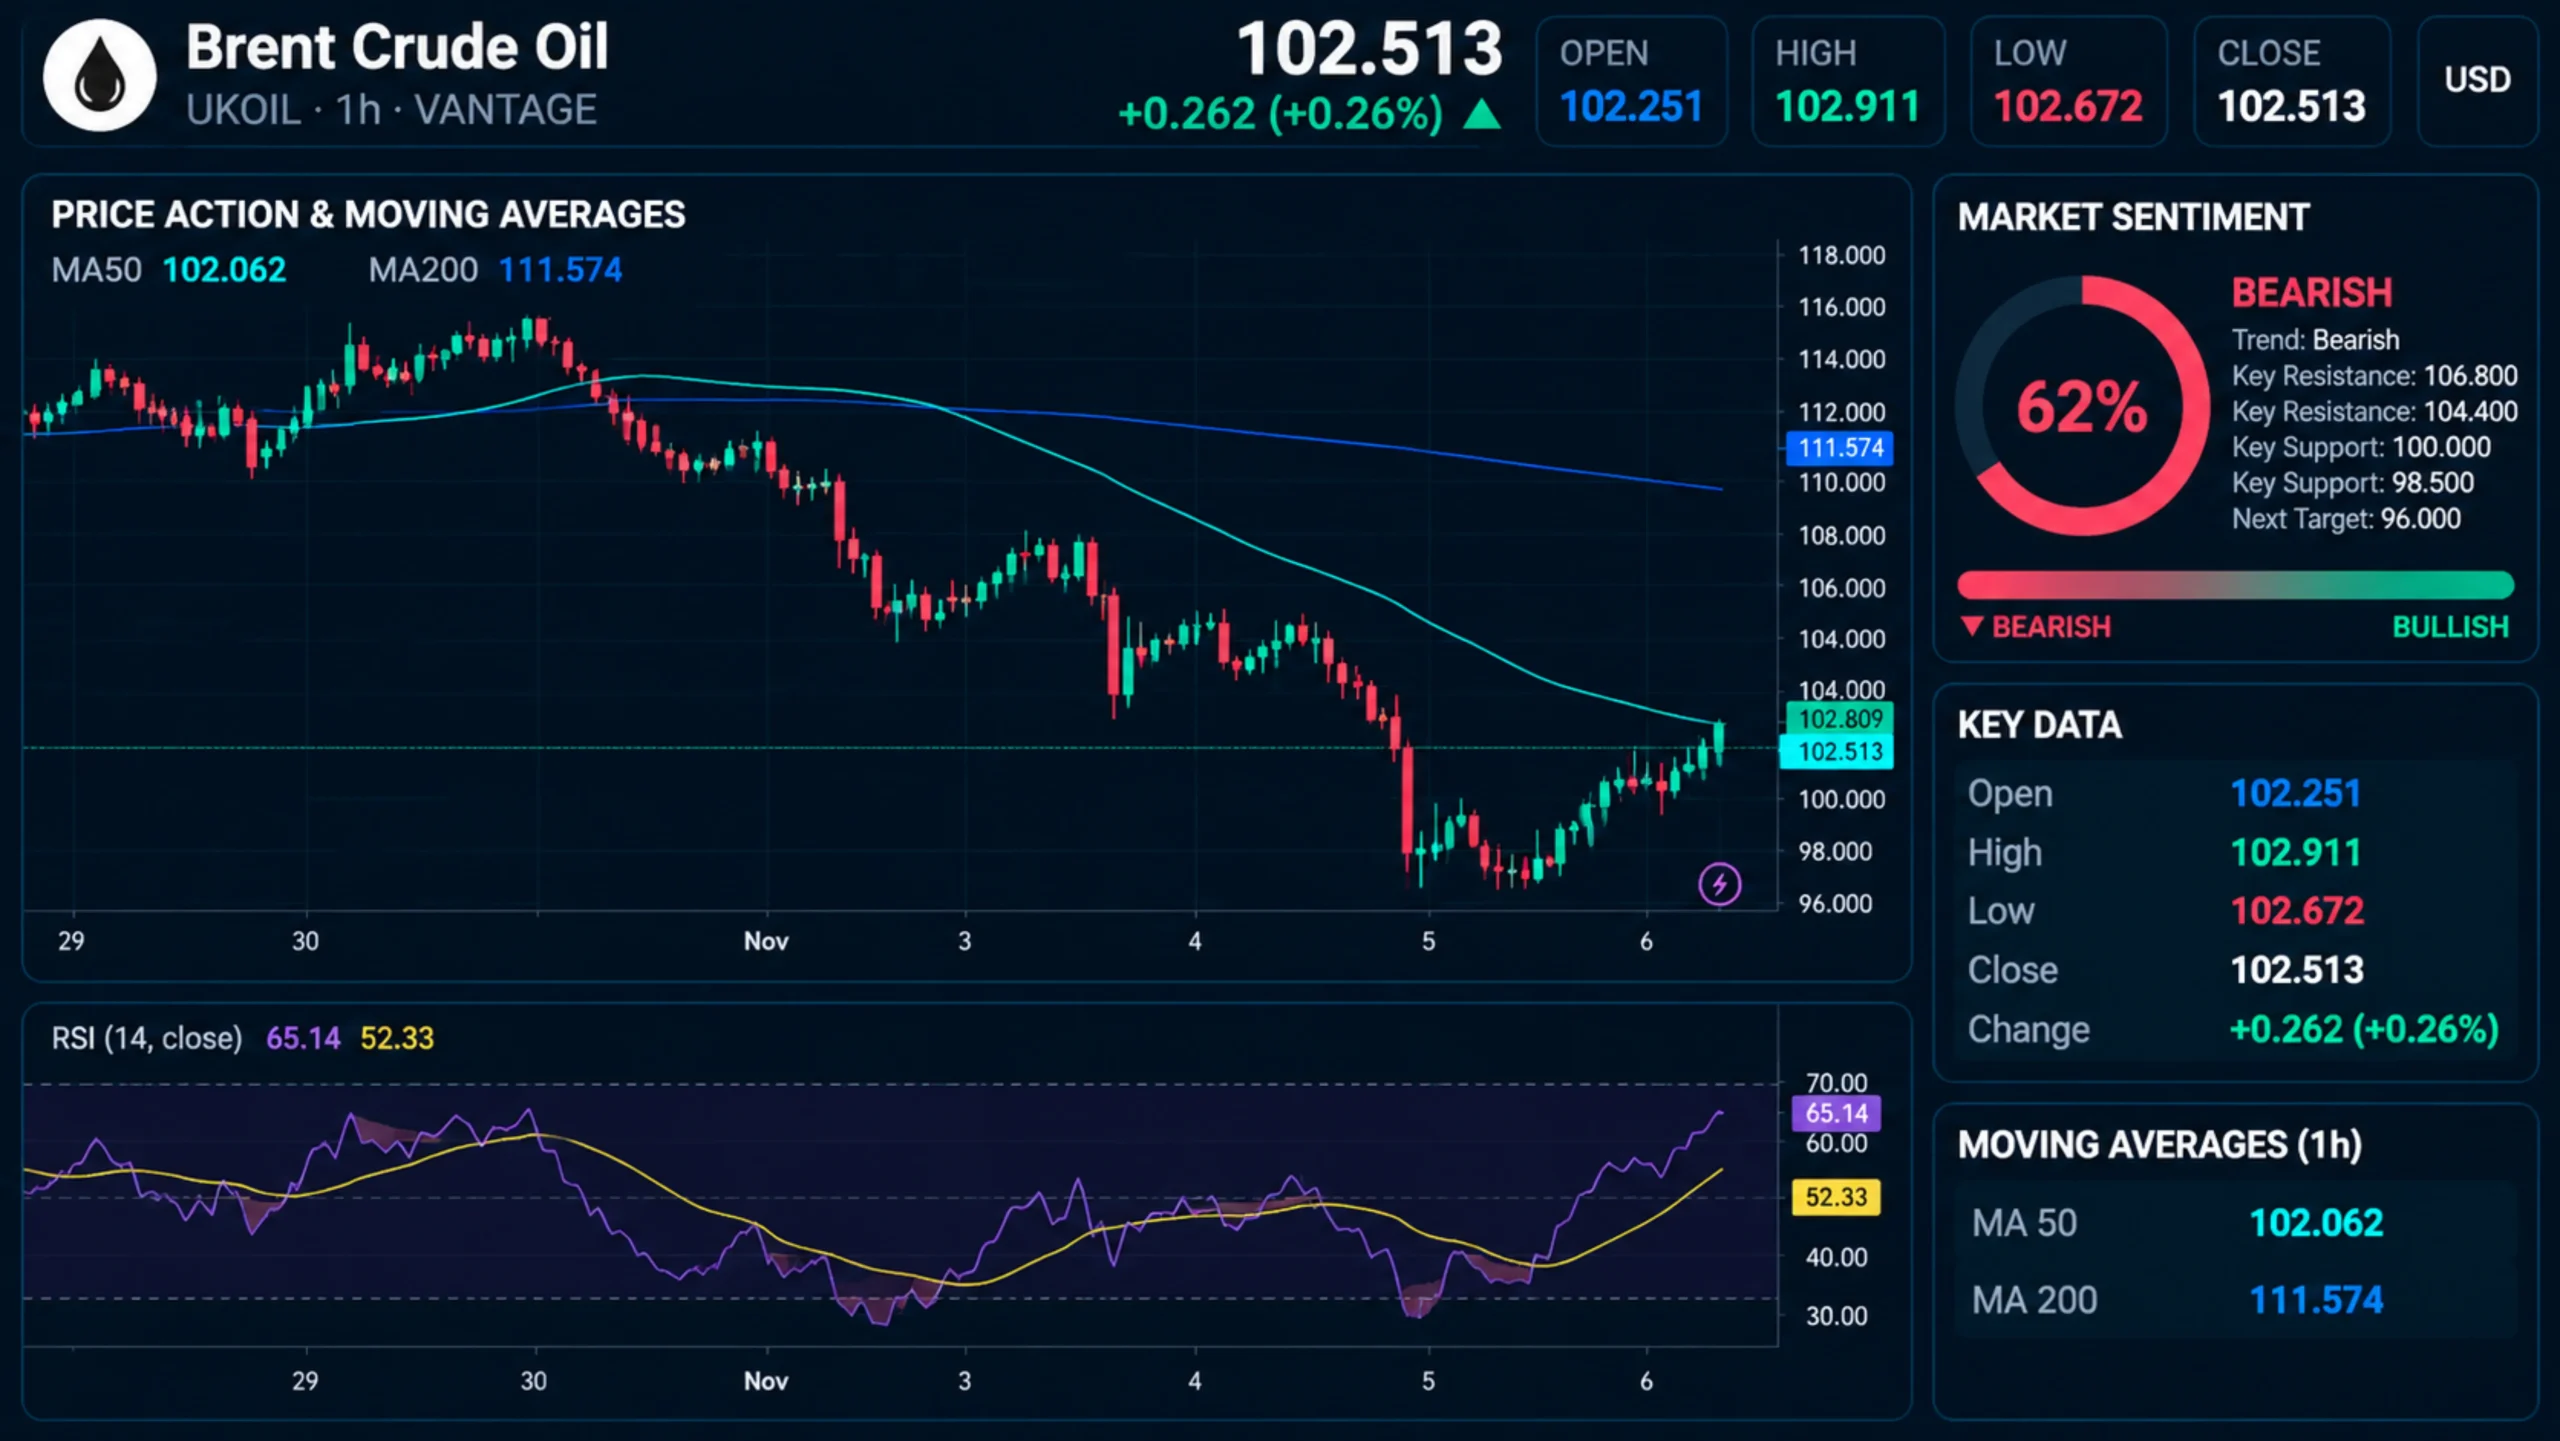
Brent set a low near $97.00 on 5 November, then climbed a staircase of higher lows to $102.81, just above the one-hour 50-period moving average at $102.51 for the first sustained stretch since 2 November. The 200-period average sat at $111.57, about 8.5% higher. Slow averages are slow on purpose.
The 14-period RSI dropped below 30 on 2 November and again from 4 to 5 November, reaching the mid-teens, per the TradingView setup used for this analysis. It read 65.14 at the cut-off, above its 52.33 signal line and below 70: from the basement to the upper floors in about 36 hours.
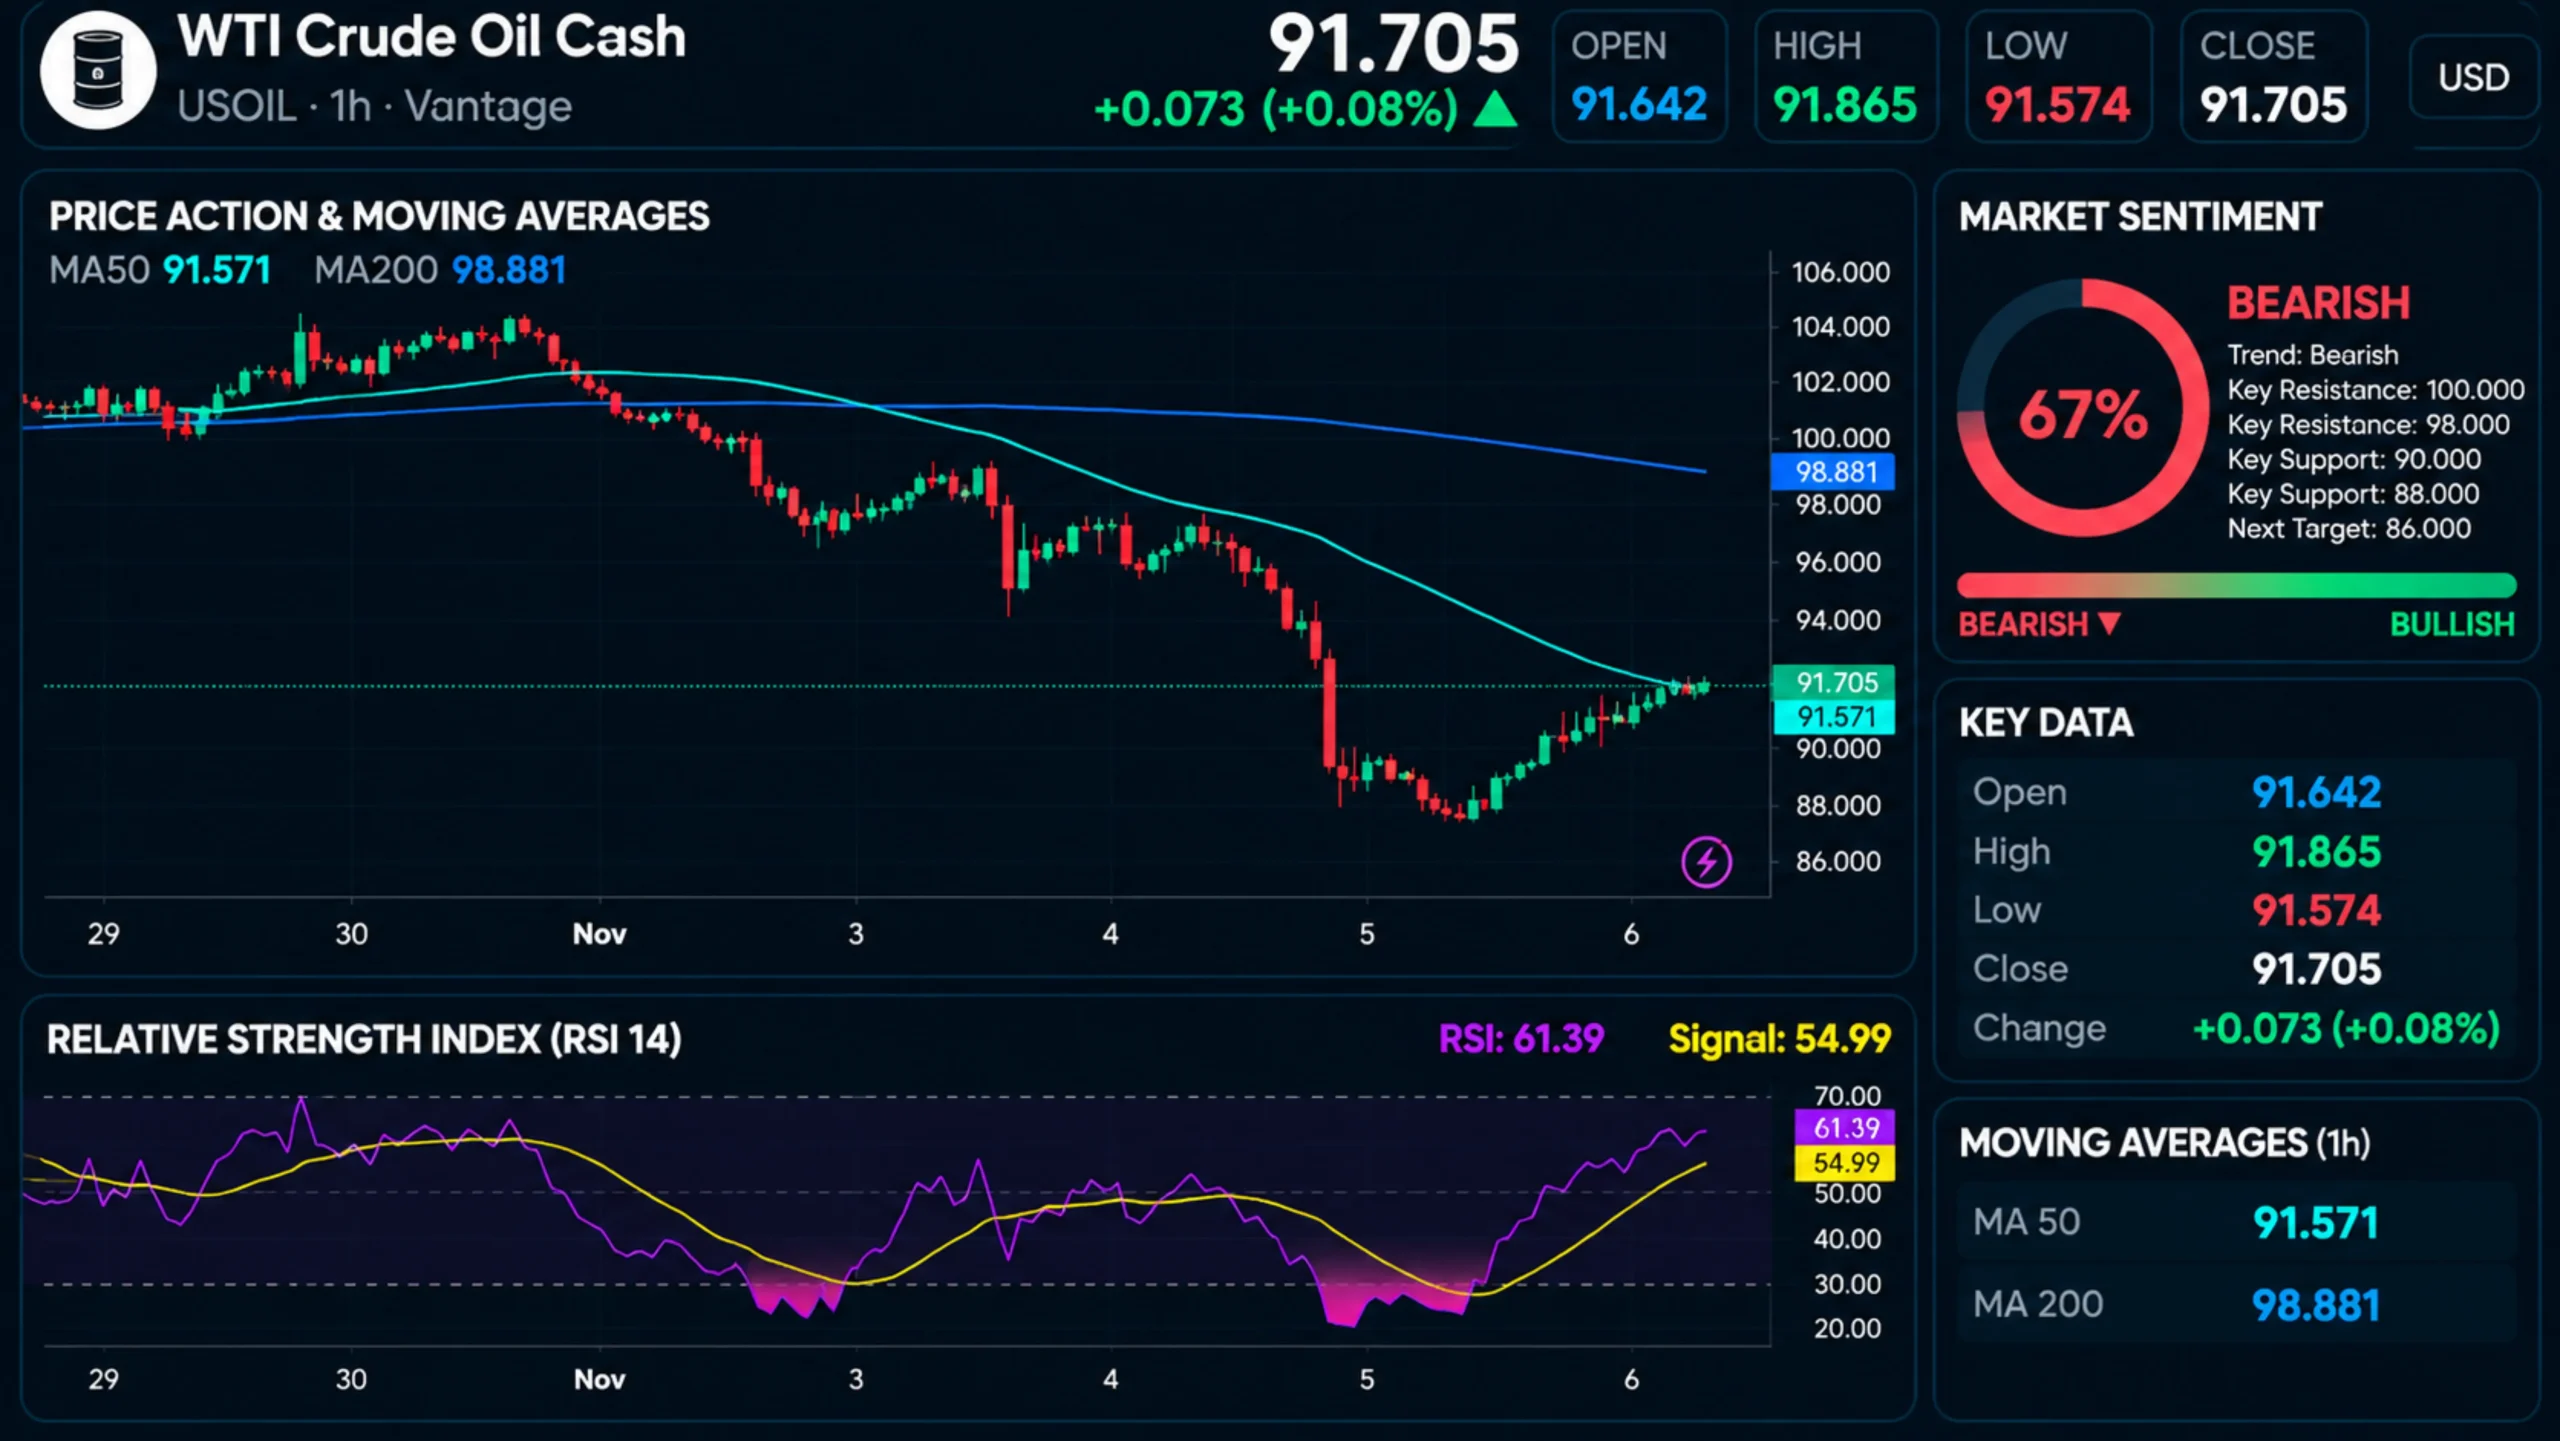
WTI crude followed on a smaller scale. The WTI oil price set a low near $87.10 on 5 November, and the current WTI crude oil price of $91.71 at the cut-off sits a touch above the 50-period average at $91.57, with the 200-period at $98.88. RSI (14) read 61.39 against a 54.99 signal line.
The momentum gap, 65.14 against 61.39, matches the spread widening since Thursday. Both have reclaimed the fast average; neither is near the slow one. First, the questions we hear most.
Brent and WTI Questions Answered
What Is Brent Crude Oil, and What Is WTI Crude Oil?
Brent crude oil is the international benchmark, drawn from North Sea fields. West Texas Intermediate (WTI) is the US benchmark: WTI crude oil futures are delivered at Cushing, Oklahoma, and each contract covers 1,000 barrels.9
What Is the Brent Price Today and the WTI Price Today?
As of 10:10 (GMT+8) on 6 November 2026, the Brent crude price today on the Vantage feed was $102.81 and the WTI crude oil price today was $91.71. Oil price news today carries running updates on the crude oil price today.
Where Can I Follow the Brent Crude Oil Price Live?
The Brent crude oil price live and the WTI crude oil price live update on the Vantage instrument pages linked above, and crude oil news today tracks what moves them. Any oil price live feed can gap at a reopen.
Is This a Brent Oil Forecast or an Oil Price Prediction?
No. It is not a Brent oil forecast, Brent crude forecast, WTI forecast, or crude oil forecast. It records what WTI crude oil prices and the Brent oil price have done, and the levels traders are watching, rather than an oil price forecast.
Five Dates That Test the Read
None of these dates is short of opinions.
- US Nonfarm Payrolls, 6 November 2026: October jobs data at 08:30 (ET) / 21:30 (GMT+8).11
- US Consumer Price Index, 10 November 2026: October inflation at 08:30 (ET) / 21:30 (GMT+8).11
- EIA Weekly Petroleum Status Report, Week of 9 November: Normally Wednesday at 10:30 (ET) / 23:30 (GMT+8); the 11 November Veterans Day holiday may move it12
- Strait of Hormuz Incident Reports, Ongoing: Attack reports coincided with the spread widening this week.1
- OPEC+ Meeting, 29 November 2026: The seven producers that held December output steady meet again. 4 Rystad analyst Jorge Leon said “the much more important test comes at the November 29 ministerial meeting”.10
We will follow each one on our commodities news page.
What would change the read: a gap narrowing back towards $10 as tanker reports fade would suggest the market is again pricing a settlement; a gap that keeps widening alongside further incidents would suggest the premium is rebuilding.
Brent fell this week as if the barrels were already back. As of Friday morning they were not, with Hormuz flows still under 60% of capacity,1 and the spread had started pricing that again.
A $19 range in Brent futures across four sessions 8 shows how fast exposure can change size, and headlines often land while markets are closed, so prices can gap at the open. A Stop Loss can help limit a loss to a planned size, although it cannot guarantee execution at that exact price when markets move fast or gap.
Leverage magnifies gains and losses alike on oil positions, which matters more in a week like this. Sizing positions as a share of account equity, rather than around one headline, can keep a single session from carrying outsized weight in the account balance.
RISK WARNING: CFDs are complex financial instruments and carry a high risk of losing money rapidly due to leverage. You should ensure you fully understand the risks involved and carefully consider whether you can afford to take the high risk of losing your money before trading.
Disclaimer: The information is provided for educational purposes only and doesn’t take into account your personal objectives, financial circumstances, or needs. It does not constitute investment advice. We encourage you to seek independent advice if necessary. The information has not been prepared in accordance with legal requirements designed to promote the independence of investment research. No representation or warranty is given as to the accuracy or completeness of any information contained within. This material may contain historical or past performance figures and should not be relied on. Furthermore estimates, forward-looking statements, and forecasts cannot be guaranteed. The information on this site and the products and services offered are not intended for distribution to any person in any country or jurisdiction where such distribution or use would be contrary to local law or regulation.
References
[1] “Oil set for sharp weekly drop but Middle East supply concerns provide floor – Investing.com (Reuters)” https://www.investing.com/news/commodities-news/oil-set-for-sharp-weekly-drop-but-middle-east-supply-concerns-provide-floor-5006344 Accessed on 6 November 2026.
[2] “Brent Oil Futures Historical Prices – Investing.com” https://www.investing.com/commodities/brent-oil-historical-data Accessed on 6 November 2026.
[3] “Crude Oil WTI Futures Historical Prices – Investing.com” https://www.investing.com/commodities/crude-oil-historical-data Accessed on 6 November 2026.
[4] “Press Release, 1 November 2026 – OPEC” https://opec.org/pr-detail/620-1-november-2026.html Accessed on 6 November 2026.
[5] “Crude oil prices sell off more than 7% on Iran peace talk hopes ahead of U.S. midterms – CNBC” https://www.cnbc.com/2026/11/02/oil-prices-fall-as-iran-us-pursue-diplomacy.html Accessed on 6 November 2026.
[6] “Oil drops 7% as Iran signals openness to peace talks – Yahoo Finance (Reuters)” https://finance.yahoo.com/news/oil-slips-more-1-talks-231257365.html Accessed on 6 November 2026.
[7] “Oil prices fall below $90 as traders bet on Iran war ending after Democrats sweep midterms – Yahoo Finance” https://finance.yahoo.com/markets/article/oil-prices-fall-below-90-as-traders-bet-on-iran-war-ending-after-democrats-sweep-midterms-192105228.html Accessed on 6 November 2026.
[8] “Oil Extends Rebound on Uncertainty Over Iran War Peace Progress – Energy Connects (Bloomberg)” https://www.energyconnects.com/news/oil/2026/november/oil-extends-rebound-on-uncertainty-over-iran-war-peace-progress/ Accessed on 6 November 2026.
[9] “Crude Oil – Price – Chart – Historical Data – News – Trading Economics” https://tradingeconomics.com/commodity/crude-oil Accessed on 6 November 2026.
[10] “OPEC+ keeps December oil output targets steady as Iran war continues to disrupt flows – Devdiscourse (Reuters)” https://www.devdiscourse.com/article/international/4000312-opec-keeps-december-oil-output-targets-steady-asiran-war-continues-to-disrupt-flows Accessed on 6 November 2026.
[11] “Release Calendar 2026 – US Bureau of Labor Statistics” https://www.bls.gov/schedule/2026/home.htm Accessed on 6 November 2026.
[12] “Weekly Petroleum Status Report – U.S. Energy Information Administration” https://www.eia.gov/petroleum/supply/weekly/ Accessed on 6 November 2026.
Key Points In This Article

Latest Financial Market Analysis


Market Analysis Tags
- # USD News
- # USDCAD News
- # USDJPY News
- # USDX News
- # Forex News
- # Forex News Today
- # GBPUSD News
- # EURUSD News
- # Currency Trading News
- # AUDUSD news
Related Articles
- The Trade Desk Stock Climbed as Q3 Earnings Cleared a Lowered Bar – TTD Analysis
- Gold Rose as Oil Slid on US-Iran Peace Hopes – XAUUSD Analysis
- Nasdaq 100 Climbs as Chip Stocks Rebound Without Nvidia – NAS100 Analysis
- Euro Price Recovers as Dollar Eases Before US CPI: What It Means for EURUSD Traders
- How to Read the NFP Report: What the Numbers Actually Mean for Markets
- Brent Crude Fell Faster Than WTI as Iran Peace Bets Built – UKOUSD and USOUSD Analysis
- Dollar Index Slipped as Oil Fell and Hike Bets Rose – USDX Analysis
- S&P 500 Price Falls as Chip Stocks Slide: What It Means for SP500 Traders