
CFDs and Spread Bets are complex instruments and come with a high risk of losing money rapidly due to leverage. 72.65% of retail investor accounts lose money when trading CFDs and Spread Bets with this provider. You should consider whether you understand how CFDs and Spread Bets work and whether you can afford to take the high risk of losing your money.


 Login


SEARCH
-
Search query too short. Please enter a full word or phrase.
-

Keywords
Popular Search


SEARCH
-
Search query too short. Please enter a full word or phrase.
-
Keywords
Popular Search



 Market Analysis Daily Analysis Silver Climbed as the Dollar Slid After the US Midterms – XAGUSD Analysis
CommoditiesCommodities NewsCommodity Market NewsEconomic News TodayFeatured NewsFederal Reserve NewsInterest Rate NewsMarket News TodaySilverSilver News TodayTechnical AnalysisTrending NewsVantage NewsXAUUSD News
Silver Climbed as the Dollar Slid After the US Midterms – XAGUSD Analysis

Vantage Editorial Team >
10 November 2026 | Daily Analysis | 17 min read
Vantage Editorial Team >
Vantage is a global, multi-asset broker with a team of in-house writers and market analysts who produce educational and insightful trading content for traders of all levels.

Key Takeaways
- Silver traded at 53.31 on Vantage’s XAGUSD chart at 10:06 (GMT+8) on 5 November 2026, 9.69% above the 3 November low near 48.60.
- Price sat above the 200-hour moving average (52.17) for the first time in a chart window that starts on 28 October, while the 14-period RSI read 79.08.
- CME FedWatch put the odds of a December Fed rate hike near 78% on 4 November, little changed from 79% a day earlier. 1,10
Silver climbed back above $53 an ounce in Thursday’s Asia session, even though markets still priced a December rate hike from the US Federal Reserve (Fed) at odds near 78%. 1 That’s usually bad news for a metal that pays no interest. This time, it barely seemed to register.
As of 10:06 (GMT+8) / 02:06 (UTC) on 5 November 2026, the silver price today on Vantage’s XAGUSD feed stood at 53.31, with the latest hourly candle up 0.60%; the 12-month high was $121.58 on 29 January 2026. 2
The move lined up with a political result rather than a monetary one. Democrats won control of both chambers of Congress, and the dollar, Treasury yields, and crude oil all slid on 4 November. 3 In this XAGUSD analysis, we unpack why the currency did the heavy lifting while rate pricing barely budged, and what that changes about the risk picture into Friday’s US jobs report.
Silver is still down about 27% this year, 2 so a near-10% bounce in three sessions deserves a closer look rather than a parade. If you’ve followed the silver news this autumn, you’ll know the ranges haven’t been gentle: spot silver covered about $3.70 on 4 November alone, from 48.85 to 52.58. 4
Why is Silver going up today?
Silver climbed 9.69% from its 3 November low to 53.31 by 10:06 (GMT+8) on 5 November 2026, after Democrats won Congress and the dollar and Treasury yields fell. With Fed December hike odds holding near 78%, Friday’s US nonfarm payrolls report is the next test.
Here’s the short version: the dollar moved, and the Fed pricing didn’t.
Rewind to October. Silver lost about 14.63% over the month to 4 November, 6 and on 30 October it slipped below $50 for the first time since late November 2025. 5 A slide in technology and AI-linked stocks made things worse, with margin calls forcing investors to raise cash from haven assets, CNBC reported. 5 Even after that drop, Peter Grant, vice president and senior metals strategist at Zaner Metals, noted that “the market is still expecting a December rate hike from the Fed”. 5
Election day itself offered no relief. Phillip Streible, chief market strategist at Blue Line Futures, summed up 3 November in one line: “The dollar has been strengthening, and yields are going higher”. 10 Spot silver slipped 1.90% to $49.69 that day. 10
Then the results flipped the script. The dollar headed for its biggest one-day fall in three weeks, 11 and Kitco reported that Treasury yields and crude oil followed it lower, with silver outperforming gold. 3 Erik Bregar, director of FX and precious metals risk management at Silver Gold Bull, pointed to “relief that we’re not going to be in a quagmire” over the result. 11
Here’s the detail that caught my eye. FedWatch odds sat at 79% on 3 November 10 and near 78% on 4 November. 1 A one-point shift doesn’t explain a near-10% rebound, so I read this rally as a currency story first. On the Fed side, very little changed.
Silver’s industrial side adds a wrinkle. Kitco noted that its industrial exposure leaves it sensitive to manufacturing conditions and the growth outlook, 3 so a softer oil price that eases inflation worries 5 helps the precious-metal half of silver more than the industrial half.
That explains the bounce. The XAGUSD chart tells a more complicated story about what came after it.
Silver Technical Analysis: Price Reclaims a Falling 200-Hour Average
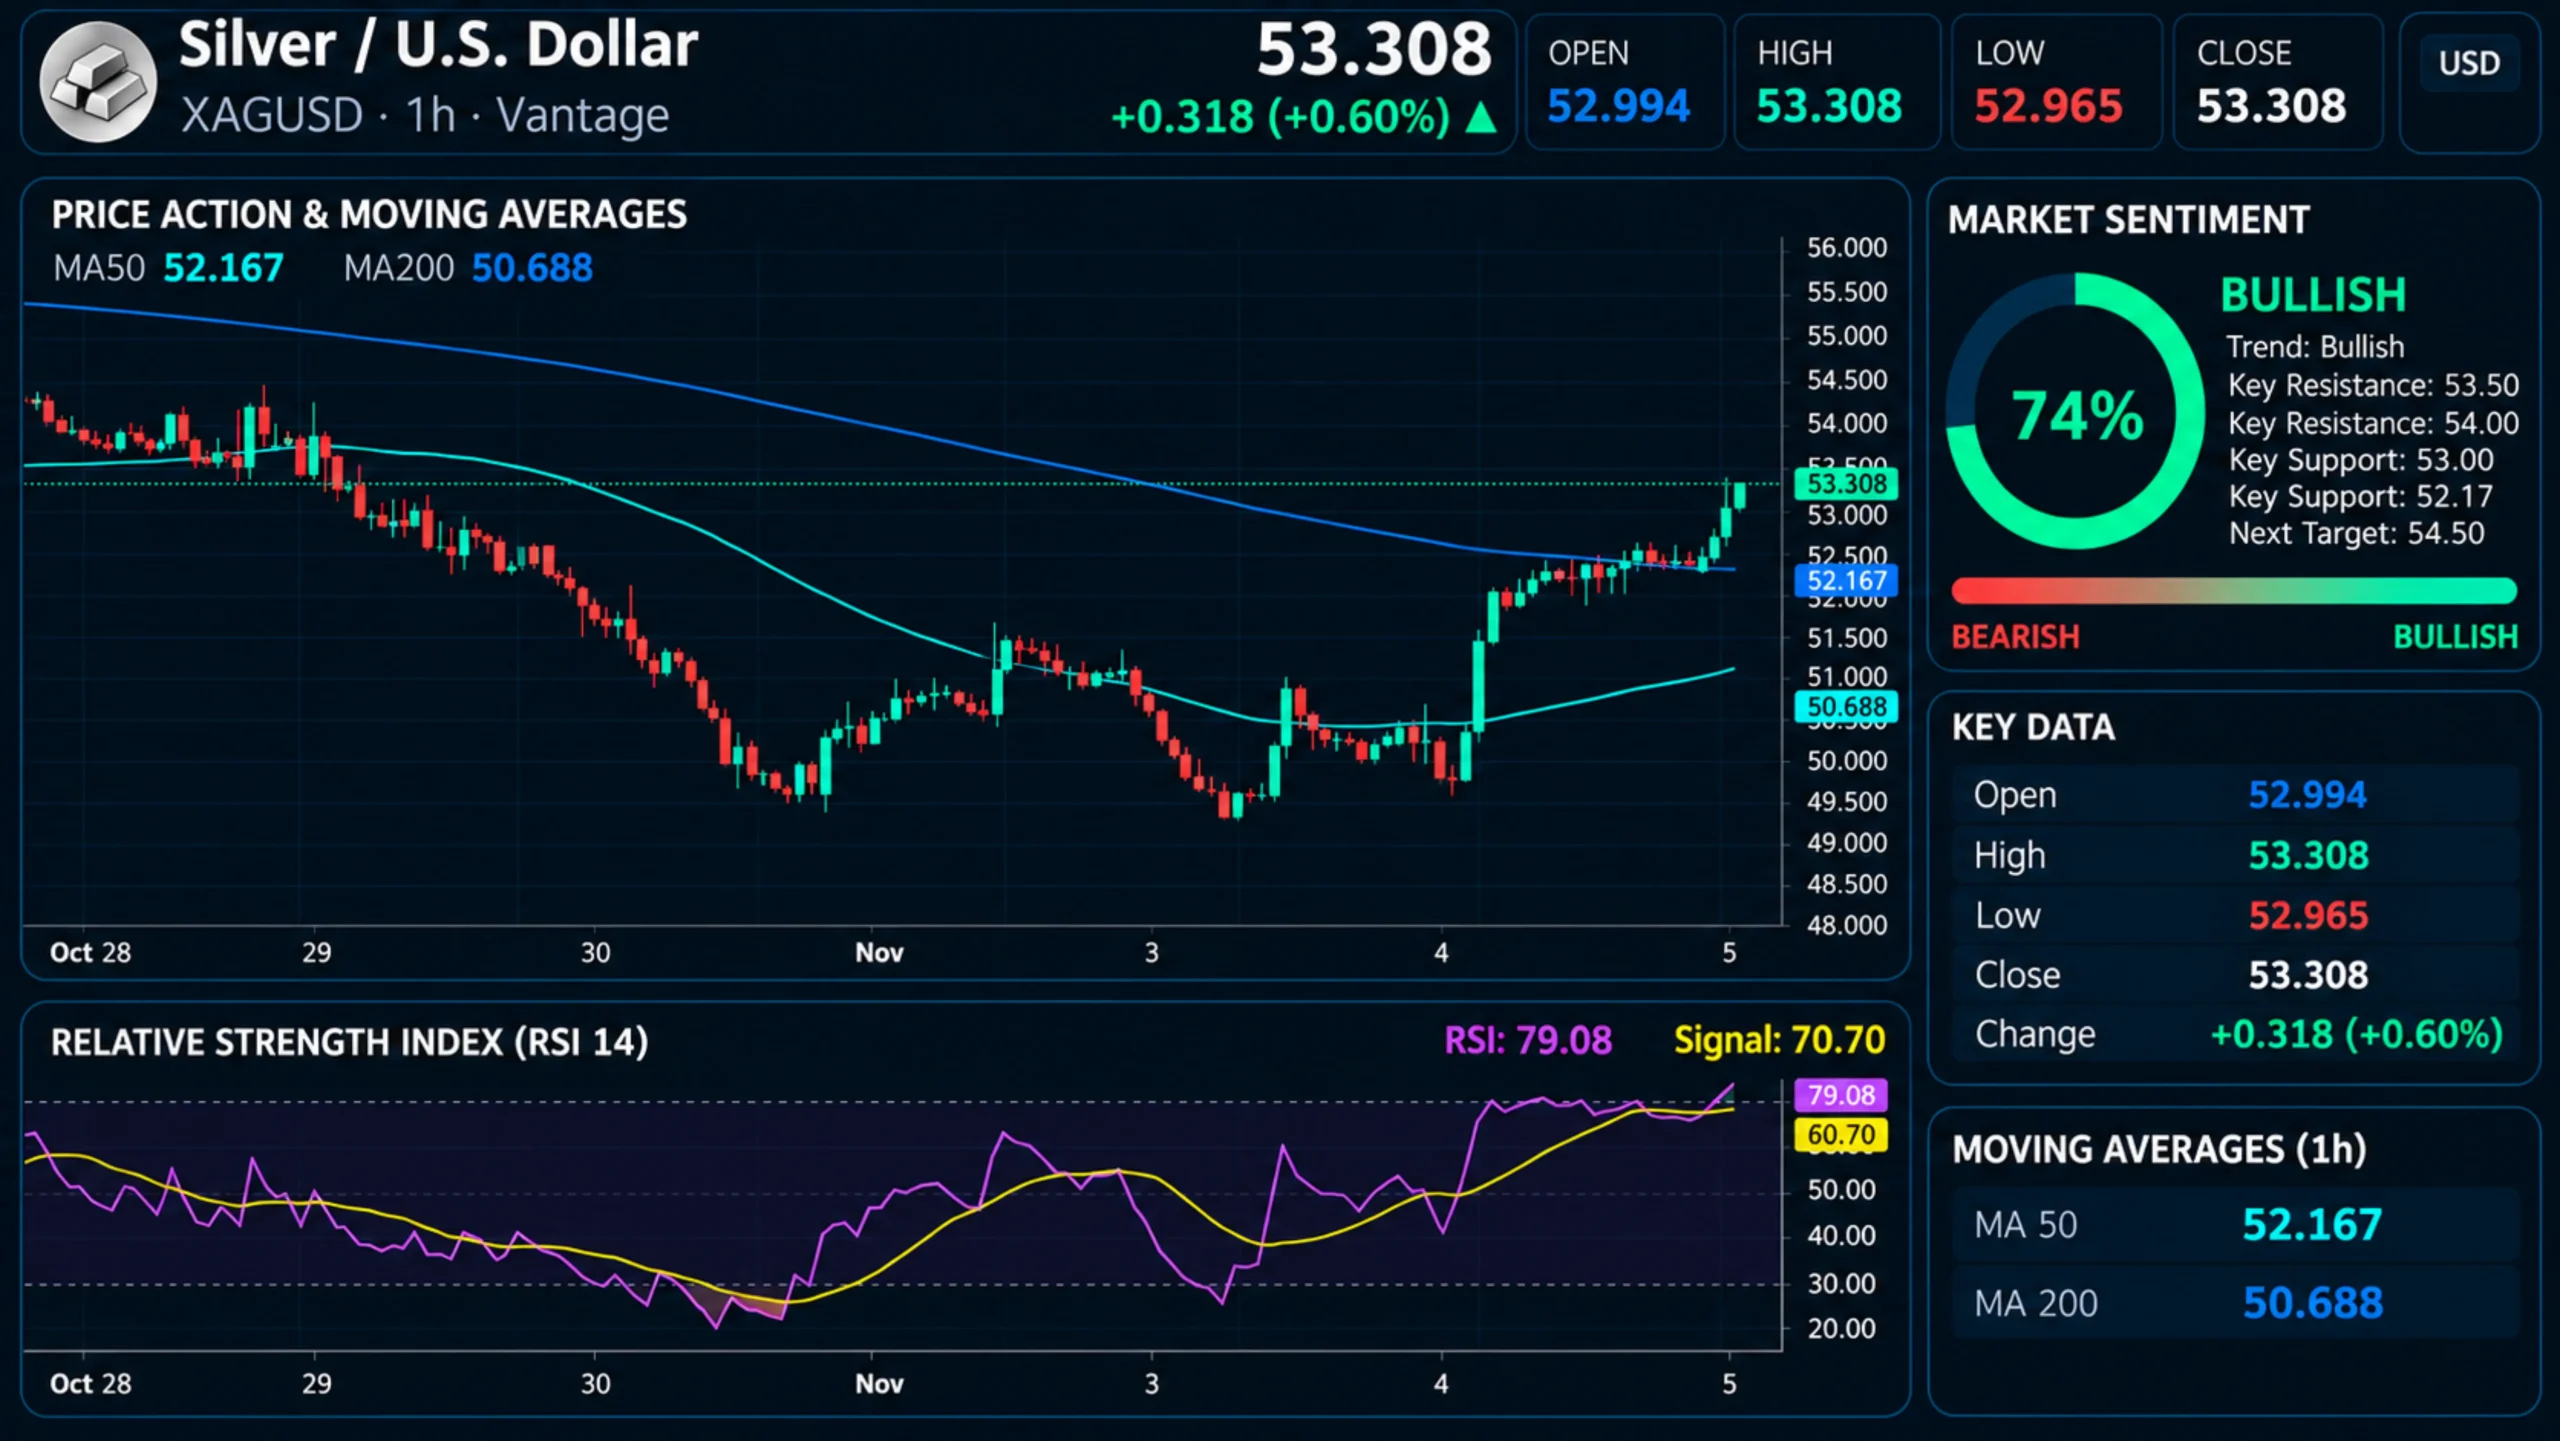
On the hourly XAGUSD chart, price sat above the 200-hour moving average at the cut-off. The catch? That average was still pointing down, and in this XAGUSD technical analysis, that detail carries most of the weight.
The 200-hour line fell from near 56.00 at the start of the chart window on 28 October to 52.17 at 10:06 (GMT+8) on 5 November, a drop of roughly 6.80%. It spent the week walking downstairs; price has only just stepped back above it.
The path ran through two troughs: one near 48.90 on 30 October and 1 November, then a slightly lower one near 48.60 on 3 November. The 4 November candles lifted price from about 49.20 to 51.80. It then traded between roughly 51.60 and 52.40, hugging the 200-hour line, before closing above it on 5 November with a session wick near 53.45.
The 50-hour moving average turned higher from near 49.90 and read 50.69 at the cut-off, still 1.48 below the 200-hour line. The two haven’t crossed.
Momentum ran ahead of the averages. The 14-period Relative Strength Index (RSI) read 79.08 in the TradingView setup used for this analysis, with its signal line at 70.70; on 30 October, it had dipped below 20. An overbought reading tells you how fast price rose, not where it stops. Think of it as a speedometer, not a map.
Levels Traders Are Watching, as of 10:06 (GMT+8) on 5 November 2026
| Level | Price Zone | What It Marks on the Hourly Chart |
|---|---|---|
| Level 2 resistance | 54.00 to 54.60 | 28 to 29 October trading range and wick high |
| Level 1 resistance | 53.40 to 53.50 | 5 November session high |
| Level 1 support | 52.17 | 200-hour moving average |
| Level 2 support | 51.60 to 51.80 | Base of the 4 November consolidation |
| Level 3 support | 50.69 | 50-hour moving average |
| Level 4 support | 48.60 | 3 November low |
Figure 2: XAGUSD H1 levels read from the Vantage XAGUSD chart in Figure 1 (TradingView) Accessed on 5 November 2026. Data indicative, for informational purposes only.
So the chart and the dollar agree on the bounce. Whether they agree on anything beyond it depends on a comparison from 2021.
Gold Silver Ratio: Same Sweep, Opposite Silver Reaction
Silver outran gold on 4 November, and the gold silver ratio narrowed as a result. The ratio, which counts how many ounces of silver equal one ounce of gold in value, fell to 77.2 from 78.8 a day earlier, per USAGOLD. 7
In the silver vs gold race, silver’s 4.58% gain was about 1.55 times gold’s 2.95%. 7 For longer context, Kitco’s commentary desk noted the ratio sat near 77, against roughly 50 in late 2011. 12 Anyone tracking the gold price alongside XAUUSD this week saw the same thing: both metals moved the same way, and silver moved further.
Now for the comparison I find most useful. In January 2021, Democratic wins in the Georgia Senate runoffs also handed the party control of Congress. That day, silver fell 2.60% to $26.86 as Treasury yields rose, CNBC reported. 8 This week, yields fell alongside the dollar, 3 and silver rose.
Two Democratic Sweeps, Two Silver Reactions
| Date | Political Event | Treasury Yields | Silver Move |
|---|---|---|---|
| 6 January 2021 | Georgia runoffs gave Democrats control of Congress | Rose 8 | Fell 2.60% to $26.86 8 |
| 4 November 2026 | Midterms gave Democrats both chambers | Fell 3 | Rose 4.58% to $52.49 7 |
Data for the table above is referenced from CNBC, Kitco, and USAGOLD, 3,7,8 accessed on 5 November 2026.
A Democratic sweep coincided with lower silver in January 2021 and higher silver this week; the difference was what Treasury yields did.
That reframes the week. The election matters to silver mainly through yields and the dollar, and the Fed’s December decision feeds straight into both. Hike odds in the high 70s, 1,10 are the one input the vote left almost untouched. Our read holds while yields stay lower, and weakens if fresh data push them back up.
One caveat: a single 2021 session shows the reaction depended on yields. It doesn’t show that this week’s reaction repeats. Which puts the next few days of US data at the centre of the story.
Silver Price Outlook: What Markets Are Pricing Into Payrolls
After a week like this, plenty of readers go looking for a silver price forecast, a silver price prediction, or an XAGUSD forecast. You won’t find one here. What we can set out is what markets are pricing: a December hike at odds near 78%. 1 Friday’s jobs data is the next print that can move that number, which makes it the first thing to check against any silver forecast doing the rounds.
The US economy added 29,000 jobs in September, and the consensus for October sits at 65,000, according to Trading Economics. 9 A stronger print would line up with the hike pricing already in place; a weaker one would test it. Our commodities news coverage follows the reaction as it lands.
What to Watch, 5 to 6 November 2026 (GMT+8)
- US Initial Jobless Claims, 5 November, 21:30: The first labour read since the election.
- US Nonfarm Payrolls, 6 November, 21:30: October payrolls against a 65,000 consensus and a 29,000 prior. 9
- CME FedWatch December Odds, Ongoing: Whether pricing holds in the high 70s once payrolls land.
- Gold Silver Ratio, Ongoing: Whether the 77.2 reading 7 keeps narrowing, which would show silver still outpacing gold.
- 200-Hour Moving Average, Ongoing: Whether hourly candles hold above 52.17 while the line itself keeps falling.
The read weakens if hourly candles close back below 52.17, which would put price under a line that’s still falling. It also weakens if hike odds climb and yields go with them, since lower yields lined up with this week’s rebound.
That covers what could change the picture. It leaves one practical question for readers newer to the metal: which silver price is on the chart?
What is XAGUSD and how do you trade silver?
XAGUSD is the price of one troy ounce of silver in US dollars. XAG is the currency-style code for silver, so XAGUSD, XAG/USD, and XAG USD all describe the same quote; that’s the whole XAGUSD meaning in one line. A troy ounce weighs 31.103 grams, slightly more than a standard ounce. 2
Three prices turn up in silver news. They’re related, but they aren’t identical:
| Feature | Silver Spot Price | Silver Futures | XAGUSD |
|---|---|---|---|
| What It Is | The price for immediate delivery and the global benchmark 2 | Exchange-traded contracts on COMEX, part of CME Group 2 | A quote that tracks the silver price, with no ownership of metal |
| Trading Hours | Follows global trading hours | Almost 24 hours a day, six days a week 2 | Set by the platform offering it |
| Expiry | None | Fixed contract months | None; positions held overnight may carry swap charges |
| Where You See It | Live silver price pages | Exchange data and futures charts | XAGUSD live chart on platforms such as TradingView |
For anyone researching how to trade silver through a contract for difference (CFD), the main differences from owning metal are leverage and holding costs. Leverage magnifies losses as well as returns, so a $3.70 session like 4 November 4 hits an account balance harder than the same move on unleveraged exposure.
One practical note: the XAGUSD live price in Figure 1 comes from Vantage’s feed on XAGUSD TradingView charts, so its levels can differ slightly from spot quotes published elsewhere. The XAGUSD news feed carries updates through the session.
Silver Price FAQ
What does the gold silver ratio show right now?
The ratio fell to 77.2 from 78.8 on 4 November, 7 which means silver gained more than gold that day. A falling ratio describes relative performance between the two metals, not the direction of either.
Is there a silver price forecast in this analysis?
No. The piece covers what happened and what markets are pricing, and the levels table lists levels traders are watching rather than projections. Charts are good at history; they don’t publish timetables.
Where can I see the XAGUSD price and silver price chart?
Figure 1 shows the hourly XAGUSD price chart as of 10:06 (GMT+8) on 5 November 2026. Prices move continuously, so any figure here is a snapshot rather than a live quote.
Risk Around the Payrolls Print
Silver had a reason to struggle this week, with a Fed hike priced at near 78%, 1 and it rose almost 10% from the 3 November low anyway. The answer sits with the dollar and yields, and the hike pricing the election left in place is exactly what Friday’s payrolls can test.
Ranges like the one on 4 November, when spot silver covered about $3.70 in a session, 4 mean price can travel a long way between hourly closes, and data releases can gap price past a planned exit level. A Stop Loss order is designed to limit losses to a planned size, although in fast markets it may be filled at a worse price than the level set.
Leverage magnifies both returns and losses on XAGUSD. Position size relative to account equity sets how much a move such as the 4.71 rise from the 3 November low affects an account balance; at the same leverage, a larger position means a larger effect in either direction.
Related Reading
RISK WARNING: CFDs are complex financial instruments and carry a high risk of losing money rapidly due to leverage. You should ensure you fully understand the risks involved and carefully consider whether you can afford to take the high risk of losing your money before trading.
Disclaimer: The information is provided for educational purposes only and doesn’t take into account your personal objectives, financial circumstances, or needs. It does not constitute investment advice. We encourage you to seek independent advice if necessary. The information has not been prepared in accordance with legal requirements designed to promote the independence of investment research. No representation or warranty is given as to the accuracy or completeness of any information contained within. This material may contain historical or past performance figures and should not be relied on. Furthermore estimates, forward-looking statements, and forecasts cannot be guaranteed. The information on this site and the products and services offered are not intended for distribution to any person in any country or jurisdiction where such distribution or use would be contrary to local law or regulation.
References
[1] “Gold rises as dollar weakens ahead of U.S. midterm election results – CNBC” https://www.cnbc.com/2026/11/04/gold-rises-as-dollar-weakens-ahead-of-us-midterm-election-results.html Accessed on 5 November 2026.
[2] “Silver Price Today – Forbes Advisor” https://www.forbes.com/advisor/investing/silver-price/ Accessed on 5 November 2026.
[3] “Gold climbs above $4,000, Wall Street rallies as Dems take Congress – Kitco” https://www.kitco.com/news/article/2026-11-04/gold-climbs-above-4000-wall-street-rallies-dems-take-congress-kitco-pm Accessed on 5 November 2026.
[4] “Silver Price Today – Kitco” https://www.kitco.com/charts/silver Accessed on 5 November 2026.
[5] “Gold rises from one-year low on softer oil prices; U.S. midterms in focus – CNBC” https://www.cnbc.com/2026/11/02/gold-rises-on-softer-oil-markets-parse-fed-signals.html Accessed on 5 November 2026.
[6] “Silver – Price – Chart – Historical Data – News – Trading Economics” https://tradingeconomics.com/commodity/silver Accessed on 5 November 2026.
[7] “Gold Surges 3% to $4,053 as Democrats Sweep Congress; Silver Jumps 4.6% – USAGOLD” https://www.usagold.com/daily-precious-metals-market-report-november-4-2026/ Accessed on 5 November 2026.
[8] “Gold markets, dollar and US politics – CNBC” https://www.cnbc.com/2021/01/06/gold-markets-dollar-us-politics.html Accessed on 5 November 2026.
[9] “United States Non Farm Payrolls – Trading Economics” https://tradingeconomics.com/united-states/non-farm-payrolls Accessed on 5 November 2026.
[10] “Gold price edges lower again as dollar, yields strengthen; US midterms in focus – MINING.COM (Reuters)” https://www.mining.com/web/gold-price-edges-lower-again-as-dollar-yields-strengthen-us-midterms-in-focus/ Accessed on 5 November 2026.
[11] “Dollar falls after Democrats take US Congress in midterm elections – Reuters via Yahoo Finance” https://finance.yahoo.com/markets/currencies/articles/dollar-drops-sharply-democrats-early-034310225.html Accessed on 5 November 2026.
[12] “The dollar decides: What the midterm rally in gold and silver says about the next turn – Kitco” https://kitco.com/opinion/2026-11-04/dollar-decides-what-midterm-rally-gold-and-silver-says-about-next-turn Accessed on 5 November 2026.
Key Points In This Article

Latest Financial Market Analysis


Market Analysis Tags
- # USD News
- # USDCAD News
- # USDJPY News
- # USDX News
- # Forex News
- # Forex News Today
- # GBPUSD News
- # EURUSD News
- # Currency Trading News
- # AUDUSD news
Related Articles
- The Trade Desk Stock Climbed as Q3 Earnings Cleared a Lowered Bar – TTD Analysis
- Gold Rose as Oil Slid on US-Iran Peace Hopes – XAUUSD Analysis
- Nasdaq 100 Climbs as Chip Stocks Rebound Without Nvidia – NAS100 Analysis
- Euro Price Recovers as Dollar Eases Before US CPI: What It Means for EURUSD Traders
- How to Read the NFP Report: What the Numbers Actually Mean for Markets
- Brent Crude Fell Faster Than WTI as Iran Peace Bets Built – UKOUSD and USOUSD Analysis
- Dollar Index Slipped as Oil Fell and Hike Bets Rose – USDX Analysis
- S&P 500 Price Falls as Chip Stocks Slide: What It Means for SP500 Traders