

 Login
Login





Why Gold Rebounded as an Overbought Dollar Broke Above 100 – XAUUSD CFD Analysis

Vantage Editorial Team >
Vantage Editorial Team >
Vantage is a global, multi-asset broker with a team of in-house writers and market analysts who produce educational and insightful trading content for traders of all levels.
 Updated Thu, 2026 September 24 05:44

Gold traded at $4,364.38 on the Vantage XAUUSD CFD at 09:06 (GMT+8) on 18 September 2026, extending its rebound even as the Dollar Index sat overbought above 100 after the Federal Reserve’s first rate hike since 2023, with a Bank of Japan decision still pending.
Gold, it turns out, did not read the script. The Fed hiked, the Dollar broke a level it had not touched in weeks, and by the standard playbook the XAUUSD price should be sulking somewhere lower. Instead, it climbed. This piece works through what the chart is showing, the macro backdrop behind it, and where the two signals agree or pull apart. All prices are as of 18 September 2026, 09:06 (GMT+8) / 01:06 UTC. Charts are indicative and sourced from TradingView. This is not financial advice.
Key Points
- Gold prices rebounded from a post-Fed wick low near $4,230 on 17 September to $4,364.38 by 18 September, trading between its 50-period and 200-period moving averages.1
- The Federal Reserve raised rates 25 basis points to 3.75%-4.00% on 16 September, its first hike since 2023, and a hawkish dot plot removed previously pencilled-in 2027 cuts.4,5
- The Dollar Index broke above 100.00 with an RSI of 83.54, deeply overbought, yet gold kept climbing rather than selling off, a divergence worth watching.2,6
XAUUSD Snapshot
A quick-reference table for anyone scanning for the gold price today.
| Metric | Value | As Of |
| XAUUSD price | $4,364.38 | 09:06 (GMT+8), 18 Sep 2026 |
| 4H change | +$22.63 (+0.52%) | Same candle |
| 200-period MA | $4,349.36 | Same cut-off |
| 50-period MA | $4,400.93 | Same cut-off |
| RSI (14) / signal | 55.50 / 49.28 | Same cut-off |
| Fed funds rate | 3.75%-4.00% | 16 Sep 2026 decision |
| Dollar Index (DXY) | 100.066, RSI 83.54 | 17 Sep 2026 |
| BOJ policy rate | 1.00%, hike to 1.25% expected | Decision due 18 Sep 2026 |
Table 1: Snapshot figures as of 09:06 (GMT+8), 18 September 2026. Source: TradingView setup used for this analysis, Vantage XAUUSD CFD and Vantage USDX CFD. Indicative only.
What the XAUUSD Chart Is Showing
On the four-hour Vantage XAUUSD CFD chart, gold opened the latest candle at $4,342.37, ran to $4,364.42, dipped to $4,339.95 and closed at $4,364.38, up $22.63 on the candle.1 That close sits just above the 200-period moving average of $4,349.36, having wicked as low as $4,339.95 (below that average) earlier in the candle, while the 50-period average sits higher, at $4,400.93.1 Price holding between the two, closer to the 200-period line, reads as a market rebuilding structure rather than confirming a clean trend.
The Relative Strength Index (RSI) for this XAUUSD technical analysis reads 55.50, signal line 49.28, both back on the firmer side of neutral after dipping into the mid-30s during the Fed-driven selloff.1 Zoom out and gold ran from a wick low near $4,230 on 17 September to $4,305 within hours, then extended that recovery to $4,364.38 by the next morning.7
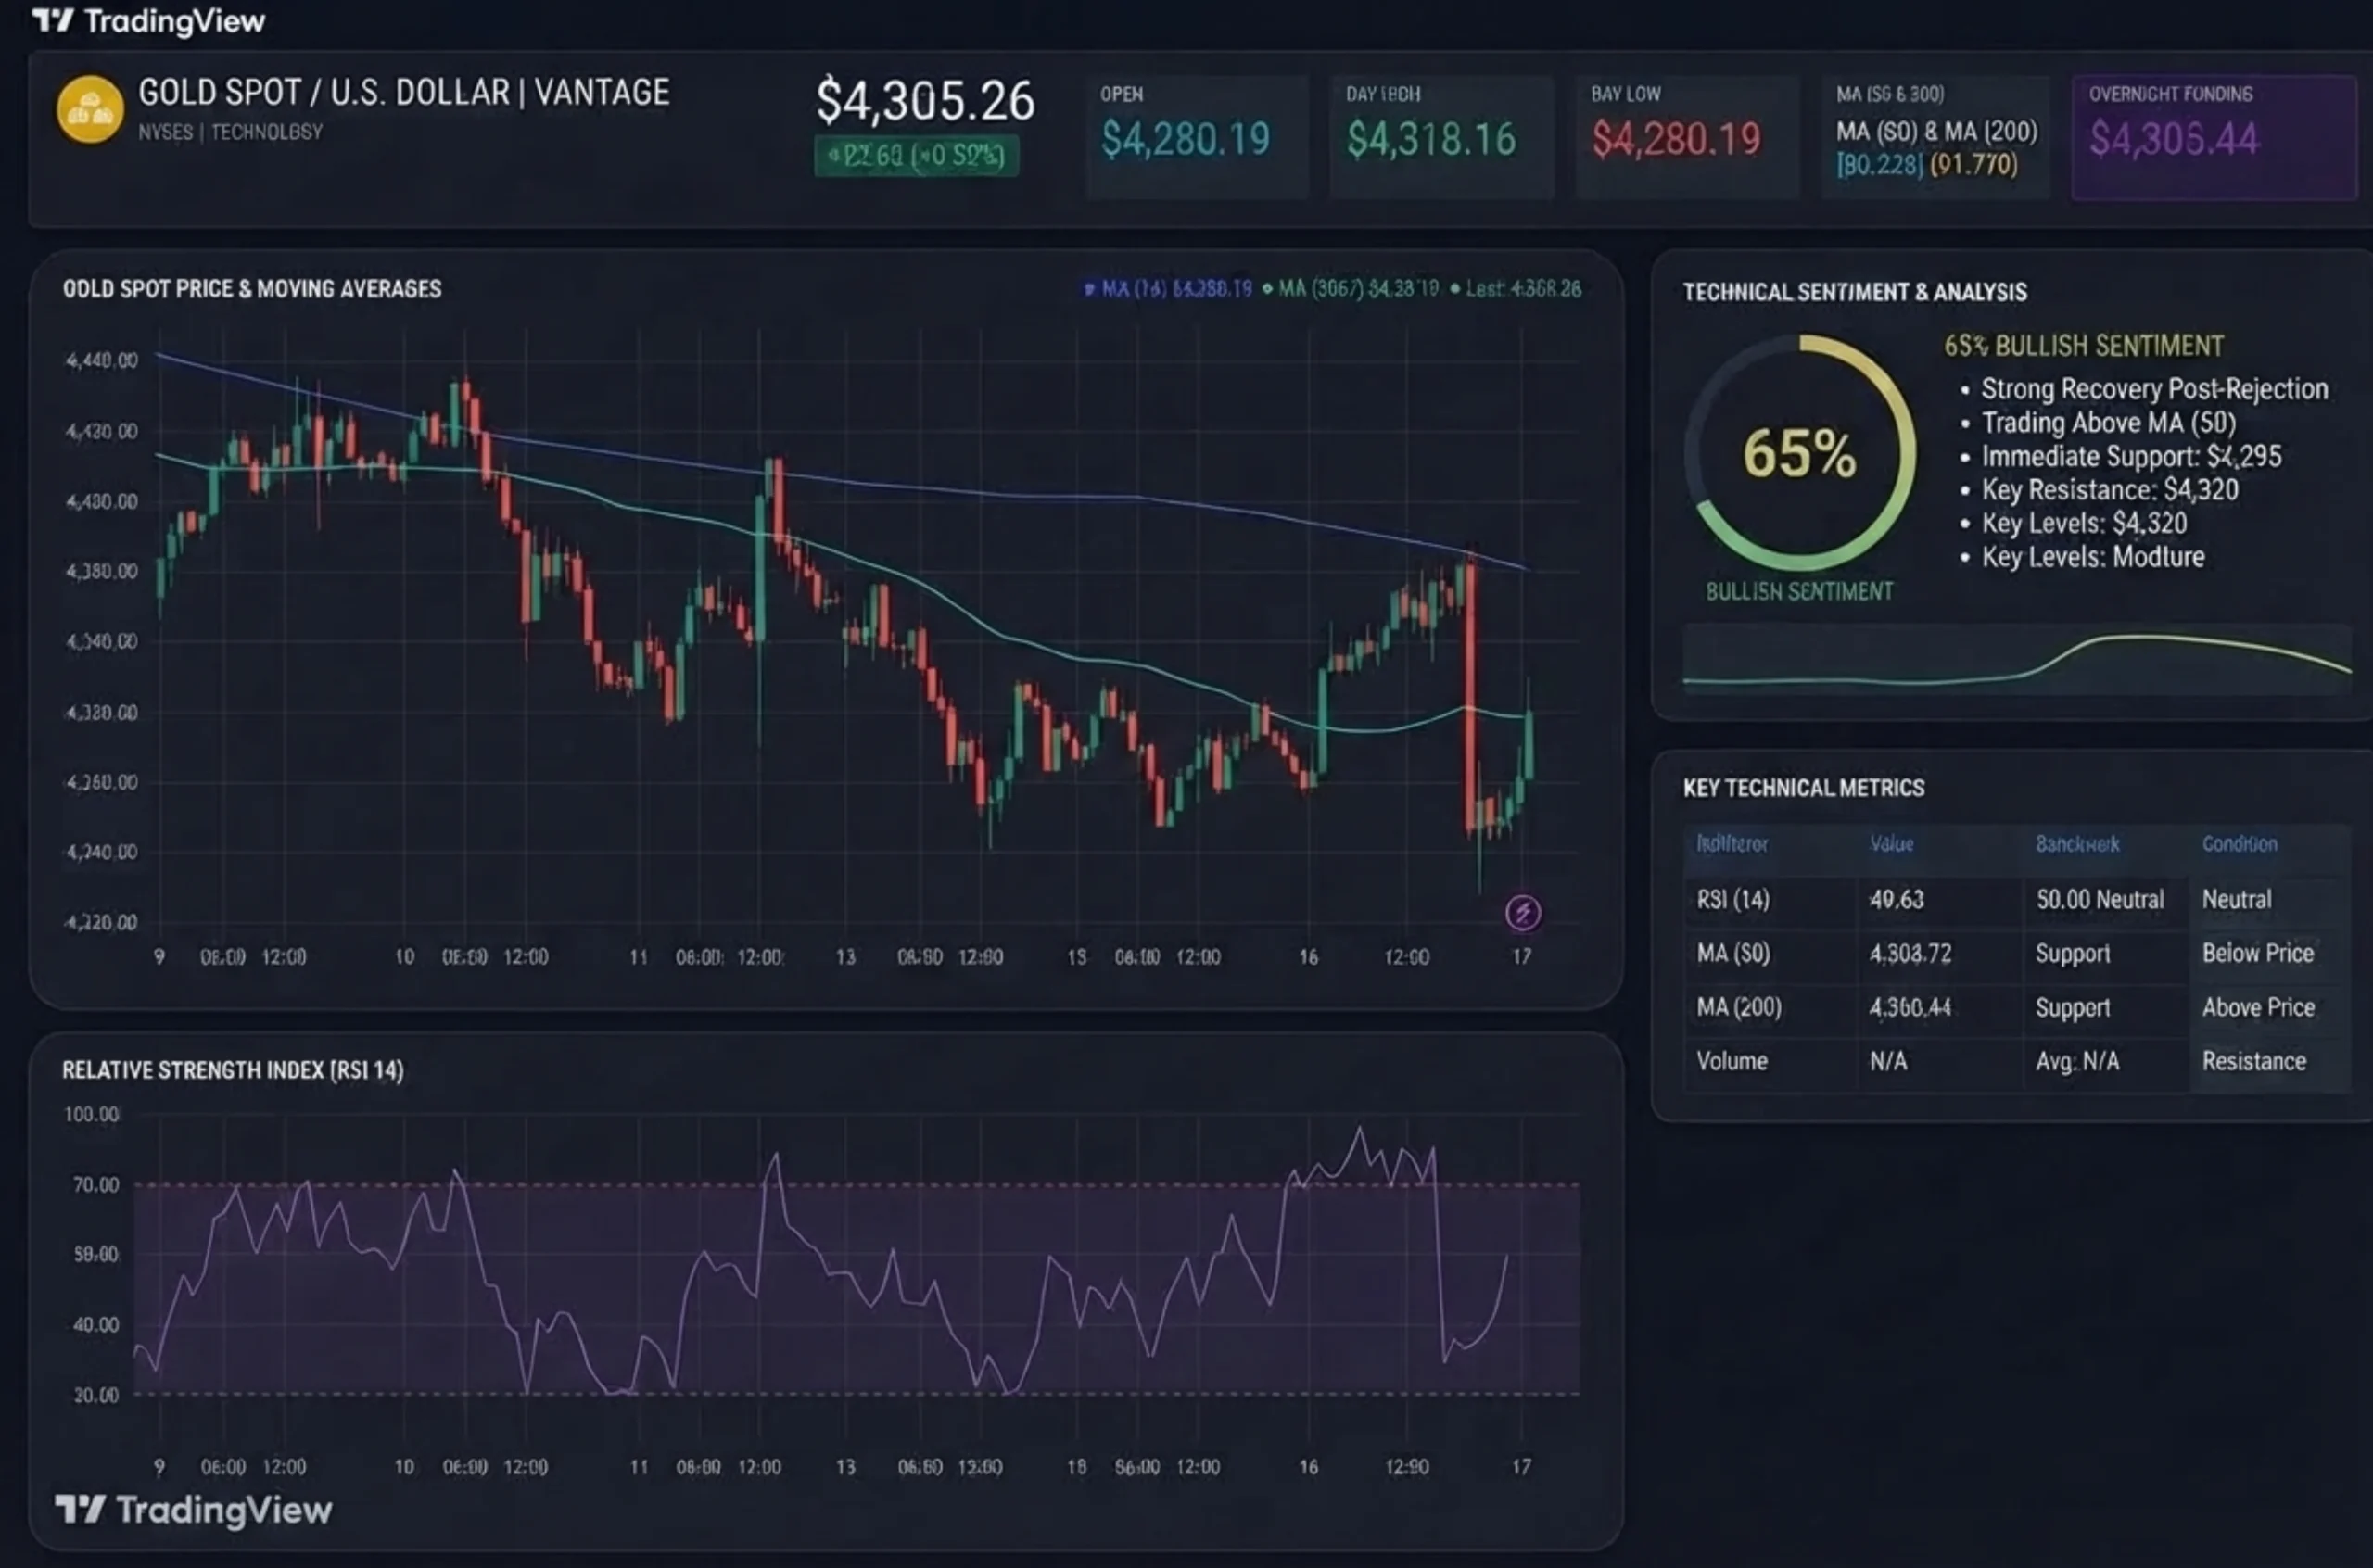
XAUUSD 4H chart, gold’s rebound from the post-Fed wick low toward its 50-period moving average (TradingView, https://www.tradingview.com/symbols/OANDA-XAUUSD/) Accessed on 18 September 2026, 09:06 (GMT+8). Data indicative, for informational purposes only.
Structurally, the chart shows gold testing its 200-period moving average as support after the hike, with the 50-period line standing as the level price would need to reclaim to repair the pre-hike trend.1
The Macro Backdrop: A Hawkish Fed, an Overbought Dollar, and Middle East Risk
The Federal Open Market Committee voted 12-0 on 16 September to raise the federal funds rate 25 basis points, to 3.75%-4.00%, its first increase since 2023.4 The updated dot plot lifted the median projection for the end of 2026 to 4.125%, from 3.80% in June, removing the cuts markets had pencilled in for 2027.5 Fed Chair Kevin Warsh told reporters inflation remained too high after an extended period above target.8
Michael Gapen, chief US economist at Morgan Stanley, called the tone “hawkish” and said the Fed still has room for further tightening.11 Independent metals trader Tai Wong was blunter, saying the dot plot “is helping the dollar and will pressure metals in the short-term.”11 That view showed up fast: the US Dollar Index (USDX/DXY) broke above 100.00 within hours, reaching 100.066 on the Vantage USDX CFD one-hour chart, with RSI at 83.54, deep into overbought territory.2
Underneath it all is the Middle East: Strait of Hormuz tension, a heavier Houthi presence near Bab el-Mandeb, and a deepening Saudi pipeline crisis have kept Brent crude elevated and a safe-haven bid under gold.9 Layered on top: the Bank of Japan’s two-day meeting concludes later on 18 September, with Nikkei Asia and The Japan Times both reporting an expected hike to 1.25% from 1.00%, its highest since 1995.6,10 That decision was still pending at this article’s cut-off.
Where They Meet: Gold’s Rebound Against an Overbought Dollar
On paper, this week should be a clean headwind for gold: a hawkish Fed, a Dollar Index through a psychological level, a dot plot that erased next year’s expected cuts.2,4,5 Instead, gold has extended its rebound through the same window, climbing from the post-hike wick low near $4,230 back above $4,360.1,7 That divergence is worth sitting with rather than explaining away.
The Dollar’s RSI of 83.54 is a stretched reading markets often digest with a pause, not an indefinite extension.2 Gold, meanwhile, is trading just above its 200-period moving average, having wicked below it intracandle before closing back on top.1 An overbought Dollar, a pending BOJ decision, and an unresolved Middle East premium are giving gold more support than the Fed narrative alone suggests. None of that signals how it resolves; it means the two pictures disagree at this cut-off.
Levels to Watch and Risk Framing
The table below covers this week’s reference points. These are levels traders are monitoring, not signals to act on.
| Level | Price | What It Means |
| 200-period MA (4H) | $4,349.36 | Current support test, close to where price sits at cut-off |
| Current price (cut-off) | $4,364.38 | 09:06 (GMT+8), 18 September 2026 |
| Post-Fed wick low | ~$4,230 | Steepest print of the week, set 17 September |
| 50-period MA (4H) | $4,400.93 | Level price would need to reclaim to repair the pre-hike trend |
Table 2: Reference levels only, not trade signals. Source: TradingView setup used for this analysis, as of 09:06 (GMT+8), 18 September 2026. Indicative only.
What to watch:
– Bank of Japan Policy Decision, 18 September: A two-day meeting concludes today, with Nikkei Asia and The Japan Times both reporting an expected hike to 1.25%.6,10
– Dollar Index Follow-Through: An RSI of 83.54 leaves room for consolidation, relevant to how gold trades from here.2
– Middle East Developments: Continued Strait of Hormuz and Bab el-Mandeb tension, plus Saudi Arabia’s pipeline crisis, keep a safe-haven bid in play.9
– Fed Dot Plot Follow-Through: Markets are still digesting the hawkish removal of pencilled-in 2027 cuts.5
This week is a reminder that CFD prices can move a long way within a single session once a scheduled catalyst lands, and 16 September was exactly that kind of move. A Stop Loss does not prevent a loss, but it does define how far a single candle, like the post-hike wick, can affect an open position, which matters more with a BOJ decision and further Middle East headlines still to come.
Gold, like other Vantage CFDs, is available with leverage of up to 1:1000, with ratios varying by account and jurisdiction; leverage is a double-edged tool, magnifying potential returns exactly as it magnifies potential losses relative to capital committed. Position sizing matters more this week than reacting to any single candle. New to the metal? The gold trading guide covers the basics. For more coverage, follow XAUUSD news, gold price news, gold news today, Federal Reserve News and interest rate news from Vantage as the picture develops.
RISK WARNING: CFDs are complex financial instruments and carry a high risk of losing money rapidly due to leverage. You should ensure you fully understand the risks involved and carefully consider whether you can afford to take the high risk of losing your money before trading.
Disclaimer: The information is provided for educational purposes only and doesn’t take into account your personal objectives, financial circumstances, or needs. It does not constitute investment advice. We encourage you to seek independent advice if necessary. The information has not been prepared in accordance with legal requirements designed to promote the independence of investment research. No representation or warranty is given as to the accuracy or completeness of any information contained within. This material may contain historical or past performance figures and should not be relied on. Furthermore estimates, forward-looking statements, and forecasts cannot be guaranteed. The information on this site and the products and services offered are not intended for distribution to any person in any country or jurisdiction where such distribution or use would be contrary to local law or regulation.
References
[1] “XAUUSD Chart: Gold Spot Price Today – TradingView” https://www.tradingview.com/symbols/XAUUSD/ Accessed on 18 September 2026.
[2] “USDX Clears 100 as Fed Delivers First Hike Since 2023 – Vantage” https://www.vantagemarkets.com/market-analysis/usdx-dollar-index-fed-rate-hike-september-17-2026/ Accessed on 18 September 2026.
[4] “Fed rate decision September 2026: Rates rise to 3.75%-4% – CNBC” https://www.cnbc.com/2026/09/16/fed-rate-decision-september-2026.html Accessed on 18 September 2026.
[5] “Fed rate hike bolsters US Dollar Index above 100.00 – FXStreet” https://www.fxstreet.com/news/the-federal-reserve-hikes-into-a-dollar-index-basket-that-also-raised-rates-202609161815 Accessed on 18 September 2026.
[6] “Bank of Japan set to raise policy rate to 1.25% next week – Nikkei Asia” https://asia.nikkei.com/economy/bank-of-japan/bank-of-japan-set-to-raise-policy-rate-to-1.25-next-week Accessed on 18 September 2026.
[7] “Why Gold Slumped, Then Rebounded, as the Fed Hiked Rates – XAUUSD CFD Analysis – Vantage” https://www.vantagemarkets.com/market-analysis/why-gold-slumped-rebounded-fed-rate-hike-september-17-2026/ Accessed on 18 September 2026.
[8] “Fed meeting recap: Warsh says inflation is still too high as Fed hikes for the first time since 2023 – CNBC” https://www.cnbc.com/2026/09/16/fed-meeting-today-live-updates.html Accessed on 18 September 2026.
[9] “Why Brent Crude Climbed Toward $110 as Saudi’s Pipeline Crisis Deepens – UKOUSD & USOUSD CFD Analysis – Vantage” https://www.vantagemarkets.com/market-analysis/brent-crude-climbs-saudi-pipeline-fed-hike-september-17/ Accessed on 18 September 2026.
[10] “BOJ set to raise interest rate to 1.25% next week – The Japan Times” https://www.japantimes.co.jp/business/2026/09/12/economy/boj-interest-rate/ Accessed on 18 September 2026.
[11] “Gold Forecast, News and Analysis (XAU/USD) – FXStreet” https://www.fxstreet.com/commodities/gold Accessed on 18 September 2026.
The information has been prepared as of the date published and is subject to change thereafter. The information is provided for educational purposes only and doesn't take into account your personal objectives, financial circumstances, or needs. It does not constitute investment advice. We encourage you to seek independent advice if necessary. The information has not been prepared in accordance with legal requirements designed to promote the independence of investment research. No representation or warranty is given as to the accuracy or completeness of any information contained within. This material may contain historical or past performance figures and should not be relied on. Furthermore estimates, forward-looking statements, and forecasts cannot be guaranteed. The information on this site and the products and services offered are not intended for distribution to any person in any country or jurisdiction where such distribution or use would be contrary to local law or regulation.