

 Login
Login





Why Nvidia Stock Rebounded Near Its September High as US-China Tensions Ease – NVDA CFD Analysis

Vantage Editorial Team >
Vantage Editorial Team >
Vantage is a global, multi-asset broker with a team of in-house writers and market analysts who produce educational and insightful trading content for traders of all levels.
 Updated Thu, 2026 September 24 05:44

Nvidia (NVDA) traded near $227.25 as of 22 September 2026, rebounding roughly 9% from a September low near $209. Its RSI reads 78.56, flagging overbought conditions after an oversold mid-month dip. The bounce has coincided with Jensen Huang’s chip demand comments and US-China trade optimism.
- Nvidia (NASDAQ: NVDA) traded near $227.25 as of 09:30 (GMT-4) on 22 September 2026, roughly 3% below its 4 September peak near $234.
- NVDA’s RSI read 78.56, its most overbought reading since the 27 August earnings reaction, after dipping near 20 in mid-September.
- NVDA has rebounded roughly 8-9% from a $209 low on 14-15 September, trading above its 50-hour and 200-hour moving averages.
Three weeks, two extremes, one stock: that is the NVDA stock chart since early September. Nvidia (NASDAQ: NVDA), ticker NVDA on the Nasdaq, traded at $227.25 as of 09:30 (GMT-4) on 22 September 2026, a marginal 0.07% pullback from the prior close and just below the $227.70 overnight level shown on the chart.1 If you came here for an NVDA stock forecast, NVDA stock prediction, or the outlook for Nvidia stock, here is the honest version: this piece reads the NVDA share price and the chart, not what happens next.
Here is the NVDA stock chart at a glance, everything a search for ‘NVDA stock price today’ or ‘NVDA news today’ would want, in one place.
| Metric | Reading | As Of |
| NVDA last price | $227.25 | 09:30 GMT-4, 22 Sep |
| Session change | -0.07% (-$0.15) | Same session |
| RSI (14) | 78.56 (overbought) | Same session |
| 50-hour moving average | $220.14 | Same session |
| 200-hour moving average | $217.68 | Same session |
| September high | ~$234 | 4 Sep |
| September low | ~$209 | 14-15 Sep |
Table 1: NVDA Snapshot, key levels and indicators as of 09:30 (GMT-4), 22 September 2026. Source: TradingView. Indicative only.
Nvidia’s Hourly Chart Traces a Sharp Round Trip From September’s Peak
NVDA’s session opened at $227.39, ranged $226.94 to $227.68, and last traded at $227.25.1 The NVDA stock chart’s bigger story is a round trip: the 27 August earnings reaction carried the stock from the low $210s toward $229, a brief pullback, then a fresh high near $234 on 4 September.1,2 Price then fell steadily, bottoming near $209 on 14-15 September, before climbing back in a steep, near-uninterrupted run to today’s level. NVDA now trades above both its 50-hour moving average (220.14) and 200-hour moving average (217.68), reflecting the recovery already made, not a signal for what comes next.1
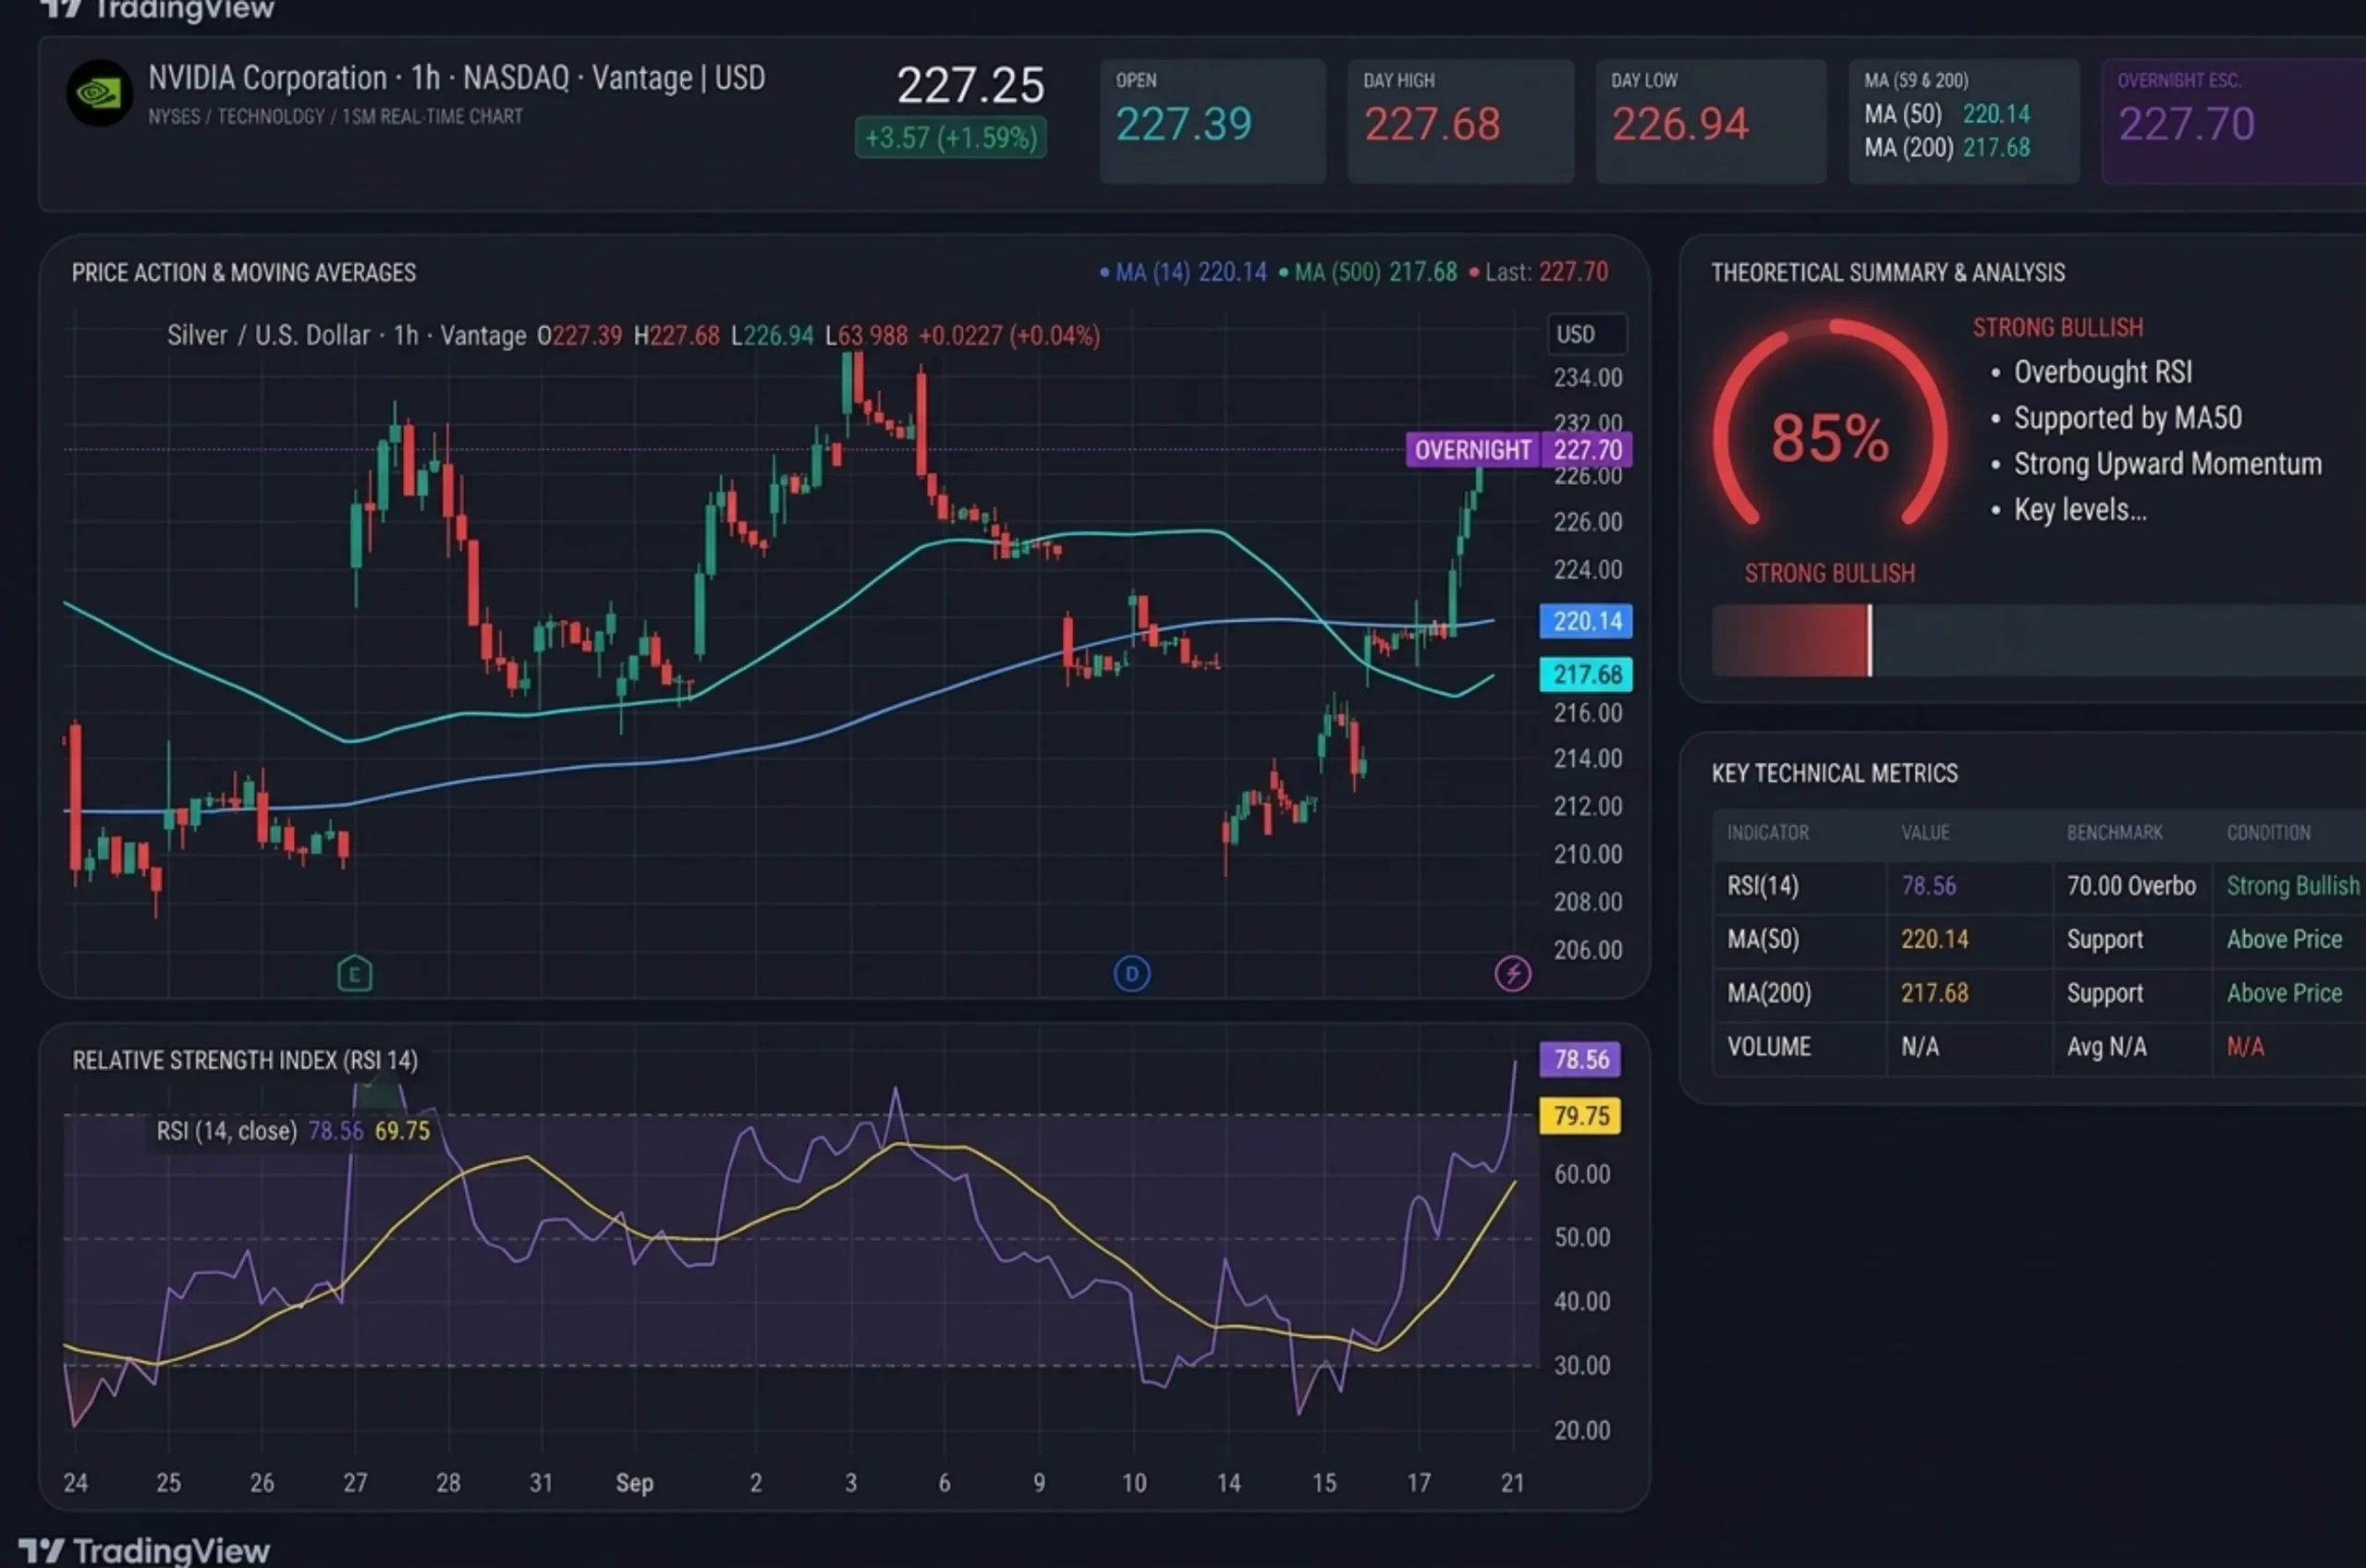
NVDA 1-Hour Chart, “Round Trip From the September High to the September Low and Back” (TradingView, https://www.tradingview.com/symbols/NASDAQ-NVDA/) Accessed on 22 September 2026. Data indicative, for informational purposes only.
RSI at 78.56 Flags Its Most Overbought Reading Since Late August
The 14-period Relative Strength Index (RSI) read 78.56 as of the cut-off, with its signal line at 69.75, both above the 70 level commonly used to describe overbought conditions.1 The last comparably high reading came around the 27 August earnings reaction; RSI eased through early September, brushed 70 again near the 4 September peak without holding there, then fell to roughly 20, oversold, by the mid-September low.1 That is useful context, not a cue to act on: overbought describes how far and fast price has moved, not how long it can last. NVDA’s RSI has round-tripped from oversold to its most overbought reading in nearly a month, in about two weeks.
Huang’s Chip Forecast and Cooling US-China Tensions Coincided With the Bounce
In the week’s biggest NVDA news, CEO Jensen Huang told reporters on 17 September, ahead of an AI summit hosted by the UK’s King Charles III in Scotland, that he expects Nvidia to sell twice as many chips next year, citing AI investment “in almost every single country” Nvidia operates in.3 That follows Nvidia’s 70% revenue growth guidance for fiscal 2028, issued alongside August’s earnings beat. Swissquote’s Ipek Ozkardeskaya said “the AI build-out will continue at full speed.”4 Morningstar’s Brian Colello separately argued “the AI infrastructure opportunity is massive,” citing Nvidia’s own $3 trillion to $4 trillion AI infrastructure spending estimate for 2030.5
The chip sector moved alongside that story: the Philadelphia Semiconductor Index gained for a fourth straight session on 18 September, and Intel, AMD, and Nvidia all advanced again on 21 September on Intel’s new packaging deal and improving US-China dialogue.6 Treasury Secretary Bessent called weekend China talks a “very successful engagement,” coinciding with softer oil prices.6 None of this is one confirmed cause; a stock rising alongside supportive headlines is correlation, not mechanism. Wall Street’s own average NVDA price target sits between $324.30 and $327.70, a figure that belongs to sell-side analysts, not this analysis.7
Levels Traders Are Watching on the NVDA CFD Chart
The table below sets out the reference zones on the current hourly chart. These are levels observed, not trade signals.
| Zone | Level | What’s Happening |
| Near-term resistance | ~$227.70-$229 | Overnight reference level and upper edge of the current range |
| Stronger resistance | ~$234 | 4 September intraday high, the range top for this stretch |
| Near-term support | ~$220 (50-hour MA) | First moving-average support below current price |
| Deeper support | ~$217.68 (200-hour MA) | Longer-term moving-average support |
| Range low | ~$209 | 14-15 September intraday low |
Table 2: Key hourly levels as of 09:30 (GMT-4), 22 September 2026. Source: TradingView. Indicative only.
For anyone tracking Nvidia’s stock outlook this week, the setup sits close to the top of its recent range, with RSI already overbought before the stock has cleared its 4 September high.
NVDA is a high-beta, headline-sensitive stock, so Stop Loss placement relative to the moving-average zones above, not a fixed dollar figure, is one way traders manage exposure to a swing this size. A Stop Loss does not prevent a loss; it limits losses to a planned size.
Leverage on share CFDs works both ways, amplifying gains and losses alike, and matters more after an 11% decline and a 9% rebound inside three weeks. Position sizing relative to account equity is worth revisiting for anyone holding NVDA exposure.
RISK WARNING: CFDs are complex financial instruments and carry a high risk of losing money rapidly due to leverage. You should ensure you fully understand the risks involved and carefully consider whether you can afford to take the high risk of losing your money before trading.
Disclaimer: The information is provided for educational purposes only and doesn’t take into account your personal objectives, financial circumstances, or needs. It does not constitute investment advice. We encourage you to seek independent advice if necessary. The information has not been prepared in accordance with legal requirements designed to promote the independence of investment research. No representation or warranty is given as to the accuracy or completeness of any information contained within. This material may contain historical or past performance figures and should not be relied on. Furthermore estimates, forward-looking statements, and forecasts cannot be guaranteed. The information on this site and the products and services offered are not intended for distribution to any person in any country or jurisdiction where such distribution or use would be contrary to local law or regulation.
References
[1] “NVDA 1-Hour Chart Data” TradingView. Accessed on 22 September 2026.
[2] “Nvidia adds more than $400 billion in value after blowout earnings boost AI confidence – CNBC” https://www.cnbc.com/2026/08/27/nvidia-nvda-q2-earnings.html Accessed on 22 September 2026.
[3] “Jensen Huang Says Nvidia Will Sell Twice as Many Chips Next Year – CNBC, via Longbridge” https://longbridge.com/news/299353560 Accessed on 22 September 2026.
[4] “Nvidia Rises After Signalling Longer AI Spending Runway – Reuters, via Investing.com” https://www.investing.com/news/stock-market-news/nvidia-rises-after-signaling-longer-ai-spending-runway-4878530 Accessed on 22 September 2026.
[5] “NVDA Stock Quote – Morningstar” https://www.morningstar.com/stocks/xnas/nvda/quote Accessed on 22 September 2026.
[6] “Semiconductor Stocks Nvidia, AMD, and Intel Are Rising Today – 3 Catalysts Behind the AI Chip Rally – TipRanks” https://www.tipranks.com/news/ai-semiconductor-stocks-nvidia-amd-and-intel-are-rising-today-sept-21-whats-driving-the-rally Accessed on 22 September 2026.
[7] “Nvidia Stock Price Today | NASDAQ: NVDA Live – Investing.com” https://www.investing.com/equities/nvidia-corp Accessed on 22 September 2026.
The information has been prepared as of the date published and is subject to change thereafter. The information is provided for educational purposes only and doesn't take into account your personal objectives, financial circumstances, or needs. It does not constitute investment advice. We encourage you to seek independent advice if necessary. The information has not been prepared in accordance with legal requirements designed to promote the independence of investment research. No representation or warranty is given as to the accuracy or completeness of any information contained within. This material may contain historical or past performance figures and should not be relied on. Furthermore estimates, forward-looking statements, and forecasts cannot be guaranteed. The information on this site and the products and services offered are not intended for distribution to any person in any country or jurisdiction where such distribution or use would be contrary to local law or regulation.