


 Login





Why the Dow Jones Fell 352 Points as Treasury Yields Hit a 19-Year High: DJ30 CFD Analysis

Vantage Editorial Team >
Vantage Editorial Team >
Vantage is a global, multi-asset broker with a team of in-house writers and market analysts who produce educational and insightful trading content for traders of all levels.
 Updated Mon, 2026 October 5 02:39

- The Dow closed at 51,511.59 on 23 September, down 352.10 points (0.68%).1
- The 10-year Treasury yield rose above 5.10%, its highest since July 2007.1
Good news has turned awkward for the Dow Jones: US business activity grew at its fastest pace in over five years, and blue chips fell anyway, a week after the Federal Reserve (Fed) delivered its first hike since 2023.
This Dow Jones today analysis covers what moved the Dow Jones Industrial Average, the hourly chart, and the data ahead, as of 01:54 (UTC) / 09:54 (GMT+8) on 24 September 2026, via the Vantage DJ30 Contracts for Difference (CFDs) feed.
Why the Dow Jones Fell: The Short Answer
The Dow Jones Industrial Average fell 352.10 points to 51,511.59 on 23 September 2026 after the 10-year Treasury yield rose above 5.10%, its highest since July 2007. Hot business activity data and a weak five-year auction coincided with renewed bets on further Fed rate hikes.
Dow Jones Stock Market Today: 19-Year-High Yields Set the Tone
Anyone watching the Dow Jones stock market today saw a broad retreat: the S&P 500 lost 0.75% and the Nasdaq Composite 1.13%.1 Treasury losses deepened after a weak $70 billion five-year note sale, with Brent near $103.2
The Dow was already lagging: on 22 September, it shed 185 points while the Nasdaq closed at a record.3 Then Dow component McDonald’s sank 6% in afternoon trade after a lukewarm investor day.4
Procyon’s Massimo Santicchia called it “a tug of war” between strong earnings and inflationary pressure.1
Hot Purchasing Managers’ Data Added to Federal Reserve Hike Bets
The S&P Global flash US Composite Purchasing Managers’ Index (PMI) jumped to 58.4 from 56.0, its quickest expansion in over five years. S&P Global’s Chris Williamson was blunt: “US business continues to boom.” 5
Usually that cheers equities; this time it appeared to correlate with worries that the Fed has more work to do: policymakers voted 12-0 on 16 September to lift rates to 3.75% to 4.00%, and their average year-end projection rose to 4.1%.6
The Institute of International Finance’s Emre Tiftik said markets would be “looking for the tipping points” as rate-insensitive debt piles up.7 Our read: this looks less like a growth scare than a repricing of how long borrowing costs may stay high.
What the Dow Jones Chart Shows on the Hourly Timeframe
Checking the market today? Dow Jones index readings on the hourly Dow Jones chart show lower highs since a wick near 52,490 on 22 September, which gave way to a 700-point drop within hours (as of 09:54 (GMT+8), 24 September 2026).
At 51,429.40, the Dow Jones stock price proxy, the Vantage DJ30 CFD, sat below the 1H 50-period (51,909.30) and 200-period (52,062.86) moving averages. The Relative Strength Index (RSI) read 26.09 on the TradingView setup used for this analysis, below the 30 mark often labelled oversold, which describes momentum rather than signalling a turn (as of 09:54 (GMT+8), 24 September 2026).
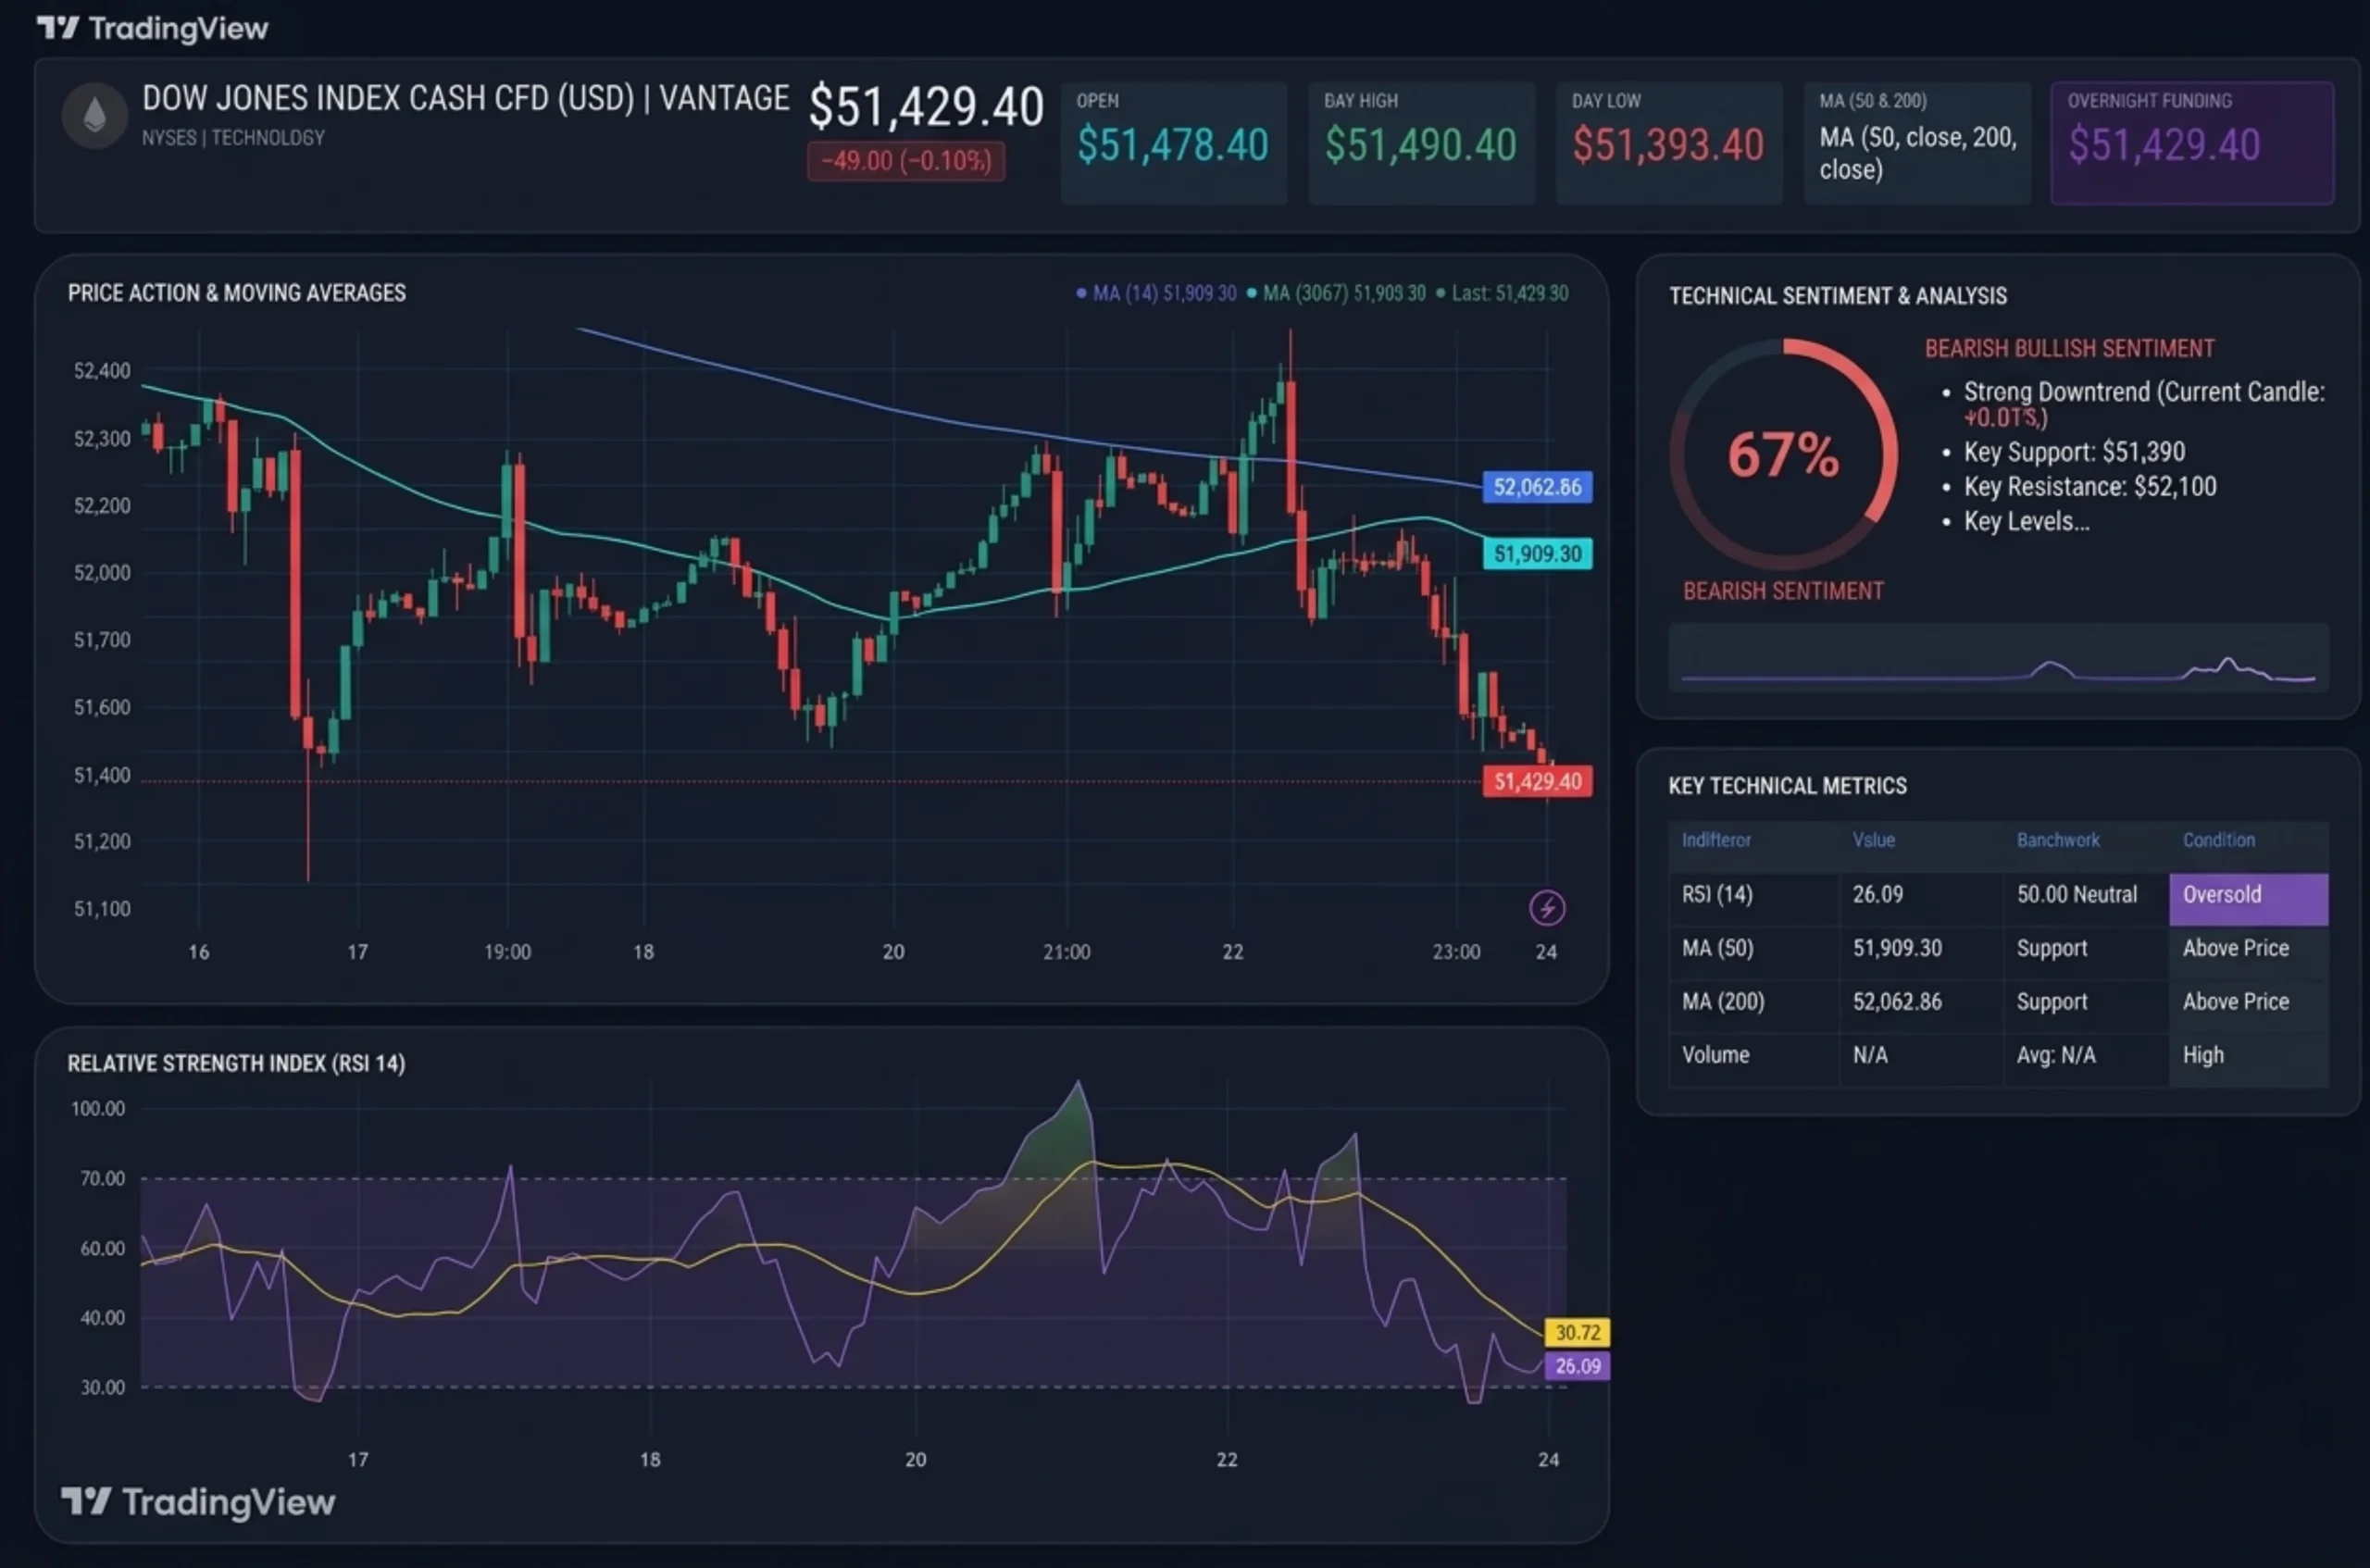
DJ30 1H “Dow Jones Chart Below Both Moving Averages” (TradingView, https://www.tradingview.com/symbols/VANTAGE-DJ30/) Accessed on 24 September 2026. Data indicative, for informational purposes only.
| Level | Chart Reference |
| 52,062.86 | 1H 200-Period Moving Average (price below it) |
| 51,909.30 | 1H 50-Period Moving Average (sloping lower) |
| Near 51,510 | 18 to 19 September Swing Low (price beneath it) |
| Near 51,210 | 16 September Wick Low, After the Fed Decision |
Table 1: DJ30 levels as of 09:54 (GMT+8), 24 September 2026; chart dates in UTC. Source: TradingView, Vantage DJ30 CFD.
Dow Jones Futures Today and the Data Still to Come
Whether you track Dow Jones futures live, Dow Jones stock markets futures, or the Dow Jones live DJ30 price (a cash CFD, not futures), here is the checklist:
- Initial Jobless Claims, 24 September: Claims land at 12:30 (UTC) / 20:30 (GMT+8), then new home sales.8
- Durable Goods and Sentiment, 25 September: Durable goods orders land with final Michigan sentiment.8
- Inflation and Growth, 30 September: August Personal Consumption Expenditures inflation lands with the third Q2 Gross Domestic Product estimate.8
- US and Iran Talks, Ongoing: Trump called the New York talks productive, with another meeting scheduled (see Iran News).9
See Dow Jones news and Indices News.
Managing Exposure on a Volatile Dow Jones Index Today
The DJ30 moved more than 500 points in two sessions, a reminder of how fast today’s Dow Jones index moves. A Stop Loss can help limit losses to a planned size, though gaps and slippage may push fills beyond it. Correlated SP500 or NAS100 index CFDs can add to overall exposure.
Leverage works both ways: it can magnify losses as quickly as returns, so a modest move in the Dow Jones share index may hit your account balance hard. Position sizing relative to account equity is one way traders manage that risk.
RISK WARNING: CFDs are complex financial instruments and carry a high risk of losing money rapidly due to leverage. You should ensure you fully understand the risks involved and carefully consider whether you can afford to take the high risk of losing your money before trading.
Disclaimer: The information is provided for educational purposes only and doesn’t take into account your personal objectives, financial circumstances, or needs. It does not constitute investment advice. We encourage you to seek independent advice if necessary. The information has not been prepared in accordance with legal requirements designed to promote the independence of investment research. No representation or warranty is given as to the accuracy or completeness of any information contained within. This material may contain historical or past performance figures and should not be relied on. Furthermore estimates, forward-looking statements, and forecasts cannot be guaranteed. The information on this site and the products and services offered are not intended for distribution to any person in any country or jurisdiction where such distribution or use would be contrary to local law or regulation.
References
[1] “Stock market news for Sept. 23, 2026 – CNBC” https://www.cnbc.com/amp/2026/09/22/stock-market-today-live-updates.html Accessed on 24 September 2026.
[2] “Stock Market Today: Dow, S&P Live Updates for September 23 – Bloomberg” https://www.bloomberg.com/news/articles/2026-09-22/stock-market-today-dow-s-p-live-updates Accessed on 24 September 2026.
[3] “United States Stock Market Index – Trading Economics” https://tradingeconomics.com/united-states/stock-market Accessed on 24 September 2026.
[4] “McDonald’s investor day: Remodels, training, chicken among growth plans – CNBC” https://www.cnbc.com/2026/09/23/mcdonalds-investor-day-remodels-training-chicken-growth-plans.html Accessed on 24 September 2026.
[5] “US S&P Global Composite PMI came in at 58.4 in September – FXStreet” https://www.fxstreet.com/news/sp-global-pmis-expected-to-show-resilient-us-economic-growth-in-september-202609230845 Accessed on 24 September 2026.
[6] “Fed Hikes in 12-0 Vote, Commits to Inflation Fight – Charles Schwab” https://www.schwab.com/learn/story/fomc-meeting Accessed on 24 September 2026.
[7] “Stock market today: Dow, S&P 500, Nasdaq tumble as 10-year Treasury yield surges to 2007 high – Yahoo Finance” https://finance.yahoo.com/markets/live/stock-market-today-wednesday-september-23-dow-sp-500-nasdaq-080556640.html Accessed on 24 September 2026.
[8] “Economic Indicators Calendar – Federal Reserve Bank of New York” https://www.newyorkfed.org/research/calendars/nationalecon_cal Accessed on 24 September 2026.
[9] “Stock Market Today (Sept. 23, 2026) – TheStreet” https://www.thestreet.com/stock-market-today/stock-market-today-dow-jones-sp-500-nasdaq-updates-sept-23-2026 Accessed on 24 September 2026.
The information has been prepared as of the date published and is subject to change thereafter. The information is provided for educational purposes only and doesn't take into account your personal objectives, financial circumstances, or needs. It does not constitute investment advice. We encourage you to seek independent advice if necessary. The information has not been prepared in accordance with legal requirements designed to promote the independence of investment research. No representation or warranty is given as to the accuracy or completeness of any information contained within. This material may contain historical or past performance figures and should not be relied on. Furthermore estimates, forward-looking statements, and forecasts cannot be guaranteed. The information on this site and the products and services offered are not intended for distribution to any person in any country or jurisdiction where such distribution or use would be contrary to local law or regulation.
