


 Login





Citigroup Stock Price Climbs 6% Before Q3 Earnings: Yields at 5.24% and What It Means for Citi Stock Traders

Vantage Editorial Team >
Vantage Editorial Team >
Vantage is a global, multi-asset broker with a team of in-house writers and market analysts who produce educational and insightful trading content for traders of all levels.
 Updated Wed, 2026 October 14 02:51

Citigroup stock price today is $131.94, up about 6% from its 7 October low, as of 13:34 (GMT+8) on 13 October 2026. The rebound sits 0.54% below the 50-period average ahead of Q3 results at about 20:00 (GMT+8), while 10-year Treasury yields stay near 5.24%.
Key Takeaways
- Citigroup (NYSE:C) sits 0.54% below its 50-period average ($132.65) and 2.76% above its 200-period average ($128.40).
- Consensus for results is near $2.65 in earnings per share (EPS) on $23.72B in revenue.
Here’s the odd part about Citigroup stock: it has climbed about 6% from its 7 October 2026 low near $124 to $131.94, as of 13:34 (GMT+8) on 13 October 2026 (05:34 UTC), while the 10-year Treasury yield camped near 5.24%.[1] The KBW Nasdaq Bank Index still sat more than 13% below its August peak.[2]
Results land at about 20:00 (GMT+8) tonight,[3] and that tug of war frames this piece: a rebounding Citi share price in a sector that hasn’t recovered. For traders of Contracts for Difference (CFDs), there’s a timing twist: results arrive about 90 minutes before the Vantage CITI share CFD session opens at 21:30 (GMT+8).

A 6% rebound leans on the 50-period line
It started with a drop on 1 October, a session when Bloomberg linked bank weakness to climbing Treasury yields.[4] A second low near $124 followed on 7 October, then higher highs. The Citigroup share price reclaimed the 200-period line (now at $128.40) last week and sits 0.54% under the 50-period line at $132.65, a low ceiling the last rally bumped into in late September. All levels are as of 13:34 (GMT+8) on 13 October 2026.
The 14-period Relative Strength Index (RSI) read 74.64 on the TradingView setup used for this analysis, a level conventionally labelled overbought. It covered roughly 60 points in eight sessions, a sprint most oscillators skip.
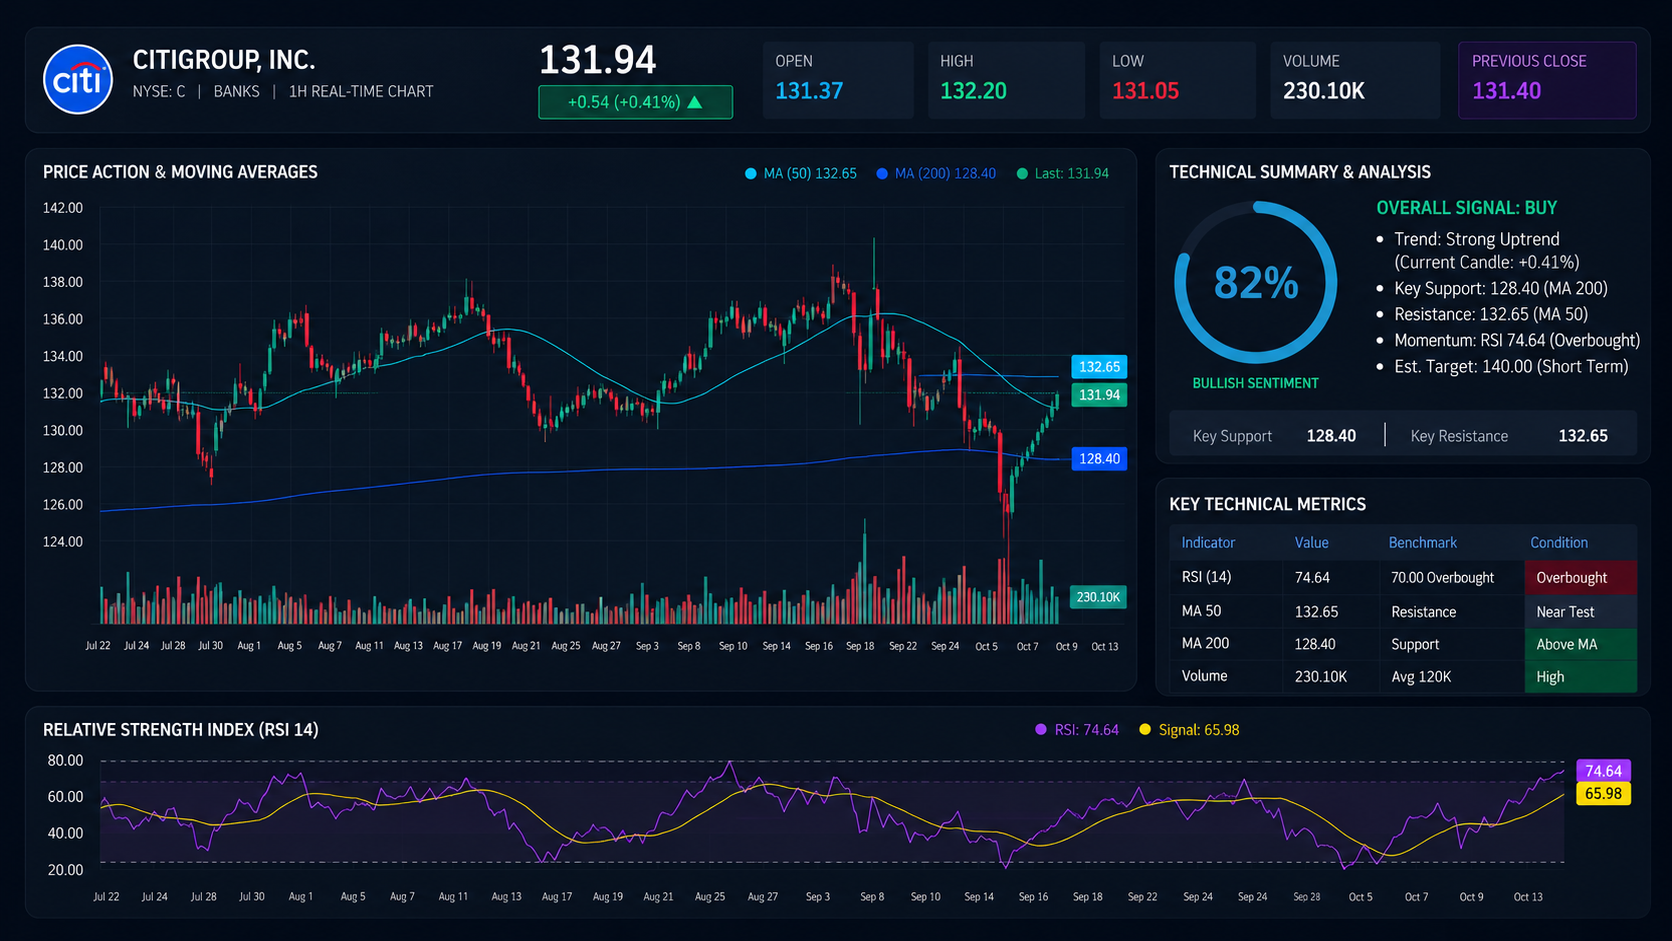
The chart shows where Citi sits. It doesn’t show what the market wants to hear at 20:00 (GMT+8).
Four beats, one drop: what analysts say about the bar
Citi has beaten estimates four quarters running,[5] yet the second-quarter beat on 14 July, with the highest quarterly revenue in a decade, still sent the stock down more than 4% as investors weighed unchanged guidance and higher spending.[6] Options are pricing a roughly 4% move this time.[7] Markets seem to grade this stock on a curve, and the curve is guidance.
Two analysts argue the slide has run ahead of the fundamentals for bank stocks. Truist’s Brian Foran noted that “estimate revisions are actually positive” while financials slid.[4] Wells Fargo’s Mike Mayo argued the AI worries behind the slide were overdone, writing that “trust at banks is a moat for deposits.”[8]
For the group, that appears to describe rates repricing while estimates held up. Citi itself is a slightly different case, with its EPS consensus about 1.5% lower than a month ago,[9] which leaves credit as the first test: net credit losses, delinquencies, and loan growth.[10]
Four straight beats, and the last one still sent the stock down more than 4%.
Credit and guidance set the bar. The chart marks what sits around it.
Five levels traders are watching
| Level | Reference | What the chart shows |
| Level 2 resistance | Near $134.70 | Late-September high on the hourly chart |
| Level 1 resistance | $132.65 | 50-period moving average, 0.54% above the latest hourly close |
| Latest hourly close | $131.94 | Overnight quote of $131.96 |
| Level 1 support | $128.40 | 200-period moving average, turned higher last week |
| Level 2 support | Near $124.00 | Lows of 1 October and 7 October |
Table 1: Five levels, one line each, as of 13:34 (GMT+8) on 13 October 2026. Reference levels, not trade signals. Source: TradingView chart used for this analysis. Indicative only.
Those levels raise the questions readers search most, so here are short answers.
Quick answers on Citi stock
Is Citibank stock the same as Citigroup stock?
Citibank, N.A. is a wholly owned subsidiary of Citigroup Inc.[11] So citibank stock, citi bank stock, and Citi Group stock lead to Citigroup Inc. The citibank stock price, citi bank share price, and Citi Group share price are one quote, so the stock price for Citi is $131.94. The Citigroup stock NYSE ticker is C, and Citigroup Inc stock is the CITI share CFD at Vantage.
Will Citi stock recover, and is there a Citigroup stock forecast 2026?
It has recovered about 6% from the 7 October low, and the Citi stock price today sits 10.83% below the 52-week high of $147.96.[12] Vantage doesn’t publish price forecasts, so for a Citi bank stock forecast this piece offers what is observable: consensus and the dated catalysts below.
Both answers lean on rates, and rates are where the next 48 hours matter.
Inflation data, the Fed, and the risk around the print
After the Fed’s 16 September hike to 3.75% to 4.00%,[13] September Consumer Price Index (CPI) data is next, with consensus for headline inflation up 0.6% on the month and core up 0.2%.[14]
- Citigroup results, 13 October: About 20:00 (GMT+8).[3] Guidance, expenses, and credit may come up.[10]
- US CPI (September), 14 October: 20:30 (GMT+8). Core is the cleaner inflation read.[14]
Back to the tug of war: Citi rebounded without waiting for yields to cooperate. The read of a repaired chart weakens if price closes back below the 200-period line near $128.40; the read of a capped rebound weakens if price closes above the 50-period line near $132.65.
Gap risk sits in that 90-minute window, and a Stop Loss is a planned exit with no guarantee: it can help limit a loss to a planned size, but a gap can fill it at a worse price. Four large US banks report the same morning.[1]
Leverage works both ways. For UK retail clients, leverage on individual share CFDs such as CITI is capped at 1:5, which means a margin requirement of 20% of the position’s value. At that level, a move the size of the roughly 4% options are pricing, in either direction, would change the value of the margin committed by about a fifth. That’s arithmetic and says nothing about direction.
Related Reading
- S&P 500 Futures Barely Move Before JPMorgan and Goldman Report (Market News)
- US10Y: 10-Year Yield Tops 5% as Oil, Fed Bets Collide (Market Analysis)
RISK WARNING: CFDs are complex financial instruments and carry a high risk of losing money rapidly due to leverage. You should ensure you fully understand the risks involved and carefully consider whether you can afford to take the high risk of losing your money before trading.
Disclaimer: The information is provided for educational purposes only and doesn’t take into account your personal objectives, financial circumstances, or needs. It does not constitute investment advice. We encourage you to seek independent advice if necessary. The information has not been prepared in accordance with legal requirements designed to promote the independence of investment research. No representation or warranty is given as to the accuracy or completeness of any information contained within. This material may contain historical or past performance figures and should not be relied on. Furthermore estimates, forward-looking statements, and forecasts cannot be guaranteed. The information on this site and the products and services offered are not intended for distribution to any person in any country or jurisdiction where such distribution or use would be contrary to local law or regulation.
References
[1] “Bracing for Busy Week: Bank Earnings, CPI Ahead – Charles Schwab” https://www.schwab.com/learn/story/stock-market-update-open Accessed on 13 October 2026.
[2] “Stock market today: Dow gains, S&P 500 and Nasdaq slip as focus turns to earnings season kickoff – Yahoo Finance” https://finance.yahoo.com/markets/live/stock-market-today-monday-october-12-dow-sp-500-nasdaq-080321571.html Accessed on 13 October 2026.
[3] “Citi Third Quarter 2026 Earnings Call – Citigroup” https://www.citigroup.com/global/news/press-release/2026/citi-third-quarter-2026-earnings-call Accessed on 13 October 2026.
[4] “Bank Stocks Sink Further Into Correction as Citigroup Tumbles – Bloomberg News via AdvisorHub” https://www.advisorhub.com/bank-stocks-sink-further-into-correction-as-citigroup-tumbles/ Accessed on 13 October 2026.
[5] “Citigroup earnings preview: What could drive C stock tomorrow – Investing.com” https://www.investing.com/news/stock-market-news/citigroup-earnings-preview-what-could-drive-c-stock-tomorrow-93CH-4944173 Accessed on 13 October 2026.
[6] “Citi Shares Fall as Investor Worry Over Expenses Overshadows Second-Quarter Profit Beat – Reuters via U.S. News” https://money.usnews.com/investing/news/articles/2026-07-14/citi-profit-jumps-45-on-investment-banking-trading-strength Accessed on 13 October 2026.
[7] “Earnings Volatility Watch: JPMorgan, Goldman Kick Off Q3 Season, But These 10 Stocks Are Priced For Bigger Swings – Benzinga” https://www.benzinga.com/markets/earnings/26/10/62289540/earnings-volatility-watch-big-banks-home-bancshares-manpowergroup-implied-moves-october-2026 Accessed on 13 October 2026.
[8] “Mike Mayo Says AI ‘Scare Trade’ Hit to Bank Stocks Is Overdone – Bloomberg” https://www.bloomberg.com/news/articles/2026-09-30/mike-mayo-says-ai-scare-trade-hit-to-bank-stocks-is-overdone-muob2qf7 Accessed on 13 October 2026.
[9] “Citigroup (C) Q3 2026 Preview: EPS Est. $2.62, Reports October 13 – AlphaStreet” https://news.alphastreet.com/citigroup-c-q3-2026-preview-eps-est-2-62-reports-october-13/amp/ Accessed on 13 October 2026.
[10] “Citigroup Reports Q3 Earnings on October 13 After a Yield-Driven Bank Selloff. Here’s What the Stock Needs to Show – TIKR via Yahoo Finance” https://finance.yahoo.com/markets/stocks/articles/citigroup-reports-q3-earnings-october-160451058.html Accessed on 13 October 2026.
[11] “Basis of Presentation (Policies), Citigroup Form 10-Q for the period ended 30 September 2014 – SEC” https://www.sec.gov/Archives/edgar/data/831001/000083100114000136/R35.htm Accessed on 13 October 2026.
[12] “C: Citigroup Inc. – Stock Price, Quote and News – CNBC” https://www.cnbc.com/quotes/C Accessed on 13 October 2026.
[13] “Fed approves interest rate hike, signals one more to come this year – CNBC” https://www.cnbc.com/2026/09/16/fed-rate-decision-september-2026.html Accessed on 13 October 2026.
[14] “U.S. inflation data preview: September CPI and what it means for markets – Investing.com” https://www.investing.com/news/stock-market-news/us-inflation-data-preview-september-cpi-and-what-it-means-for-markets-93CH-4945005 Accessed on 13 October 2026.
The information has been prepared as of the date published and is subject to change thereafter. The information is provided for educational purposes only and doesn't take into account your personal objectives, financial circumstances, or needs. It does not constitute investment advice. We encourage you to seek independent advice if necessary. The information has not been prepared in accordance with legal requirements designed to promote the independence of investment research. No representation or warranty is given as to the accuracy or completeness of any information contained within. This material may contain historical or past performance figures and should not be relied on. Furthermore estimates, forward-looking statements, and forecasts cannot be guaranteed. The information on this site and the products and services offered are not intended for distribution to any person in any country or jurisdiction where such distribution or use would be contrary to local law or regulation.
