


 Login





[DAILY TRADING] AMZN Analysis 28 July 2026 – Amazon Stock Coils Below Its Key Averages Before Earnings

Vantage Editorial Team >
Vantage Editorial Team >
Vantage is a global, multi-asset broker with a team of in-house writers and market analysts who produce educational and insightful trading content for traders of all levels.
 Updated Tue, 2026 August 4 09:01

Amazon (NASDAQ: AMZN) traded at $231.43 as of 06:04 (UTC) on 28 July 2026, or 14:04 (GMT+8), according to the Vantage AMZN CFD feed. That’s down $0.34, or 0.15%, on the latest 15-minute candle. Two days ahead of Amazon’s Q2 earnings, AMZN stock price today looks like a stock waiting for permission to move, not one building conviction.
What the AMZN chart is showing right now
The most recent 15-minute candle on the Vantage AMZN CFD feed opened at $231.78, ranged between a low of $231.22 and a high of $231.90, and closed at $231.43. Volume on the candle came in at 278.77K, per the Vantage CFD feed.
Amazon’s share price topped out above $258 around 15–16 July 2026, then rolled over hard, falling below its 200-period moving average around 20–21 July 2026 before extending the decline on 22–23 July 2026. Since that drop, AMZN has settled into a narrower band, roughly $230.00 to $236.00, and the last few candles have drifted toward the bottom of it rather than the top.
Both moving averages on the chart currently sit above where AMZN stock price today is trading. The 50-period average reads $242.53 and has been sliding since mid-July, while the 200-period average reads $232.67, per the chart header legend used for this analysis, almost exactly where price now sits. Amazon is below both moving averages, although price remains relatively close to the 200-period average.
The Relative Strength Index sits at 39.89, with its moving average reading 44.38, per the TradingView setup used for this analysis. Both readings sit below the neutral 50 mark, consistent with the recent pullback, though the RSI remains above the conventional oversold threshold of 30, which it briefly fell below during the 22–23 July 2026 decline. This isn’t a stock screaming for a bounce, just one in a holding pattern, waiting on Thursday’s earnings report.
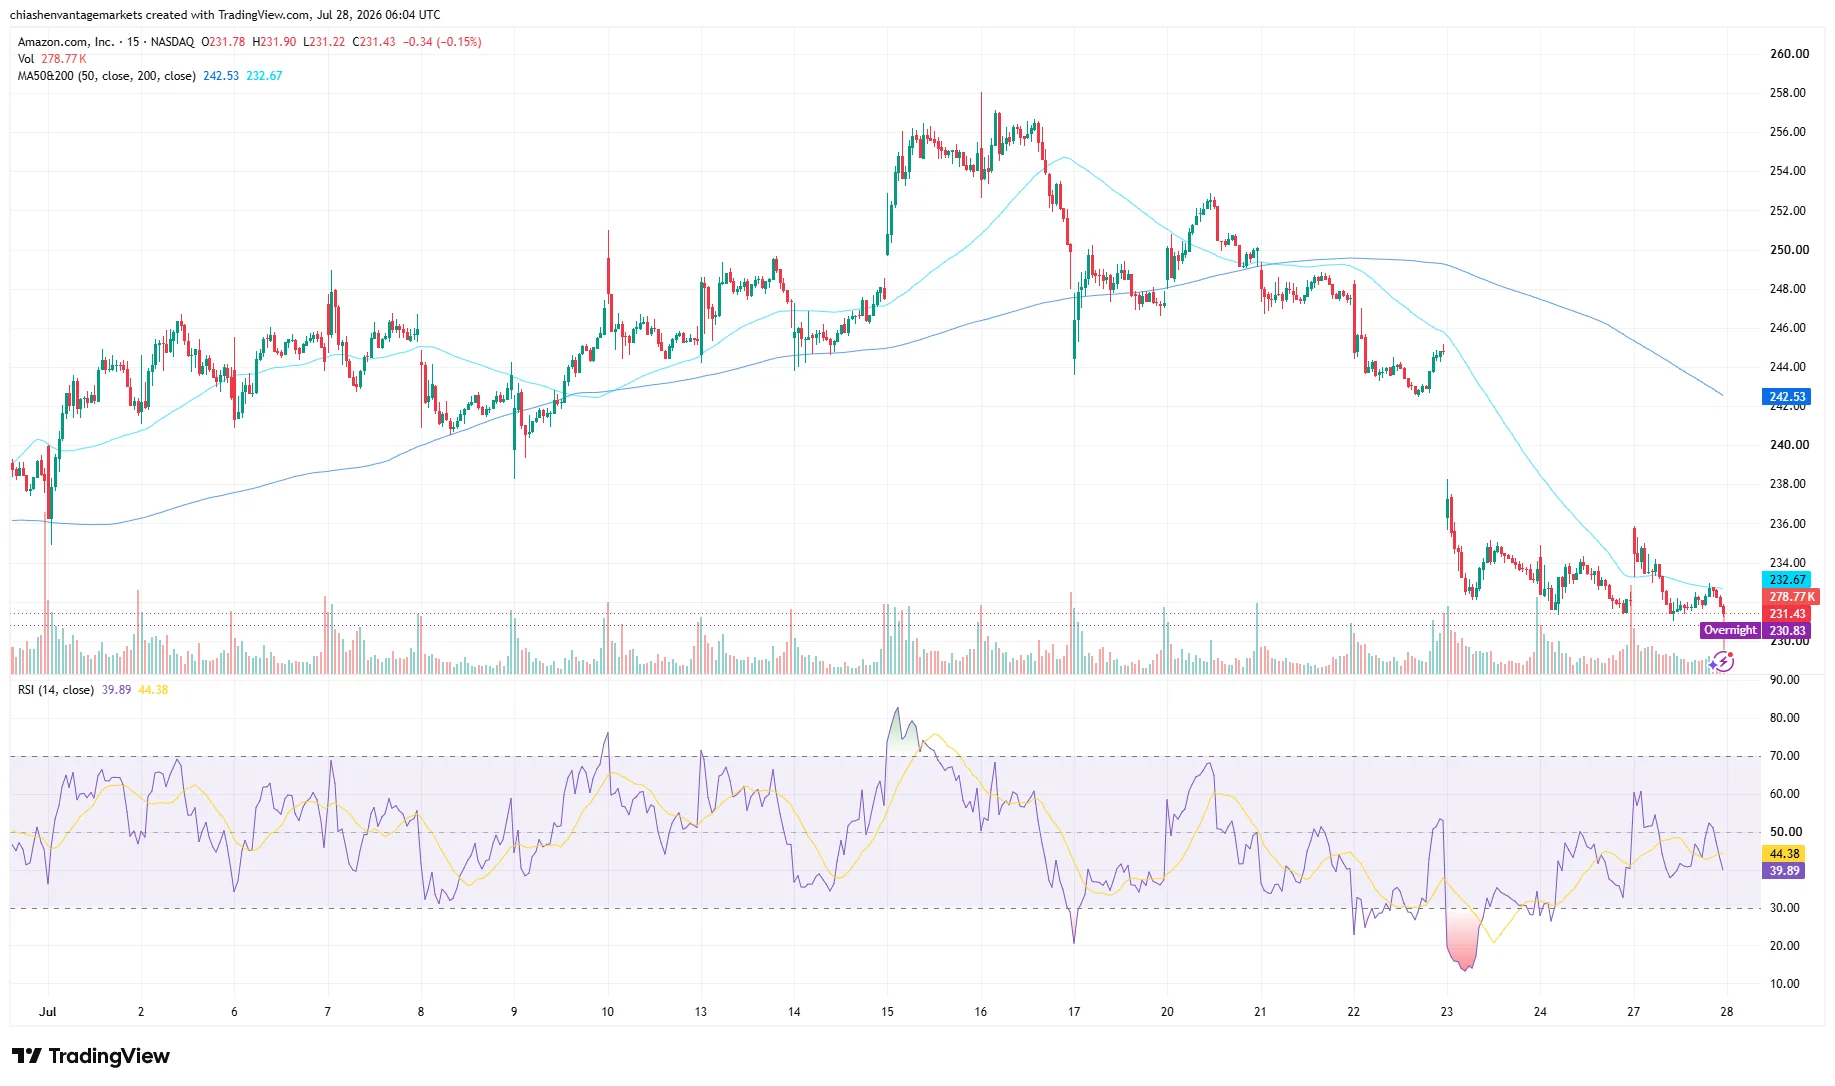
Figure 1: AMZN 15-Minute Chart, price consolidating below the 50- and 200-period moving averages ahead of Q2 earnings (TradingView, https://www.tradingview.com/symbols/NASDAQ-AMZN/) Accessed on 28 July 2026. Data indicative, for informational purposes only.
AWS, capex, and the AMZN stock forecast into earnings
Amazon’s earnings date is set for 30 July 2026, per the company’s own investor relations announcement.[1] Wall Street currently expects revenue near $196.71 billion for the quarter, with earnings around $1.82 a share, based on estimates tracked by TipRanks and cited by TheStreet.[2] The Motley Fool puts it simpler: analysts are looking for revenue and earnings per share up roughly 17% and 8%, year-over-year. New to the name? Vantage’s Amazon stock outlook covers the fundamentals.[3]
AWS is the number everyone’s circling. It grew 28% year-over-year in Q1, its fastest pace in 15 quarters, and several banks are reportedly lifting their AWS forecasts ahead of Thursday.[2][4] Whether that streak held into Q2 is the biggest question this report needs to answer.
Then there’s the spending side, where the AMZN stock forecast conversation gets less comfortable. Moody’s Ratings said this month that unprecedented AI infrastructure spending is pressuring the credit quality of the six hyperscalers it tracks, Amazon included, with capital expenditure (“capex”) across the group projected to approach $785 billion in 2026.[5] TradingKey’s July note flagged the same tension: fast AWS growth against a spending plan that has pushed free cash flow lower.[7] More constructively, Amazon’s chips business, including Graviton, Trainium and Nitro, topped a $20 billion annual revenue run rate in Q1, growing at a triple-digit percentage year over year.[8]
Not every signal points the same way, either. UBS lifted its 12-month price outlook on Amazon to $271 from $249 on Monday, keeping its constructive stance on the stock and citing higher expected gross merchandise value and advertising revenue.[6]
Put together, there’s no clean AMZN stock forecast here, a genuinely split setup, leaving Thursday’s earnings report as the next major catalyst for the stock.
Levels to watch
The table below covers the zones traders are watching on the AMZN chart heading into the earnings report. Amazon is one of several hundred names available through Vantage’s Stocks Trading suite of share CFDs. These are reference levels, not trade signals.
| Level | Price | What’s happening |
| Potential Support | ~$230.00 | Multi-session low zone, tested repeatedly since 23 July |
| Pivot (200-period MA) | $232.67 | Current price sits just below this average |
| Potential Resistance (50-period MA) | $242.53 | Dynamic technical reference above current price |
| Broader potential resistance | ~$255–$258 | Mid-July peak zone before the reversal |
Table 1: Key levels on the AMZN 15-minute chart as of 06:04 (UTC) / 14:04 (GMT+8), 28 July 2026. Source: TradingView, Vantage AMZN CFD feed. Indicative only.
What to watch this week
- Q2 Earnings, 30 July: Amazon reports after the US market close; AWS growth and any capex update are likely to drive the next wave of AMZN stock news.[1]
- AWS Growth Rate: Consensus estimates sit close to the range analysts flagged heading into the report, with several banks revising their AWS forecasts higher.[2]
- Capex Commentary: Moody’s recent note on hyperscaler debt levels gives useful context for how the market may respond to any capital spending update.[5]
Price swings around earnings can occur quickly in either direction, making recent trading ranges and volatility useful context when assessing risk around the release.
Amazon CFDs, like all CFD products, trade with leverage, which magnifies both gains and losses, making overall risk exposure particularly relevant around scheduled earnings events that can move a stock outside its recent trading range.
RISK WARNING: CFDs are complex financial instruments and carry a high risk of losing money rapidly due to leverage. You should ensure you fully understand the risks involved and carefully consider whether you can afford to take the high risk of losing your money before trading.
Disclaimer: The information is provided for educational purposes only and doesn’t take into account your personal objectives, financial circumstances, or needs. It does not constitute investment advice. We encourage you to seek independent advice if necessary. The information has not been prepared in accordance with legal requirements designed to promote the independence of investment research. No representation or warranty is given as to the accuracy or completeness of any information contained within. This material may contain historical or past performance figures and should not be relied on. Furthermore estimates, forward-looking statements, and forecasts cannot be guaranteed. The information on this site and the products and services offered are not intended for distribution to any person in any country or jurisdiction where such distribution or use would be contrary to local law or regulation.
References
[1] “Amazon.com to Webcast Second Quarter 2026 Financial Results Conference Call – Amazon.com, Inc. Investor Relations” https://ir.aboutamazon.com/news-release/news-release-details/2026/Amazon-com-to-Webcast-Second-Quarter-2026-Financial-Results-Conference-Call/default.aspx Accessed on 28 July 2026.
[2] “Amazon’s AWS may deliver a July 30 earnings beat – TheStreet” https://www.thestreet.com/investing/amazon-aws-q2-2026-earnings-preview Accessed on 28 July 2026.
[3] “Should You Buy Amazon Stock Before July 30? – The Motley Fool” https://www.fool.com/investing/2026/07/26/should-you-buy-amazon-stock-before-july-30/ Accessed on 28 July 2026.
[4] “AWS earnings Q1 2026 – CNBC” https://www.cnbc.com/2026/04/29/aws-earnings-q1-2026.html Accessed on 28 July 2026.
[5] “Moody’s says ‘unprecedented’ AI spending threatens credit quality of Amazon, Meta, Alphabet and others – CNBC” https://www.cnbc.com/2026/07/24/moodys-ai-spending-credit-quality-amazon-meta-alphabet.html Accessed on 28 July 2026.
[6] “Amazon (AMZN) Stock Climb on Massive Price Target Hike From UBS – GuruFocus” https://tr.tradingview.com/news/gurufocus:7ee74aad6094b:0-amazon-amzn-stock-climb-on-massive-price-target-hike-from-ubs Accessed on 28 July 2026.
[7] “Amazon (AMZN) Stock Price Forecast: AWS Hit Its Fastest Growth in 15 Quarters – Does $200B Capex Matter? – TradingKey” https://www.tradingkey.com/analysis/stocks/us-stocks/262026432-amazon-amzn-stock-forecast-july-2026-aws-28-percent-capex-q2-earnings-tradingkey Accessed on 28 July 2026.
[8] “Amazon Q1 2026 earnings beat as AWS growth hits 15-quarter high – Yahoo Finance” https://finance.yahoo.com/markets/stocks/articles/amazon-q1-2026-earnings-beat-203149838.html Accessed on 28 July 2026.
The information has been prepared as of the date published and is subject to change thereafter. The information is provided for educational purposes only and doesn't take into account your personal objectives, financial circumstances, or needs. It does not constitute investment advice. We encourage you to seek independent advice if necessary. The information has not been prepared in accordance with legal requirements designed to promote the independence of investment research. No representation or warranty is given as to the accuracy or completeness of any information contained within. This material may contain historical or past performance figures and should not be relied on. Furthermore estimates, forward-looking statements, and forecasts cannot be guaranteed. The information on this site and the products and services offered are not intended for distribution to any person in any country or jurisdiction where such distribution or use would be contrary to local law or regulation.
