
CFDs and Spread Bets are complex instruments and come with a high risk of losing money rapidly due to leverage. 72.65% of retail investor accounts lose money when trading CFDs and Spread Bets with this provider. You should consider whether you understand how CFDs and Spread Bets work and whether you can afford to take the high risk of losing your money.


 Login


SEARCH
-
Search query too short. Please enter a full word or phrase.
-

Keywords
Popular Search


SEARCH
-
Search query too short. Please enter a full word or phrase.
-
Keywords
Popular Search



 Market Analysis Daily Analysis Gold On a Roller Coaster Ride Alongside Wall Street Before Payrolls – XAUUSD Analysis
CommoditiesCommodities NewsCommodity Market NewsFeatured NewsFederal Reserve NewsFinancial NewsGoldGold NewsGold News TodayGold Price NewsInterest Rate NewsMarket News TodayNFP NewsTechnical AnalysisTrending NewsVantage News
Gold On a Roller Coaster Ride Alongside Wall Street Before Payrolls – XAUUSD Analysis

Vantage Editorial Team >
10 November 2026 | Daily Analysis | 16 min read
Vantage Editorial Team >
Vantage is a global, multi-asset broker with a team of in-house writers and market analysts who produce educational and insightful trading content for traders of all levels.

Key Takeaways
- Vantage XAUUSD traded at $4,062.97 at 10:07 (GMT+8) on 6 November 2026, about 2% below the 5 November high near $4,145.
- Gold’s rebound from the 30 October one-year low measured about 7% before pausing at the 4H 200-period moving average at $4,124.75.
- US October payrolls land at 21:30 (GMT+8) tonight, with a consensus of 65,000 jobs after September’s 29,000.
Gold price today sat at $4,062.97 on the Vantage XAUUSD feed, about 2% below Thursday’s two-week high, even though Bloomberg reported bullion was on track for its biggest weekly gain since August. 1 All figures are as of 10:07 (GMT+8) on 6 November 2026.
On paper, everything lined up for gold: the dollar and Treasury yields fell after Democrats won both chambers of Congress. 2 Yet the rally stalled at the one line on our 4-hour (4H) chart that had sat above every candle since 6 October, and gold eased as US stocks had their worst session since April 2025. 3
So the XAUUSD news today is less about what lifted gold and more about what stopped it. This XAUUSD analysis today unpacks why gold gave ground while yields kept easing, and what that changes about the risk picture before US Nonfarm Payrolls (NFP) at 21:30 (GMT+8) tonight.
As of 10:07 (GMT+8) on 6 November 2026, the XAUUSD price on the Vantage feed was $4,062.97, 0.62% lower on the current 4H candle; the 52-week range ran from a low near $3,875 on 30 October to January’s record of $5,595. 4,5
Why Did the Gold Price Slip Today?
The gold price slipped on 6 November 2026 as Thursday’s equity slide coincided with investors trimming bullion to cover stock losses, even while the dollar and yields eased after the midterms. Vantage XAUUSD traded at $4,062.97, about 2% below the $4,145 high, before tonight’s payrolls.
Two forces pulled gold in opposite directions this week. Here is how they compare.
Table 1: Gold’s Two Drivers This Week, Compared
| Driver | When | What Moved | How Gold Reacted |
| Midterm Results | 4 to 5 November | Dollar and Treasury yields eased 2 | Rose about 7% from the 30 October low to a high near $4,145 |
| Equity Slide | 5 November | Nasdaq Composite closed about 5.5% lower 3 | Gave back about 2%; some investors trimmed bullion to cover stock losses 1 |
| Fed Pricing | 28 October to 5 November | December hike odds eased from 82.6% to about 69% 6,7 | Supportive at the margin, but a hike stayed more likely than not |
Table 1: Gold moves read from the Vantage XAUUSD 4H chart on TradingView as of 10:07 (GMT+8), 6 November 2026. Driver data from Kitco, Seeking Alpha, Bloomberg, Fox Business, and CoinDesk, as cited.
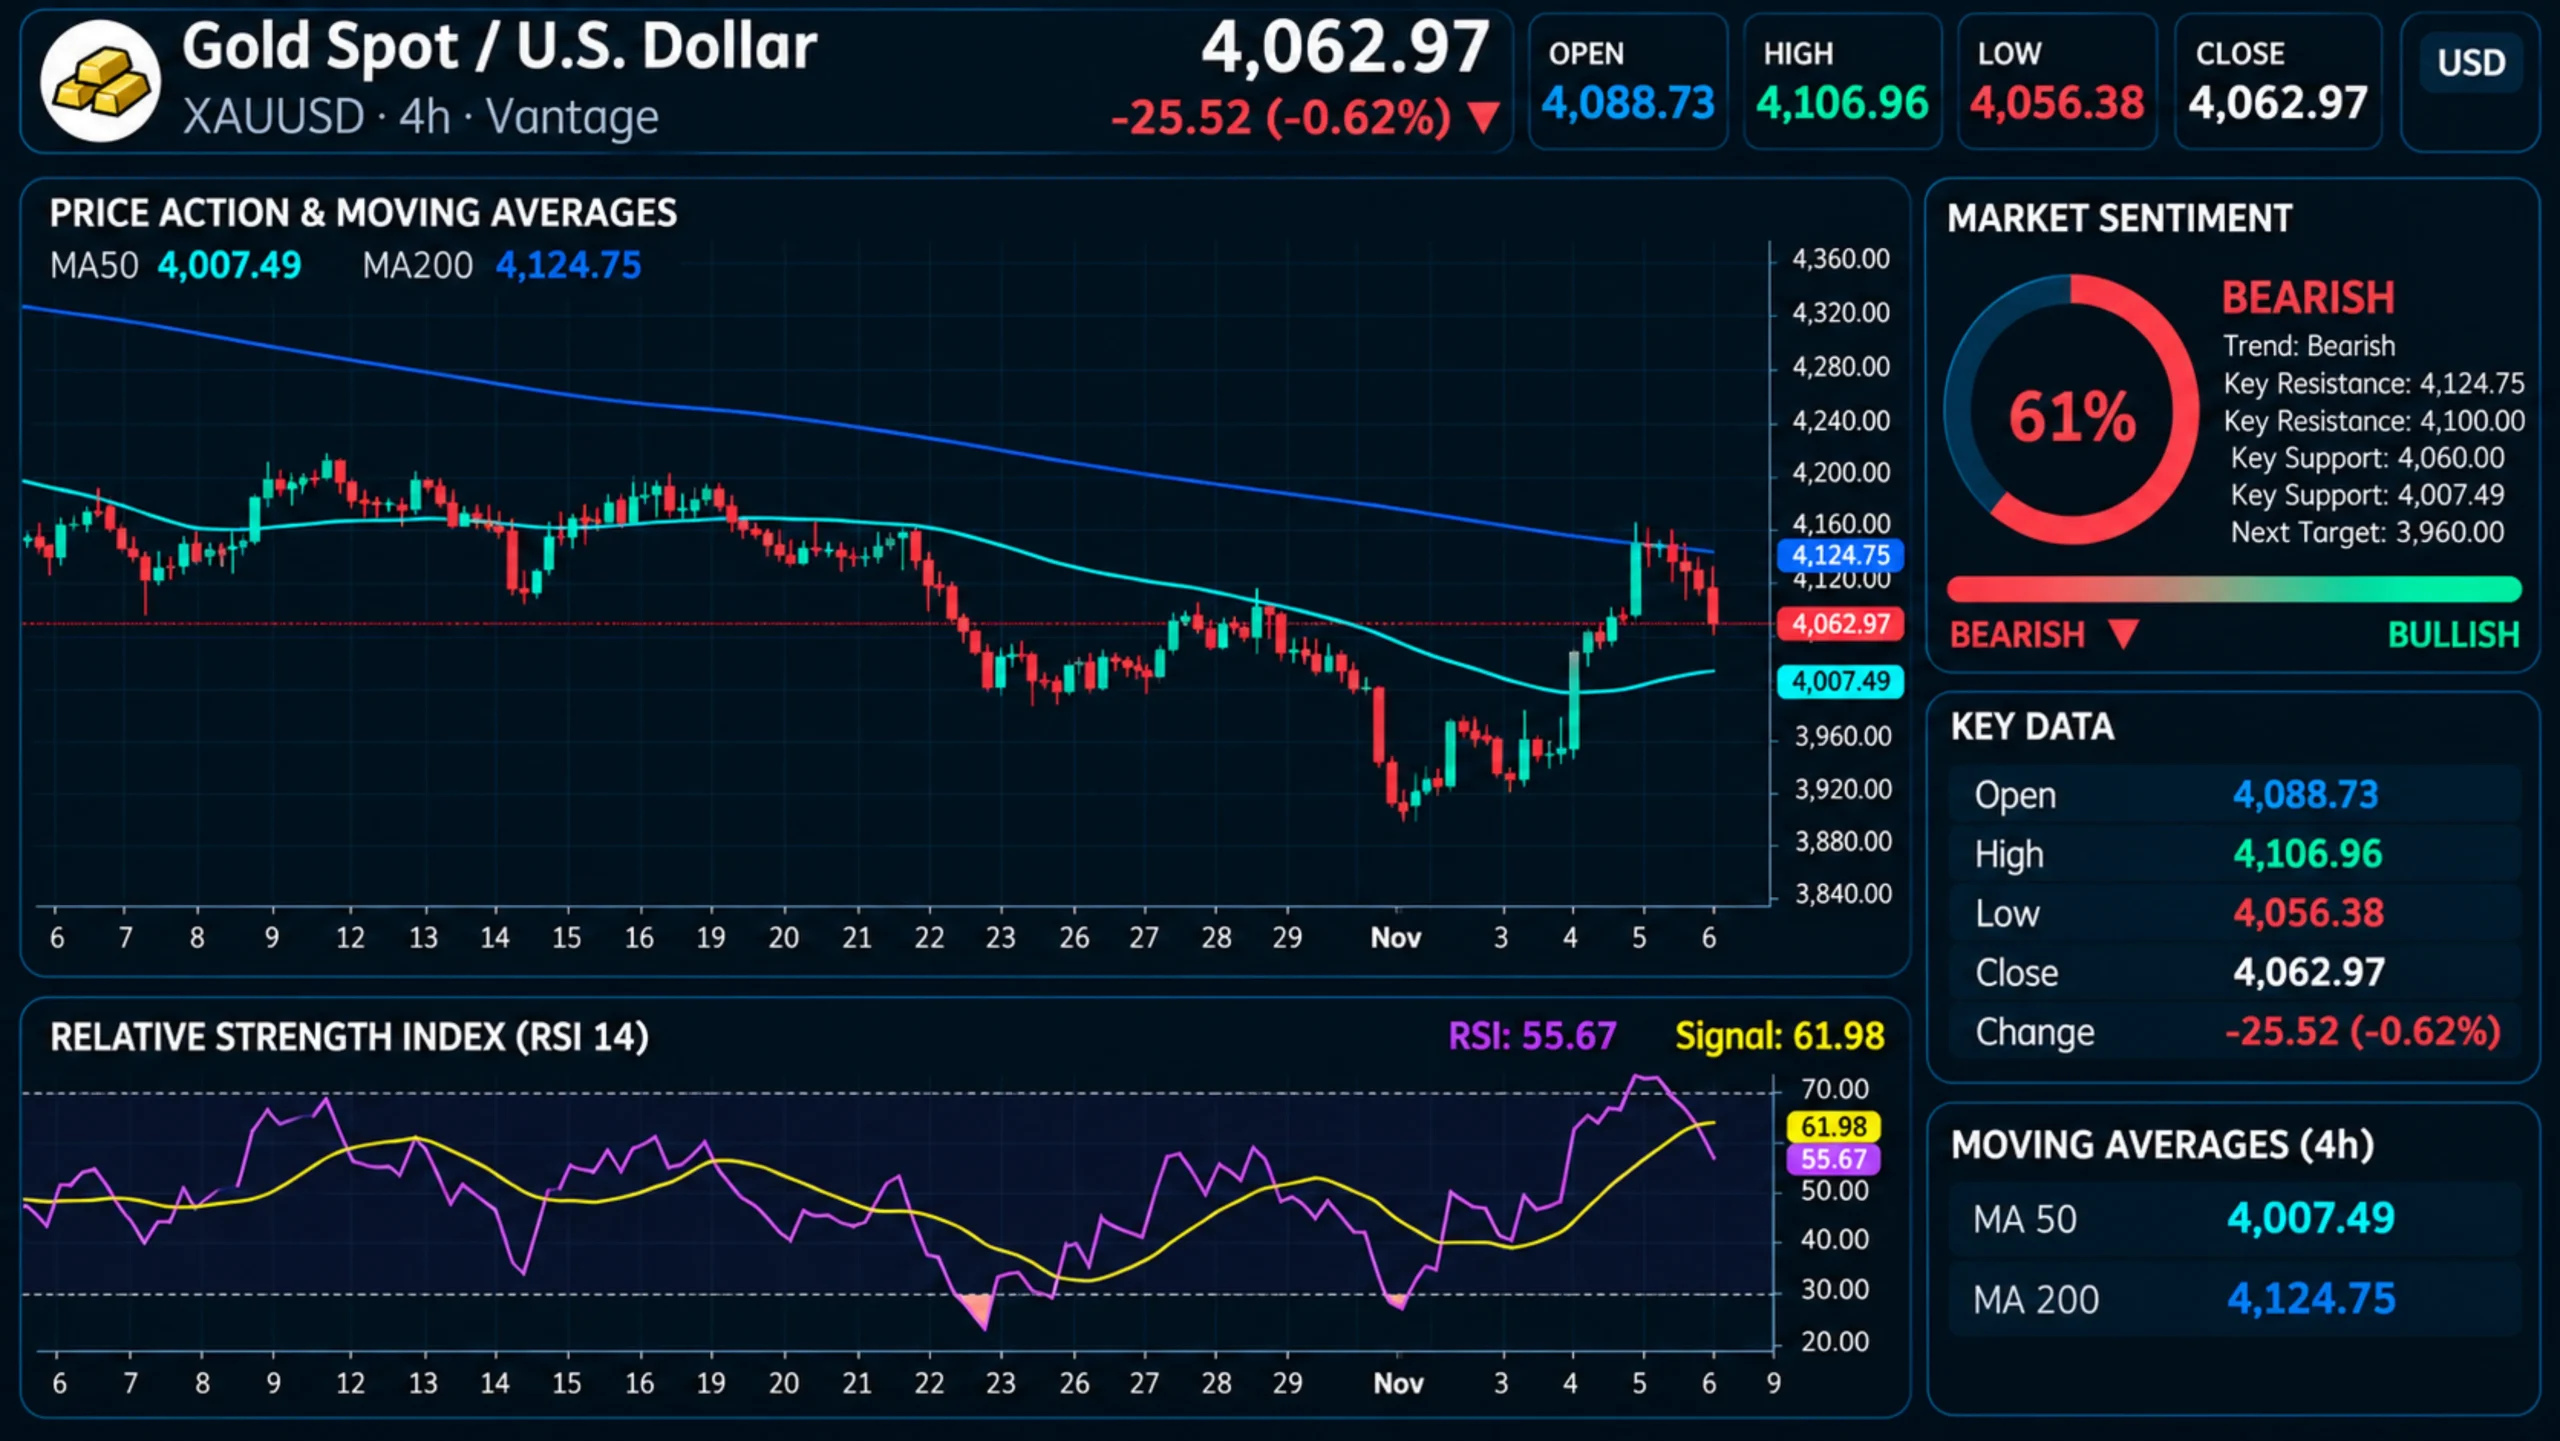
The chart shows exactly where the rally hit its ceiling.
XAUUSD Technical Analysis: The 200-Period Line Held
Our gold technical analysis today starts with a V. On the 4H XAUUSD chart, price fell to a low near $3,875 on 30 October, a one-year low according to Kitco, 5 held a $3,900 to $3,975 band on 2 and 3 November, then climbed to a high near $4,145 on 5 November.
That’s a gain of about 7% in four sessions (4,145 ÷ 3,875 = 1.07). The high printed as a wick through the 200-period moving average (MA), which read $4,124.75 at the cut-off, and the candles that followed closed back beneath it. Price has since handed back about 2%, so the line that capped October has held so far.
Below price, the 50-period MA read $4,007.49 and had started to curl higher after sliding through late October. That leaves gold wedged in a $117 gap between the two averages: recovered on the short-term trend, not yet on the October one.
Momentum got there first. The 14-period Relative Strength Index (RSI) on the TradingView setup used for this analysis rose above 70 on 5 November, then fell to 55.67 by the cut-off, below its signal line at 61.98. It had dipped below 30 twice in late October, which is a lot of travel for one indicator in a fortnight. Price held most of the rally. Momentum did not.
This XAUUSD technical analysis shows where the rally paused. It doesn’t explain why gold gave ground on a day yields were still easing.
Midterms Moved the Dollar, Not the Fed
The first leg of the rally belonged to politics. Democrats secured majorities in both chambers of Congress, and the dollar and Treasury yields moved lower, Kitco reported. 2 By Thursday, Reuters reported spot gold up 1.9% at $4,134.83, its highest since 22 October, while the December gold price future rose 1.8% to $4,144.20. 8
Some of the support was there before anyone voted. Julius Baer analyst Carsten Menke told Reuters that “deficits should persist no matter the outcome of the midterms,” which he framed as a longer-term support for gold. 9 Official buyers stayed busy too: central banks added 321 tonnes to reserves in Q3, up 42% on a year earlier, and the World Gold Council’s Louise Street said “Gold ETF inflows came roaring back”. 4
What barely moved was the Federal Reserve (Fed). The Federal Open Market Committee (FOMC) held at 3.75% to 4.00% on 28 October in a 10 to 2 vote, with two members preferring a hike, and said economic activity “is expanding at a strong pace”. 10
If you came here for gold rate expectations, the rate that matters most this week is the Fed’s. CME FedWatch put the odds of a December hike at 82.6% after the decision, Fox Business reported, 6 and at about 69% on 5 November, according to CoinDesk. 7 Gold headed for its best week since August while futures still priced a hike as more likely than not. The textbook doesn’t usually draw it that way.
Lower yields and a softer dollar explain the climb. They don’t explain Thursday’s slip.
Wall Street’s Slide Pulled Gold Back
The pullback tracked equities, not rates. On 5 November the Nasdaq Composite closed about 5.5% lower and the S&P 500 had its worst session since April 2025, 3 a broad market slide that reached well beyond tech. Bloomberg reported that gold’s weekly rally was tempered as some investors trimmed bullion to cover losses in equities. 1
We’ve seen this film once already this autumn. On 30 October, the day gold set its one-year low, Kitco described traders frustrated that bullion fell even as the dollar and bond yields weakened. 5 Two sessions don’t make a rule, and we aren’t treating them as one.
Here’s our read: gold’s link to yields held on the way up, but on days of sharp equity losses, bullion appears to have behaved more like a cash machine than a safe-haven asset. That second-order effect sits outside the rates story, and it’s easy to miss when the two drivers are read one at a time.
Gold climbed about 7% in four sessions, then paused at a line that had sat above every 4H candle since 6 October.
Which gives tonight’s payrolls two routes to gold: through yields, and through the equity mood.
Gold Support and Resistance Today Before Payrolls
Here are the levels on the Vantage 4H chart that traders are watching. Think of them as landmarks, not signals.
Table 2: XAUUSD 4H Levels as of 10:07 (GMT+8), 6 November 2026
| Level | Price (USD) | What the Chart Shows |
| Recent Swing High | Near 4,145 | 5 November high; a wick through the 200-period MA |
| 200-Period MA | 4,124.75 | Sat above every 4H candle from 6 October until 5 November |
| Late-October Highs | Near 4,085 | 28 to 29 October swing highs, just above the last price |
| 50-Period MA / Round Number | 4,007.49 / 4,000 | 50-period MA turning higher; $4,000 crossed on 4 November |
| Early-November Floor | Near 3,900 | Lows of the 2 to 3 November range |
| One-Year Low | Near 3,875 | 30 October low |
Table 2: Levels read from the Vantage XAUUSD 4H chart on TradingView as of 10:07 (GMT+8), 6 November 2026. One-year-low context from Kitco. 5 Indicative only.
What to Watch Before and After NFP
- US Nonfarm Payrolls, 6 November, 21:30 (GMT+8): Consensus is 65,000 jobs after September’s 29,000, with unemployment at 4.2%, per FactSet data cited by Morningstar. 11 MUFG analysts flagged “risks tilted to stronger payrolls”, 12 while Barclays’ Marc Giannoni wrote that a 50,000 print “would keep an FOMC hike in play for the December meeting”. 13 For traders in Asia, the week’s biggest US print lands after dinner on a Friday.
- US Consumer Price Index (CPI), 10 November, 21:30 (GMT+8): The next read on whether December hike odds stay above even.
- FOMC Minutes, 19 November, 03:00 (GMT+8): The full record of the 28 October meeting and its two hike dissents.
- US Equity Sessions, Daily: Whether tech-led declines continue, the second channel this piece traced to gold.
Those are the landmarks. Now for the questions we get every time gold moves this far in a week.
Gold Rate Today: Your Questions Answered
What Is the Gold Price Today?
As of 10:07 (GMT+8) on 6 November 2026, the gold price on the Vantage feed was $4,062.97, about 2% below the 5 November high near $4,145; the XAUUSD live quote updates through the session. Checking today gold rate boards in ringgit or rupees? They start from this dollar gold rate, then move with each currency.
Is Gold Bearish After the Pullback?
The chart doesn’t say so clearly. At the cut-off, price sat above the 50-period MA and below the 200-period MA, and the RSI had slipped beneath its signal line. Whether that reads as gold bearish or as a pause depends on which average carries more weight on your timeframe.
Is There a Gold Price Prediction or XAUUSD Forecast Today?
No, and that’s deliberate. A gold price prediction, XAUUSD forecast today, or any prediction about gold rate direction around a payroll release carries the release’s own uncertainty. So instead of a gold market prediction, XAUUSD prediction, gold price forecast, XAUUSD forecast, or prediction on gold rate moves, we read gold price expectations through rate pricing.
The answers cover the chart. The bigger variable tonight is how far one release can move it.
Payroll-Night Volatility and Exposure
We started with a contradiction: a rally with every macro reason to extend stopped at the 200-period line. The evidence points to easing yields on the way up and equity-led liquidation on the way back. Our read holds while gold trades between the 50- and 200-period averages; a 4H close beyond either line, or a payroll surprise that shifts December hike pricing, would change it.
Payroll releases have tended to widen gold’s intraday range, and spreads can widen around the print. A Stop Loss is designed to limit losses to a planned size, but in fast markets it can be filled at a worse price than set, known as slippage. Holding gold alongside equity index positions can also concentrate exposure, as Thursday showed.
Trading gold through Contracts for Difference (CFDs) involves leverage, which is double-edged: it magnifies potential losses as much as potential returns, relative to the margin committed. On a release night the same position carries more risk than on a quiet session, so position sizing relative to account equity matters; a position sized to risk 1% of equity can lose more than that if price gaps beyond its Stop Loss.
RISK WARNING: CFDs are complex financial instruments and carry a high risk of losing money rapidly due to leverage. You should ensure you fully understand the risks involved and carefully consider whether you can afford to take the high risk of losing your money before trading.
Disclaimer: The information is provided for educational purposes only and doesn’t take into account your personal objectives, financial circumstances, or needs. It does not constitute investment advice. We encourage you to seek independent advice if necessary. The information has not been prepared in accordance with legal requirements designed to promote the independence of investment research. No representation or warranty is given as to the accuracy or completeness of any information contained within. This material may contain historical or past performance figures and should not be relied on. Furthermore estimates, forward-looking statements, and forecasts cannot be guaranteed. The information on this site and the products and services offered are not intended for distribution to any person in any country or jurisdiction where such distribution or use would be contrary to local law or regulation.
References
[1] “Gold Set for Biggest Weekly Gain Since August After US Midterms – Bloomberg” https://www.bloomberg.com/news/articles/2026-11-06/gold-set-for-biggest-weekly-gain-since-august-after-us-midterms Accessed on 6 November 2026.
[2] “Gold and silver surge as Democratic midterm sweep drives dollar, yields lower – Kitco” https://www.kitco.com/news/article/2026-11-04/gold-and-silver-surge-democratic-midterm-sweep-drives-dollar-yields-lower Accessed on 6 November 2026.
[3] “Nasdaq ends -5.5%, S&P 500 sees worst day since April 2025 – Seeking Alpha” https://seekingalpha.com/news/4667196-nasdaq-ends–55-sp-500-sees-worst-day-since-april-2025 Accessed on 6 November 2026.
[4] “Gold demand falls as investors weigh uncertain price outlook – Mining.com.au” https://mining.com.au/gold-demand-falls-as-investors-weigh-uncertain-price-outlook/ Accessed on 6 November 2026.
[5] “Gold prices plunge to one-year low below $3,900 as higher oil prices fuel fears of more pain ahead – Kitco” https://www.kitco.com/news/article/2026-10-30/gold-prices-plunge-one-year-low-below-3900-higher-oil-prices-fuel-fears Accessed on 6 November 2026.
[6] “Federal Reserve makes interest rate decision ahead of midterms – Fox Business” https://www.foxbusiness.com/economy/federal-reserve-interest-rate-decision-october-28-2026 Accessed on 6 November 2026.
[7] “Live updates: Bitcoin drops more than 5% as stocks close out worst day since April 2025 – CoinDesk” https://www.coindesk.com/business/2026/11/05/live-updates-bitcoin-steady-around-usd80-000-as-markets-rally-after-democratic-sweep Accessed on 6 November 2026.
[8] “Gold hits a two-week high as dollar, Treasury yields ease after US midterm elections – Business Recorder (Reuters)” https://www.brecorder.com/news/40447533/gold-hits-a-two-week-high-as-dollar-treasury-yields-ease-after-us-midterm-elections Accessed on 6 November 2026.
[9] “Gold rises from one-year low on softer oil prices; U.S. midterms in focus – CNBC (Reuters)” https://www.cnbc.com/2026/11/02/gold-rises-on-softer-oil-markets-parse-fed-signals.html Accessed on 6 November 2026.
[10] “Federal Reserve issues FOMC statement – Board of Governors of the Federal Reserve System” https://www.federalreserve.gov/newsevents/pressreleases/monetary20261028a.htm Accessed on 6 November 2026.
[11] “October Jobs Report Seen Showing Resilient Labor Market – Morningstar” https://www.morningstar.com/economy/october-jobs-report-seen-showing-resilient-labor-market Accessed on 6 November 2026.
[12] “US Labor Update: October 2026 NFP Preview – MUFG Research” https://www.mufgresearch.com/macro/us-labor-update-november-5-2026 Accessed on 6 November 2026.
[13] “What to Look Out for in Economic Data This Week (November 2-6) – Kiplinger” https://www.kiplinger.com/investing/economy/this-weeks-economic-calendar Accessed on 6 November 2026.
Key Points In This Article

Latest Financial Market Analysis


Market Analysis Tags
- # USD News
- # USDCAD News
- # USDJPY News
- # USDX News
- # Forex News
- # Forex News Today
- # GBPUSD News
- # EURUSD News
- # Currency Trading News
- # AUDUSD news
Related Articles
- The Trade Desk Stock Climbed as Q3 Earnings Cleared a Lowered Bar – TTD Analysis
- Gold Rose as Oil Slid on US-Iran Peace Hopes – XAUUSD Analysis
- Nasdaq 100 Climbs as Chip Stocks Rebound Without Nvidia – NAS100 Analysis
- Euro Price Recovers as Dollar Eases Before US CPI: What It Means for EURUSD Traders
- How to Read the NFP Report: What the Numbers Actually Mean for Markets
- Brent Crude Fell Faster Than WTI as Iran Peace Bets Built – UKOUSD and USOUSD Analysis
- Dollar Index Slipped as Oil Fell and Hike Bets Rose – USDX Analysis
- S&P 500 Price Falls as Chip Stocks Slide: What It Means for SP500 Traders