
CFDs and Spread Bets are complex instruments and come with a high risk of losing money rapidly due to leverage. 72.65% of retail investor accounts lose money when trading CFDs and Spread Bets with this provider. You should consider whether you understand how CFDs and Spread Bets work and whether you can afford to take the high risk of losing your money.


 Login


SEARCH
-
Search query too short. Please enter a full word or phrase.
-

Keywords
Popular Search


SEARCH
-
Search query too short. Please enter a full word or phrase.
-
Keywords
Popular Search



 Market Analysis Daily Analysis Why Intel Stock Rebounded 10% as Chip Stocks Recovered Before Q3 Earnings – INTC Analysis
AMD NewsEarnings News TodayFinancial NewsIntel NewsNVIDIA NewsStock Market NewsStock Market News TodayStocksTechnical AnalysisTrending NewsVantage News
Why Intel Stock Rebounded 10% as Chip Stocks Recovered Before Q3 Earnings – INTC Analysis

Vantage Editorial Team >
3 November 2026 | Daily Analysis | 20 min read
Vantage Editorial Team >
Vantage is a global, multi-asset broker with a team of in-house writers and market analysts who produce educational and insightful trading content for traders of all levels.

Key Takeaways
- Intel stock closed at $93.74 on 27 October 2026, up 3.61% on the day and 10.62% above its 23 October low of $84.74.1,2
- Intel reports Q3 2026 results after the US close on 29 October (04:00 GMT+8 on 30 October), guiding to $15.8 billion to $16.8 billion in revenue and a 42.0% non-GAAP gross margin.3,4
- On the hourly chart, price sat above the 50-period moving average at 90.82 and below the 200-period moving average at 107.04, with the 14-period RSI at 64.86.
Quick Answer
Intel stock rebounded 10.62% from the 23 October low to close at $93.74 on 27 October, as chip stocks recovered and New Street turned positive. Intel reports Q3 results after the US close on 29 October, with gross margin against its 42% guide in focus.
The Intel stock price closed at $93.74 on 27 October, 10.62% above its 23 October low, and not one cent of that rebound came from Intel’s own numbers.1,2 The company has not published a quarterly result since 23 July, and it reports again after the US close on Thursday, 29 October.3,4
For the Intel stock price today, the hourly chart at the 10:13 (GMT+8) cut-off on 28 October showed an INTC stock price of 93.76 at the last close and 94.48 overnight. The 52-week range runs from $32.89 to $142.35, and the stock is still up more than 135% in 2026.1
I’ll admit one detail made me reread Intel’s August filing: after a month of being pushed around by other companies’ news, the stock finished within $1.26 of the $95 price at which Intel issued 210.5 million new shares.5 This Intel stock analysis covers why the shares fell, why they bounced, and why gross margin is the number Thursday has to deliver.
Intel Stock News Today: Why the Shares Bounced
The rebound started quietly, with a 1.72% gain to $86.96 on 23 October.2 Then the Intel stock news got louder, and Intel news today is still dominated by the run-up to Thursday. On 26 October, New Street Research upgraded Intel, and the shares closed 4.04% higher at $90.47.2,6
New Street analyst Pierre Ferragu said agentic AI is “driving a sustained increase in server CPU demand”.7 In plain terms, AI software agents run lots of ordinary processor work, and that is Intel’s home turf.
On 27 October the stock added 3.61% to $93.74 after Intel agreed to acquire quantum software developer Classiq for an undisclosed price.1,8 After the bell, Intel and Oracle announced an expanded cloud collaboration, per a Business Wire headline listed by Morningstar.9
That explains the bounce. The room to bounce came from October’s slide.
Why Was Intel Stock Down in October?
On the hourly chart, Intel fell from a peak near $125 on 2 October to an intraday low of $84.74 on 23 October, a drop of roughly 32%.2 My read: October was largely a sector story wearing an Intel ticker.
On 8 October, MarketBeat linked a 5.3% fall to rising yields and oil prices, with Intel moving alongside AMD (NASDAQ:AMD) and Nvidia (NASDAQ:NVDA) rather than on any guidance cut.10 On 22 October, the worst session of the month, Intel closed 8.04% lower at $85.49 as Marvell and AMD each fell about 8% after a Lam Research supply warning.2,11
That same day, Brent crude rose above $112 a barrel following attacks in Saudi Arabia, and Meta’s cash spending revived questions about who pays for the AI build-out, according to The Motley Fool.12
Intel-specific news did add weight. A 5 October report that TSMC could join Terafab, a chip plant project Intel is part of, coincided with a 10.8% weekly decline, per Trefis.13 On 14 October, an explosion at Intel’s Kiryat Gat facility in southern Israel killed two workers, according to The Times of Israel.14
So the slide had mostly outside causes. What does the chart say about the recovery?
What the Intel Stock Chart Shows Before Earnings
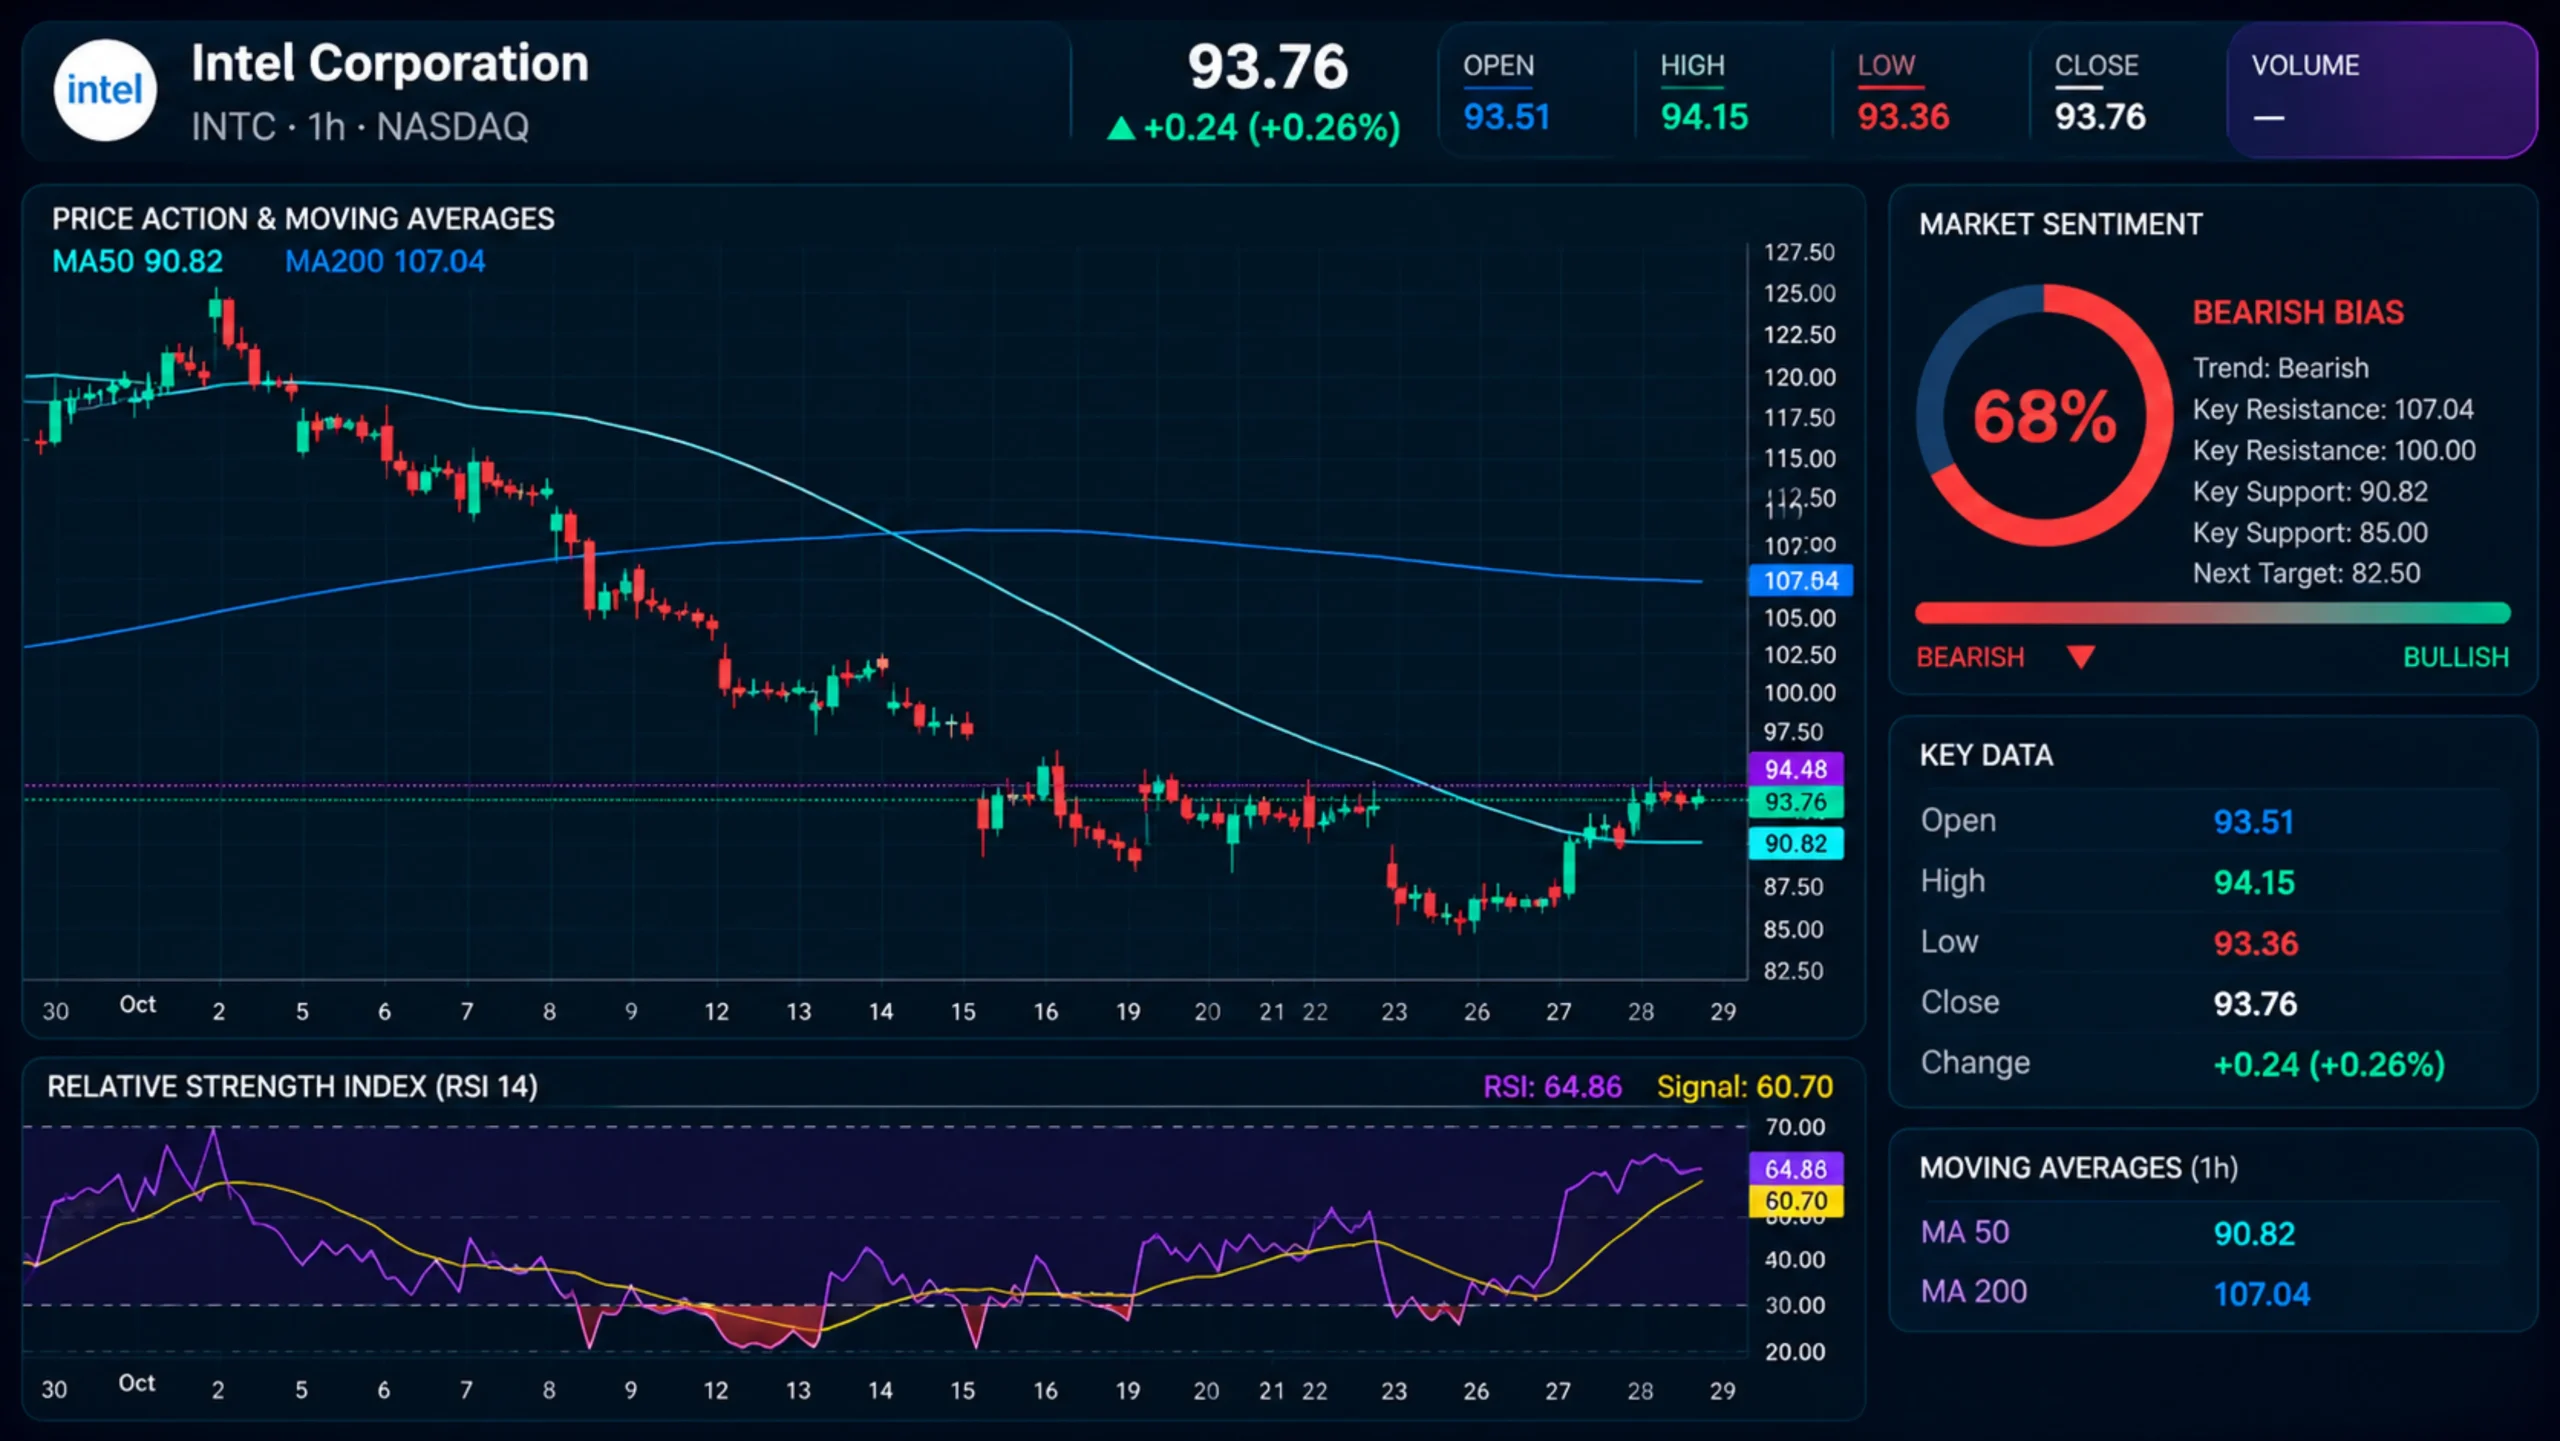
The 26 October session carried price through the 50-period moving average (MA), which sat at 90.82 at the cut-off; the last hourly candle closed at 93.76, about 3.24% above it. The 200-period MA, at 107.04, sat 12.41% above price and was still sloping lower. Two averages, two different stories, one screen.
The 14-period Relative Strength Index (RSI) read 64.86 against its signal line at 60.70 on the TradingView setup used for this analysis, below the 70 line many chart readers treat as overbought. Between 8 and 23 October it dipped below 30 several times, which is a lot of time in the basement for one month, as our technical analysis coverage tracked.
Momentum recovered into the print. Whether Thursday backs it up comes down to one line in the release.
Intel Earnings Preview: Gross Margin Is on Trial
Intel guided Q3 revenue to $15.8 billion to $16.8 billion, with a non-GAAP gross margin of 42.0% and non-GAAP earnings per share (EPS) of $0.38; non-GAAP figures exclude items such as share-based compensation.4 Consensus sits a touch higher, as the table shows, and you can follow the wider reporting week in earnings news today.
Intel Q3 2026: Guidance vs Consensus vs Q2 Actual
| Metric | Q2 2026 Actual | Q3 2026 Guidance | Q3 2026 Consensus |
|---|---|---|---|
| Revenue | $16.1 billion | $15.8 billion to $16.8 billion | $16.45 billion to $16.5 billion |
| Non-GAAP Gross Margin | 41.8% | 42.0% | Not published |
| Non-GAAP EPS | $0.42 | $0.38 | $0.39 to $0.40 |
| Data Center and AI Revenue | $6.3 billion (up 59%) | Not guided | Not published |
Table 1 sources: Intel Q2 2026 release for actuals and guidance;4 LSEG consensus via BigGo Finance and Investing.com.6,15 Data as of 27 October 2026.
Margin is where the tension sits. The Q2 non-GAAP gross margin was 41.8%, up 12.10 percentage points from a year earlier, so the guide asks for only 0.20 points more.4 MarketBeat noted that investors were focused on gross margin rather than revenue heading into the release.10
The segments show why. Data Center and AI earned $2.47 billion of operating income on $6.26 billion of Q2 revenue, while Intel Foundry lost $2.09 billion on $5.77 billion.4 Segment sales include business between Intel’s own units, so they do not sum to the group total, but the foundry loss still weighs on the consolidated margin.
Cash is the second test: adjusted free cash flow was negative $8.42 billion in Q2, and Intel raised about $19.70 billion net from its August share issue.4,5 Now the twist. The 27 October close sat just 1.33% below that $95 issue price.1,5 Ten weeks of headlines, and the stock ended up almost exactly where Intel priced its own shares.
October moved Intel on everyone else’s news. Thursday is the first number since July that belongs to Intel alone.
So where do the analysts who cover Intel for a living stand going in?
Intel Stock Rating and Target Price: Where Analysts Stand
The Street is split, and the Intel stock rating picture moved in both directions in the two weeks before the print. Benzinga put the consensus at Hold, with an average Intel stock target price of $113.69, while several firms trimmed their numbers.16
Intel Stock Rating and Target Price Changes, October 2026
| Firm | Rating | Price Target | Date |
|---|---|---|---|
| New Street Research | Buy (from Neutral) | $125 | 26 October 2026 |
| Susquehanna | Neutral | $105 (cut) | 21 October 2026 |
| TD Cowen | Hold | $95 (cut) | 19 October 2026 |
| JPMorgan | Neutral (from Underweight) | $85 | 19 October 2026 |
| Consensus (Benzinga) | Hold | $113.69 average | As of 23 October 2026 |
Table 2 sources: Investing.com, Benzinga, and BigGo Finance citing Benzinga.6,15,16 Third-party views as reported; Vantage does not issue ratings or price targets.
The cautious camp has a clear argument. TD Cowen analyst Joshua Buchalter has held a Hold view because he believes much of Intel’s progress is already reflected in the share price, and he wants firmer proof of revenue growth first.17
The more positive camp leans on demand. After the July results, Bernstein’s Stacy Rasgon told CNBC: “I am feeling better about Intel than I have in a long time”.18 Three months and a 32% October drawdown later, Thursday is a fair test of that mood.
Opinions aside, the stock’s own history around results is worth a look.
How Intel Stock Moved After Its Last Three Reports
Intel’s past three releases were each followed by a big next-session move: down 17.03% after January, up 23.60% after April, and down 7.90% after July.19,20 That averages 16.18% in absolute terms, by my arithmetic. The moves pointed both ways, so this is a guide to how wide the reaction has been, not which way it goes.
Options traders are bracing for something similar. BigGo Finance reported options pricing a 10.54% implied move around this report, the second-largest among ten big names reporting this week.15
For readers in Asia, the clock matters. Results land at about 04:00 (GMT+8) on Friday, 30 October, a time that suits Californian analysts rather better than anyone in GMT+8.3 On Vantage, Intel shares trade from 19:05 to 04:00 (GMT+8), so any after-hours repricing can show up as a gap at the 19:05 open on Friday.
Intel Stock FAQs
When Is the Intel Earnings Date?
Intel earnings for Q3 2026 are due after the US market close on Thursday, 29 October 2026, which is about 04:00 (GMT+8) on Friday, 30 October; the call starts at 14:00 Pacific Time.3
Why Is Intel Stock Up Today?
Intel stock rose 4.04% on 26 October and 3.61% on 27 October, sessions that coincided with New Street Research’s upgrade, a broad chip-stock rebound, and the Classiq deal.2,6,8
Why Is Intel Stock Down Today From Its 52-Week High?
Even after the bounce, the Intel share price sat about 34% below its 52-week high of $142.35, after an October slide tied mostly to yields, oil, and AI-spending worries.1,10,12
Is There an Intel Stock Forecast 2026 or Price Prediction?
Vantage does not publish an Intel stock prediction or Intel stock price prediction. For reference, 24/7 Wall St. cited full-year 2026 consensus of $63.18 billion in revenue and $1.53 in normalised EPS; any Intel share price forecast built on those figures rests on Thursday’s Q4 guidance.21
What Did Intel Stock After Hours Trading Show?
Intel stock live quotes kept moving after the 27 October close: the stock was quoted at $94.13 in after-hours trading, and the hourly chart showed an overnight quote of 94.48 at the cut-off.1
Intel Stock Outlook: Levels, Dates, and Risk
The Intel stock outlook into Thursday rests on the reference levels below, all taken from the hourly chart and cited price data. They are context, not signals.
Intel (NASDAQ:INTC) Reference Levels as of 10:13 (GMT+8), 28 October 2026
| Level | Price (USD) | What It Marks |
|---|---|---|
| Upper Reference 2 | 107.04 | 200-period MA on the hourly chart |
| Upper Reference 1 | 94.98 to 95.00 | 27 October session high and the August offering price |
| Last Close (H1) | 93.76 | Final 27 October hourly candle; official close $93.74 |
| Lower Reference 1 | 90.82 | 50-period MA on the hourly chart |
| Lower Reference 2 | 86.46 | 26 October session low |
| Lower Reference 3 | 84.74 | 23 October intraday low, October’s lowest point |
Table 3 sources: TradingView H1 chart (NASDAQ:INTC), Investing.com historical data, and Intel offering release.2,5 Data as of 10:13 (GMT+8) on 28 October 2026; indicative only.
Earnings-Night Checklist
- Gross Margin: Non-GAAP gross margin against the 42.0% guide and Q2’s 41.8%.4
- Revenue: The result against the $15.8 billion to $16.8 billion range and the roughly $16.45 billion consensus.15
- Q4 Guidance: The new revenue and margin ranges, which reset the reference for the next three months.
- Foundry Loss: Intel Foundry’s operating loss against $2.09 billion in Q2.4
- Cash: Adjusted free cash flow against negative $8.42 billion in Q2.4
- Timing: The Fed decision at 02:00 (GMT+8) on 29 October, the results at 04:00 (GMT+8) on 30 October, and the first Vantage session at 19:05 (GMT+8).3,22
The read that October was mostly an outside job weakens if Thursday’s margin or cash figures fall clearly short of guidance; it holds if the release lands close to guidance and the stock goes back to trading with the sector.
Intel spent October trading on other people’s news and finished it near its own August offering price. From 04:00 (GMT+8) on Friday, the stock has its own numbers to answer to.
Earnings can move share prices sharply outside regular hours. A Stop Loss order fills at the next available price, which after a gap can be worse than the level set, so it helps limit losses to a planned size in normal conditions but cannot guarantee that size across the 04:00 to 19:05 (GMT+8) gap on 30 October.
Leverage is double-edged: it magnifies losses as well as gains, and a move the size of the recent 16.18% three-report average reaches much further into account equity at higher leverage. Sizing exposure as a percentage of account equity sets how much damage a single gapped move can do.
Related Reading
- Intel News
- Earnings News Today
- Technical Analysis
RISK WARNING: CFDs are complex financial instruments and carry a high risk of losing money rapidly due to leverage. You should ensure you fully understand the risks involved and carefully consider whether you can afford to take the high risk of losing your money before trading.
Disclaimer: The information is provided for educational purposes only and doesn’t take into account your personal objectives, financial circumstances, or needs. It does not constitute investment advice. We encourage you to seek independent advice if necessary. The information has not been prepared in accordance with legal requirements designed to promote the independence of investment research. No representation or warranty is given as to the accuracy or completeness of any information contained within. This material may contain historical or past performance figures and should not be relied on. Furthermore estimates, forward-looking statements, and forecasts cannot be guaranteed. The information on this site and the products and services offered are not intended for distribution to any person in any country or jurisdiction where such distribution or use would be contrary to local law or regulation.
References
[1] “Intel Corporation (INTC) Stock Price, Chart & News – Stock Analysis” https://stockanalysis.com/stocks/intc/ Accessed on 28 October 2026.
[2] “Intel Stock Price History – Investing.com” https://www.investing.com/equities/intel-corp-historical-data Accessed on 28 October 2026.
[3] “Intel to Report Third-Quarter 2026 Financial Results – Intel Investor Relations” https://www.intc.com/news-events/press-releases/detail/1782/intel-to-report-third-quarter-2026-financial-results Accessed on 28 October 2026.
[4] “Intel Reports Second-Quarter 2026 Financial Results (Form 8-K, Exhibit 99.1) – SEC EDGAR” https://www.sec.gov/Archives/edgar/data/0000050863/000005086326000155/q226earningsrelease.htm Accessed on 28 October 2026.
[5] “Intel Announces Upsize and Pricing of $20 Billion Common Stock Offering – Intel Investor Relations” https://www.intc.com/news-events/press-releases/detail/1779/intel-announces-upsize-and-pricing-of-20-billion-common-stock-offering Accessed on 28 October 2026.
[6] “Why Is Intel Stock Rallying Today? – Investing.com” https://www.investing.com/news/stock-market-news/why-is-intel-stock-rallying-today-93CH-4973403 Accessed on 28 October 2026.
[7] “Why Intel Stock Popped Today – The Motley Fool” https://www.fool.com/investing/2026/10/26/why-intel-stock-popped-today/ Accessed on 28 October 2026.
[8] “Intel Stock Rises as Much as 4% on a Deal to Buy Quantum Firm Classiq – Opening Bell Daily” https://www.openingbelldailynews.com/p/intel-stock-up-today-oct-27-2026 Accessed on 28 October 2026.
[9] “Intel Corp (INTC) Stock Price and News – Morningstar” https://www.morningstar.com/stocks/xnas/intc/quote Accessed on 28 October 2026.
[10] “Intel (NASDAQ:INTC) Shares Down 5.3% – What’s Next? – MarketBeat” https://www.marketbeat.com/instant-alerts/price-intel-nasdaq-intc-shares-down-53-whats-next-2026-10-08/ Accessed on 28 October 2026.
[11] “Chip Stocks Fall as Supply Warning Deepens AI Selloff – 24/7 Wall St.” https://247wallst.com/investing/2026/10/22/chip-stocks-fall-as-supply-warning-deepens-ai-selloff-marvell-and-amd-sink-8-intel-drops-7/ Accessed on 28 October 2026.
[12] “Why Intel Stock Fell Today – The Motley Fool” https://www.fool.com/investing/2026/10/22/why-intel-stock-fell-today/ Accessed on 28 October 2026.
[13] “How Low Can Intel Stock Go? – Trefis” https://www.trefis.com/articles/618139/how-low-can-intel-stock-go/2026-10-09 Accessed on 28 October 2026.
[14] “Second Worker Dies of Wounds Sustained in Intel Plant Blast in Southern Israel – The Times of Israel” https://www.timesofisrael.com/second-worker-dies-of-wounds-sustained-in-intel-plant-blast-in-southern-israel/ Accessed on 28 October 2026.
[15] “Intel Options Traders Bet on 10.5% Post-Earnings Swing as Stock’s 117% Rally Faces Test – BigGo Finance” https://finance.biggo.com/news/14d2f1f7-c4db-43ed-b63d-81b838193295 Accessed on 28 October 2026.
[16] “Intel Earnings Are Around the Corner: Here’s What to Expect – Benzinga” https://www.benzinga.com/trading-ideas/movers/26/10/62524716/intel-earnings-are-around-the-corner-heres-what-to-expect Accessed on 28 October 2026.
[17] “INTC Stock: What to Watch Before Earnings – Yahoo Finance” https://finance.yahoo.com/markets/stocks/articles/intc-stock-watch-earnings-october-181941210.html Accessed on 28 October 2026.
[18] “Intel Rides AI Boom to Fastest Revenue Growth in Almost 15 Years, but Shares Sink – CNBC” https://www.cnbc.com/2026/07/23/intel-intc-earnings-report-q2-2026.html Accessed on 28 October 2026.
[19] “Intel Nears Oversold Territory but Analysts Remain Split on Recovery – Barchart via Webull” https://www.webull.com/news/15273000002921472 Accessed on 28 October 2026.
[20] “INTC Earnings October 2026 – EarningsWatcher” https://earnings-watcher.com/wiki/intc-earnings-october-2026 Accessed on 28 October 2026.
[21] “Intel’s Make-or-Break Margin Test Is Arriving on Oct. 29 – 24/7 Wall St. via AOL” https://www.aol.com/articles/intel-break-margin-test-arriving-153319000.html Accessed on 28 October 2026.
[22] “Meeting Calendars, Statements, and Minutes (2021-2027) – Federal Reserve” https://federalreserve.gov/monetarypolicy/fomccalendars.htm Accessed on 28 October 2026.
Key Points In This Article

Latest Financial Market Analysis


Market Analysis Tags
- # USD News
- # USDCAD News
- # USDJPY News
- # USDX News
- # Forex News
- # Forex News Today
- # GBPUSD News
- # EURUSD News
- # Currency Trading News
- # AUDUSD news
Related Articles
- The Trade Desk Stock Climbed as Q3 Earnings Cleared a Lowered Bar – TTD Analysis
- Gold Rose as Oil Slid on US-Iran Peace Hopes – XAUUSD Analysis
- Nasdaq 100 Climbs as Chip Stocks Rebound Without Nvidia – NAS100 Analysis
- Euro Price Recovers as Dollar Eases Before US CPI: What It Means for EURUSD Traders
- How to Read the NFP Report: What the Numbers Actually Mean for Markets
- Brent Crude Fell Faster Than WTI as Iran Peace Bets Built – UKOUSD and USOUSD Analysis
- Dollar Index Slipped as Oil Fell and Hike Bets Rose – USDX Analysis
- S&P 500 Price Falls as Chip Stocks Slide: What It Means for SP500 Traders