


 Login





Why the Nasdaq Fell as Chip Stocks Dropped and Oil Climbed – NAS100 Analysis

Vantage Editorial Team >
Vantage Editorial Team >
Vantage is a global, multi-asset broker with a team of in-house writers and market analysts who produce educational and insightful trading content for traders of all levels.
 Updated Wed, 2026 October 14 02:51

Key Takeaways
- Vantage NAS100 traded at 30,476.12 as of 10:07 (GMT+8) on 13 October 2026, roughly 2.94% below its 6 October high near 31,400 on the hourly chart.
- The Philadelp
- hia semiconductor index fell 2.70% on 12 October after touching a three-week low, while the Dow rose 0.38%. 1,2
- US September Consumer Price Index (CPI) data is due at 20:30 (GMT+8) on 14 October, and Taiwan Semiconductor Manufacturing Company (TSMC) holds its results conference at 14:00 (GMT+8) on 15 October. 3,4
The Nasdaq Composite index closed at a record 27,599.89 on 6 October 2026. 5 Four sessions later, on a day the Dow gained 0.38%, the Nasdaq slipped 0.44% to 27,245.90. 1 We checked the Dow twice. It really did finish higher.
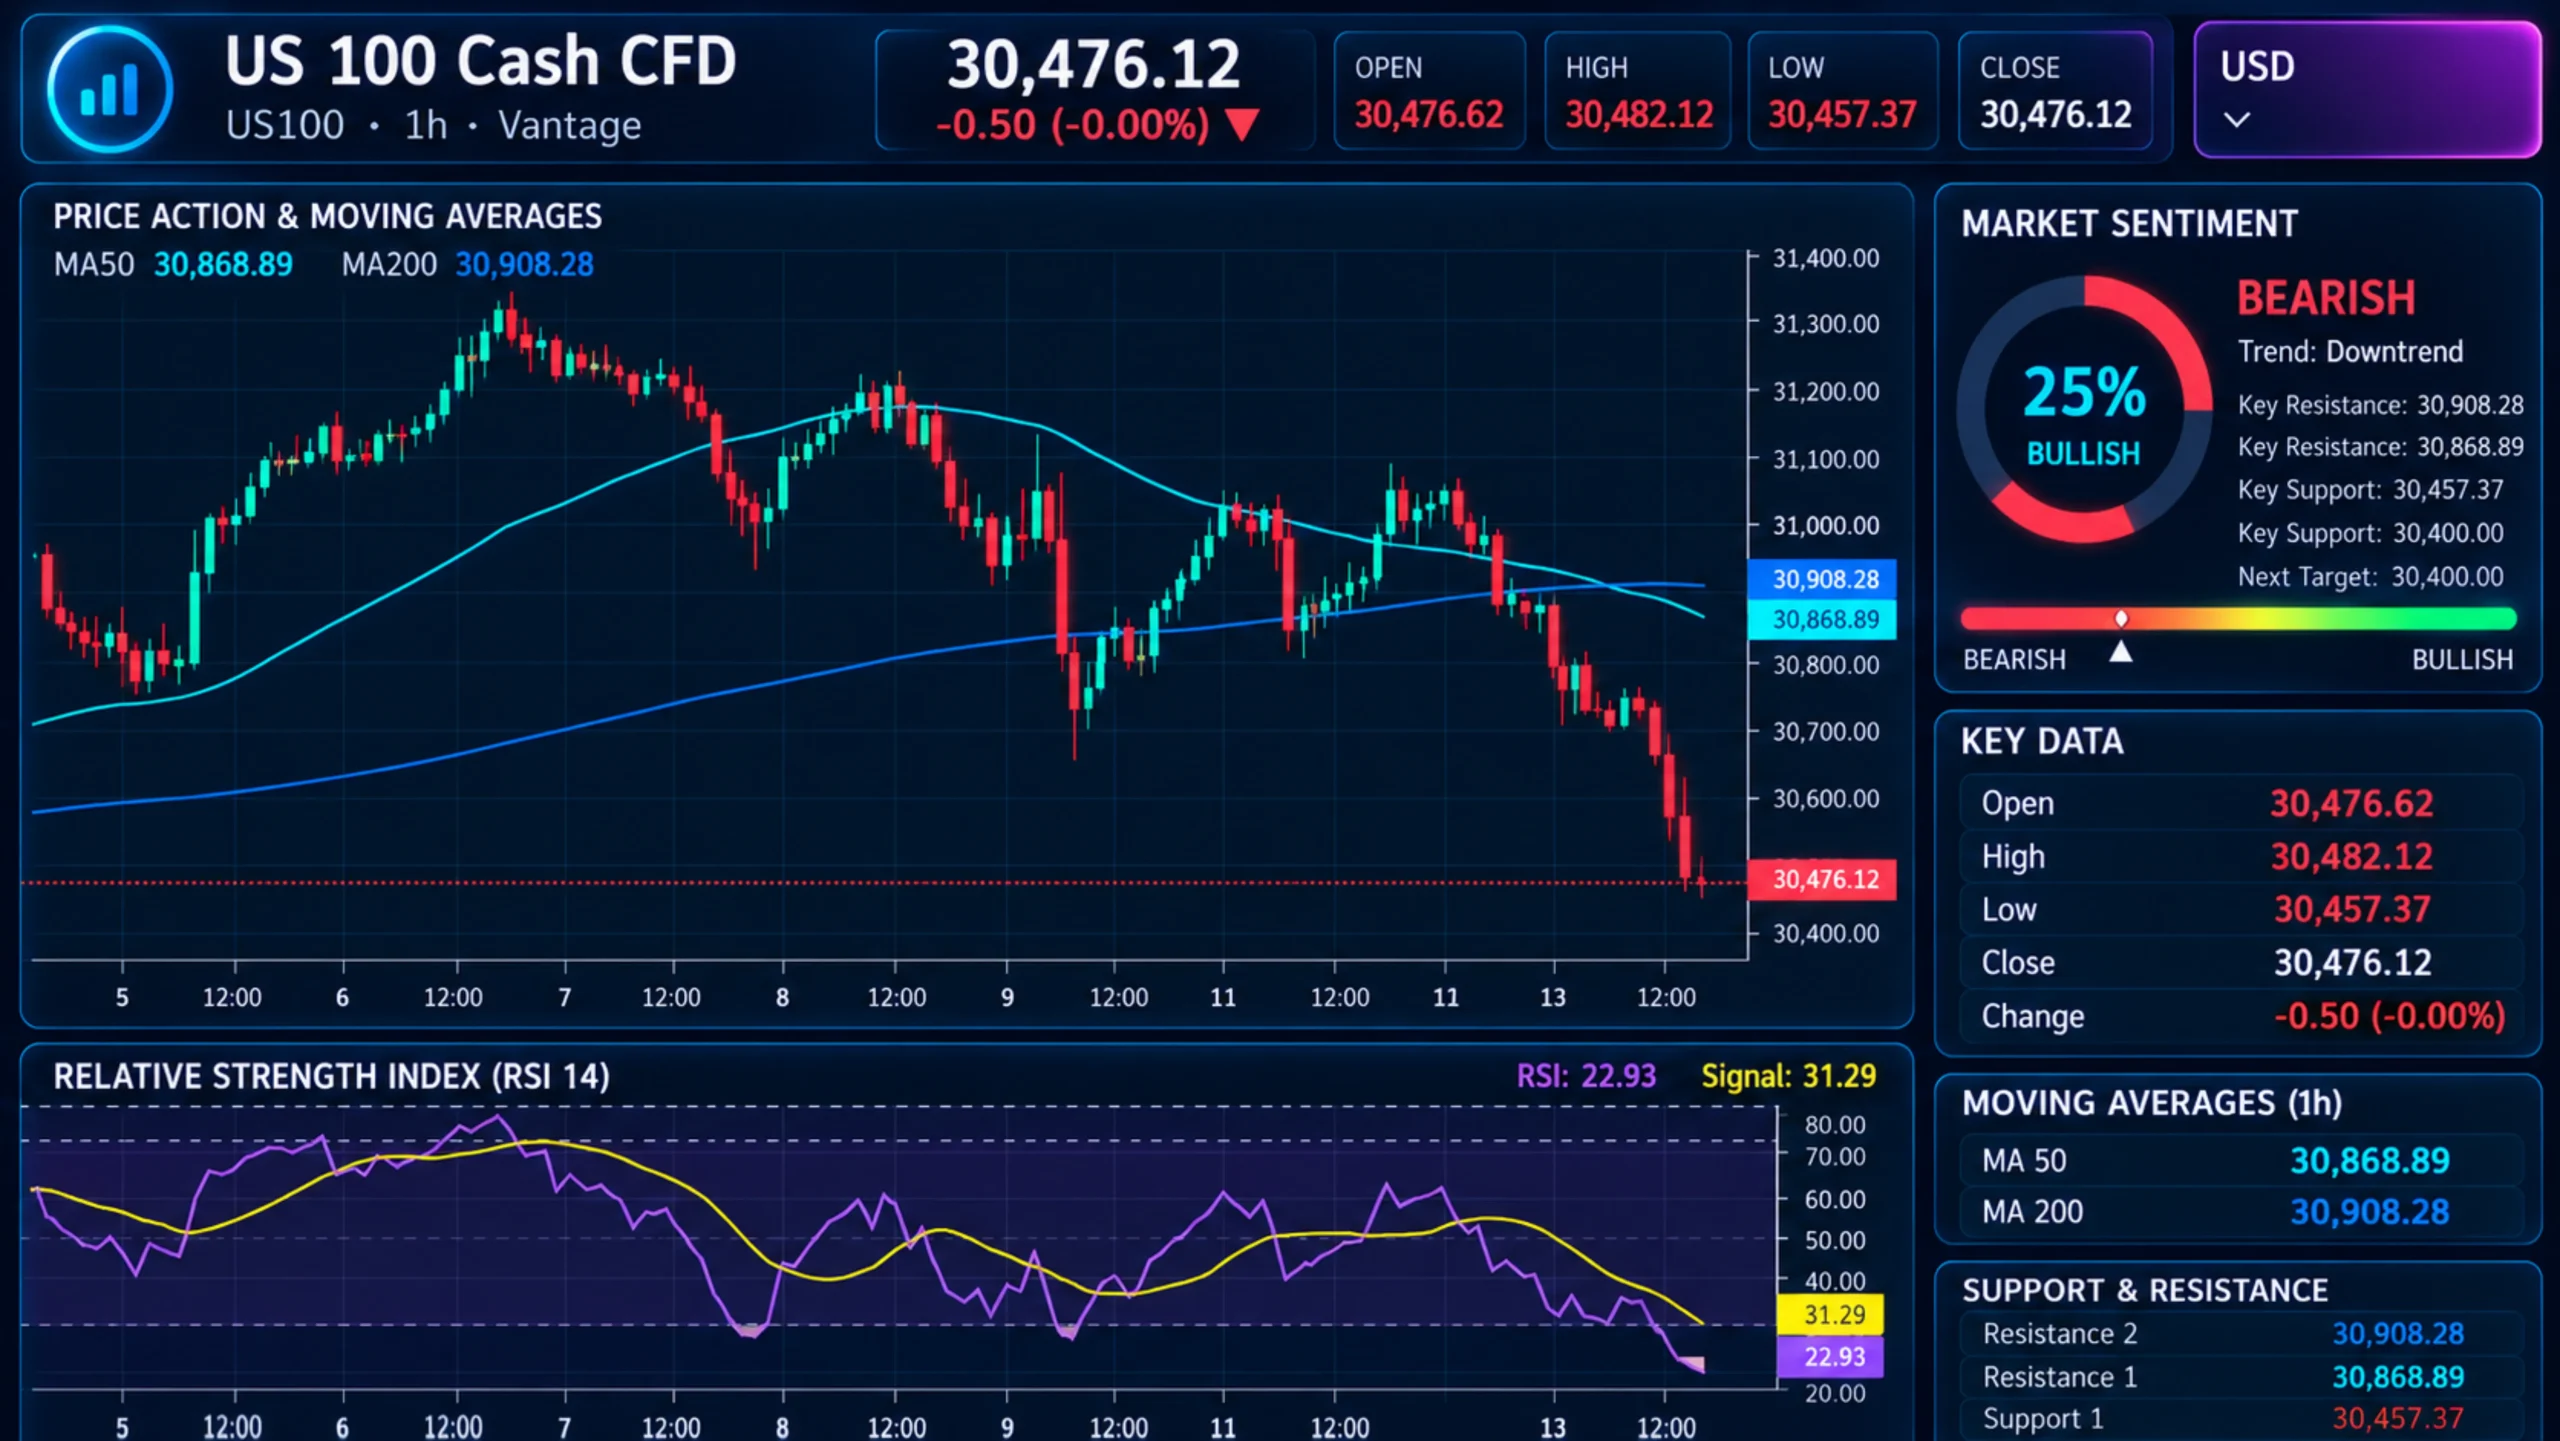
Then Asia opened, and the decline kept going. As of 10:07 (GMT+8) / 02:07 (UTC) on 13 October 2026, the Nasdaq price on the Vantage NAS100 feed sat at 30,476.12, with the hourly low at 30,457.37. That is roughly 2.94% under the 6 October peak near 31,400 on the same chart.
So why did a 0.44% Monday dip turn into a steeper slide by Tuesday morning in Asia? Below, we follow the decline from US chip stocks to Seoul and Tokyo and set out what Wednesday’s inflation data could change about the risk picture.
Why Did the Nasdaq Fall Today?
The Nasdaq fell as chip stocks led a tech-specific decline: the Philadelphia semiconductor index dropped 2.70% on 12 October while the Dow rose 0.38%. With Brent near $106 and US 10-year yields above 5.2%, losses then extended in Asia on Tuesday as Korean chipmakers slid.
Table 1: How Markets Moved, 12 to 13 October 2026
| Market | Move | When |
| Nasdaq Composite | Fell 0.44% to 27,245.90 | 12 October close |
| S&P 500 | Fell 0.06% to 7,807.24 | 12 October close |
| Dow Jones Industrial Average | Rose 0.38% to 51,850.55 | 12 October close |
| Philadelphia Semiconductor Index | Fell 2.70% after touching a three-week low | 12 October close |
| Kospi | Down 5.24% (intraday) | 13 October, morning trade |
| Nikkei 225 | Down 2.60% (intraday, after a holiday) | 13 October, morning trade |
| US 10-Year Treasury Yield | 5.214%, down 2.9 basis points; last week’s 24-year high was 5.364% | 13 October, Asia session |
| Vantage NAS100 | 30,476.12, roughly 2.94% below the 6 October high | 10:07 (GMT+8), 13 October |
Table 1 data are referenced from Yahoo Finance, Reuters, and CNBC TV18 as cited, and from the Vantage NAS100 hourly chart on TradingView, as of 13 October 2026. Asian index moves are intraday snapshots, not closing figures.
Nasdaq Stock Market Today: Chips Took the Hit
Monday’s damage was narrow but deep. Technology was the worst sector, down 0.90%, and the Philadelphia semiconductor index fell 2.70% after touching a three-week low. 2 Sandisk (NASDAQ:SNDK) dropped more than 6% on memory competition concerns, and Lumentum Holdings (NASDAQ:LITE) fell almost 10% as investors stepped back from AI-linked names. 8
The broader market was far calmer. The S&P 500 slipped 0.06%, the Dow rose 0.38%, and volume ran about 28% below its 20-day average. 1,2 US bond markets were shut for Columbus Day. 1 Bond desks had the day off; chip stocks did not.
Robert Pavlik, senior portfolio manager at Dakota Wealth, pointed to the week’s data, earnings, and rising oil, and put it plainly: “There’s a lot to be wary of”. 2 Our stock market news today feed tracks how that caution plays out session by session.
Chips explain where the losses landed. They don’t explain why the drop arrived on the same day oil jumped.
Oil Near $106 and 5% Yields Add a Second Layer
Crude climbed nearly $2 a barrel on Monday after attacks on a Saudi airport, Reuters reported. 2 By Tuesday’s Asian session, Brent sat around $105.80 6 and the US 10-year Treasury yield was 5.214%. That was 2.9 basis points lower on the day, but still close to the 24-year high of 5.364% reached last week. 7
Here’s the chain, simplified. Pricier fuel lifts headline inflation, inflation shapes expectations for the Federal Reserve, and higher yields shrink what markets are willing to pay today for earnings years away. That last link is where the Nasdaq 100 index is most exposed. The chain doesn’t move in lockstep every session; this week the pressure came from the level of yields rather than a fresh jump.
Charu Chanana, chief investment strategist at Saxo, said the oil move was “taking some shine off expensive growth stocks”. 7
Wednesday puts numbers on it. Credit Agricole expects September headline CPI of 3.64% year-on-year, up from 3.40% in August, while Deutsche Bank sees a 0.57% monthly rise driven largely by fuel. 3 Core inflation, which strips out food and energy, is expected at around 2.40% to 2.50% year-on-year, depending on the forecaster. 3,9
Those are US drivers. The part of the story most wire coverage skipped happened while New York slept.
Nasdaq 100 Today: Asia Took the Decline Further

On the hourly chart, Vantage NAS100 spent late 12 October (UTC) near 30,650 to 30,700, then fell to 30,457.37 between 08:00 and 10:07 (GMT+8) on 13 October. That is a drop of around 200 points in two hours, before the US cash market had reopened.
Asia moved in step. The Kospi, widely treated as a barometer for the AI trade, was down 5.24% in morning trade, and the MSCI Asia Pacific index slid 0.90%. 6 Samsung Electronics and SK Hynix each dropped more than 5%, heading for a fifth straight losing session amid worries about Chinese rivals, Bloomberg reported. 10 Japan’s Nikkei 225, back from a Monday holiday, fell 2.60%. 7
One worry has a name: ChangXin Memory Technologies (CXMT), China’s largest DRAM maker, said it expects to launch a server memory module by year-end. 11
Put together, this reads less like a verdict on the US economy and more like a repricing of one trade, with oil and yields adding pressure at the edges. The Dow finished higher, the chip index did not, and the weakness travelled through Seoul and Tokyo before the US cash open.
On Monday the Dow rose 0.38% and the chip index fell 2.70%. The Nasdaq traded more like a chip story than an economy story.
The practical point: when an index moves while its cash market is shut, the gap between the US close and the next open can widen, and that is where overnight risk sits.
A move this fast tends to show up in momentum first, and the hourly chart has a reading worth pausing on.
Nasdaq Chart Today: Momentum Hit Its Weakest Reading in a Week
On the Nasdaq index chart, every major NAS100 rebound since the 6 October peak near 31,400 has stalled lower: about 31,250 around the turn of 7 to 8 October (UTC) and about 31,100 early on 12 October, as of 10:07 (GMT+8) on 13 October 2026. Price has also slipped under the 8 October spike low near 30,580.
Both moving averages now sit overhead. The 50-period read 30,868.89 and the 200-period 30,908.28 at the cut-off, after the faster line crossed beneath the slower one on 12 October.
Then there’s the number that stopped us scrolling. The 14-period Relative Strength Index (RSI) on the TradingView setup used for this analysis read 22.93, below the 30 line often used to flag oversold conditions and the lowest reading on the visible chart since 5 October. Its signal line sat at 31.29.
Oversold readings have come before pauses, and they have also persisted through longer declines. RSI measures how fast the index fell; it has never claimed to know how long a fall lasts.
Table 2: Levels Traders Are Watching on NAS100, as of 10:07 (GMT+8), 13 October 2026
| Reference | Approximate Level | What It Marks on the H1 Chart |
| Swing High | 31,400 | 6 October peak |
| Swing High | 31,100 | Early 12 October rebound high |
| Moving-Average Zone | 30,869 to 30,908 | 50- and 200-period moving averages |
| Prior Spike Low | 30,580 | 8 October intraday low |
| Session Low | 30,457 | Hourly low at the cut-off |
| Round Number | 30,400 | Next labelled level on the chart axis |
Table 2 levels are read from the Vantage NAS100 hourly chart on TradingView as of 10:07 (GMT+8) on 13 October 2026. Indicative only, not trade signals.
The chart shows where the Nasdaq index today has traded. The calendar shows what lands on top of it.
CPI and TSMC Set the Next Test
Our read, that this has been a chip-led repricing rather than a broad growth scare, holds while the Dow and S&P 500 stay comparatively steady. It weakens if core CPI comes in above the expected 0.20% monthly pace, because that would put rates, not chips, at the centre of the story. 9
Anthony Saglimbene, chief market strategist at Ameriprise Financial, noted that the third-quarter earnings season starts with stocks close to record levels, which leaves little margin for disappointment. 7 Three major releases land within about 24 hours, a timetable even the economic calendar might call ambitious.
What To Watch (All Times GMT+8):
- Bank Earnings, 13 October: Major US banks open the third-quarter earnings season this week. 12
- US CPI (September), 14 October, 20:30: Headline is expected to rise on fuel prices, with core expected near 0.20% month-on-month 3,9
- TSMC Q3 Results Conference, 15 October, 14:00: The chip story’s next hard data point from TSMC, landing in the Asia session. 4
- US Producer Price Index (PPI), 15 October, US Session: September producer prices follow CPI by a day. 12
- FOMC Decision, 29 October, 02:00: The Federal Open Market Committee statement, released at 14:00 New York time on 28 October. 13
Nasdaq Today: Your Questions Answered
How Is the Nasdaq 100 Index Different From the Nasdaq Composite Index?
Both are Nasdaq market index benchmarks. The Nasdaq 100 tracks the 100 largest non-financial stocks on the exchange, while the Composite covers a far broader set. 14 NAS100 follows the Nasdaq 100, so its level differs from the Composite figures in Nasdaq news coverage.
Does the Nasdaq Trade at the Weekend?
Not in the cash market. The Nasdaq trades Monday to Friday, 09:30 to 16:00 New York time. 15 Weekend Nasdaq news first shows up when index futures and index products reopen on Sunday evening New York time, which is Monday morning in Asia, so Monday prices can gap away from Friday’s close. Markets rest at the weekend; headlines don’t.
Is There a Forecast for the Stock Market Tomorrow?
If you came looking for a forecast for stock market tomorrow, we don’t publish price forecasts. What we can offer is the timetable: US CPI at 20:30 (GMT+8) on 14 October and TSMC’s results at 14:00 (GMT+8) on 15 October are the next scheduled tests for the Nasdaq 100. 3,4 Our NAS100 news page carries updates as they land.
A Record Close, Then a Week of Chip Losses
A week ago the Nasdaq Composite closed at a record. As of 10:07 (GMT+8) on 13 October 2026, the decline has been concentrated in chips, carried through Asian hours, and left hourly momentum at its weakest on the visible chart. Wednesday’s CPI and Thursday’s TSMC results are where that read either holds or changes.
Index prices can gap between sessions. A Stop Loss order is one tool traders use to limit a loss to a planned size, although in a fast or gapping market it may be filled at a worse price than the level set. Exposure across correlated positions, such as the Nasdaq 100 and the Asian indices that fell with it this week, can add up faster than any single position suggests.
Leverage is double-edged: it magnifies losses as well as gains, so a move of roughly 3% in the underlying index becomes a much larger move relative to the margin posted on a leveraged position. Position size relative to account equity decides how much of an account a move like that represents, and data-heavy weeks like this one can widen intraday ranges.
RISK WARNING: CFDs are complex financial instruments and carry a high risk of losing money rapidly due to leverage. You should ensure you fully understand the risks involved and carefully consider whether you can afford to take the high risk of losing your money before trading.
Disclaimer: The information is provided for educational purposes only and doesn’t take into account your personal objectives, financial circumstances, or needs. It does not constitute investment advice. We encourage you to seek independent advice if necessary. The information has not been prepared in accordance with legal requirements designed to promote the independence of investment research. No representation or warranty is given as to the accuracy or completeness of any information contained within. This material may contain historical or past performance figures and should not be relied on. Furthermore estimates, forward-looking statements, and forecasts cannot be guaranteed. The information on this site and the products and services offered are not intended for distribution to any person in any country or jurisdiction where such distribution or use would be contrary to local law or regulation.
References
[1] “Stock Market Today, Oct. 12: Dow Gains as Memory Stocks Weigh on Nasdaq – Yahoo Finance” https://finance.yahoo.com/markets/stocks/articles/stock-market-today-oct-12-212311190.html Accessed on 13 October 2026.
[2] “Nasdaq falls ahead of earnings, economic data while oil rallies – Reuters via Yahoo Finance” https://finance.yahoo.com/markets/stocks/articles/us-stock-futures-steady-oil-113404683.html Accessed on 13 October 2026.
[3] “US CPI Prep (14th October) – FinancialJuice” https://features.financialjuice.com/2026/10/12/us-cpi-prep-14th-october/ Accessed on 13 October 2026.
[4] “Quarterly Results – TSMC Investor Relations” https://investor.tsmc.com/quarterly-results Accessed on 13 October 2026.
[5] “Closing milestones of the Nasdaq Composite – Wikipedia” https://en.wikipedia.org/wiki/Closing_milestones_of_the_Nasdaq_Composite Accessed on 13 October 2026.
[6] “Asian stocks fall as AI selloff deepens ahead of US earnings – CNBC TV18 via TradingView” https://www.tradingview.com/news/cnbctv:d69499ede094b:0/ Accessed on 13 October 2026.
[7] “Asian stocks dive as focus on earnings, geopolitics – Reuters via Investing.com” https://www.investing.com/news/economy-news/asian-stocks-dive-as-focus-on-earnings-geopolitics-4945310 Accessed on 13 October 2026.
[8] “Stock Market Today, Oct. 12: Dow Gains as Memory Stocks Weigh on Nasdaq – The Motley Fool” https://www.fool.com/coverage/stock-market-today/2026/10/12/stock-market-today-oct-12-dow-gains-as-memory-stocks-weigh-on-nasdaq/ Accessed on 13 October 2026.
[9] “U.S. inflation data preview: September CPI and what it means for markets – Finwire” https://finwire.io/news/stock-markets-news/us-inflation-data-preview-september-cpi-and-what-it-means-for-markets Accessed on 13 October 2026.
[10] “Korean Chip Stocks Sink on Chinese Rival Worry, Broadcom Remarks – Bloomberg” https://www.bloomberg.com/news/articles/2026-10-13/korean-chip-stocks-sink-on-chinese-rival-worry-broadcom-remarks Accessed on 13 October 2026.
[11] “Chinese chip challenge pushes Seoul index to 6,000 edge – AJP” https://www.ajupress.com/view/20261013091040415 Accessed on 13 October 2026.
[12] “The Week Ahead: US September CPI and PPI Set for Release, Wall Street Major Bank Earnings Season Officially Kicks Off – TradingKey” https://www.tradingkey.com/analysis/stocks/us-stocks/262210228-weekly-preview-us-september-cpi-ppi-wall-street-banks-earnings-tsmc-tradingkey Accessed on 13 October 2026.
[13] “October 2026 – Federal Reserve Board” https://www.federalreserve.gov/newsevents/2026-october.htm Accessed on 13 October 2026.
[14] “Global tech sell-off intensifies, led by AI and chip stocks – NBC News” https://www.nbcnews.com/business/business-news/tech-sell-off-markets-spacex-alphabet-nasdaq100-stocks-rcna351331 Accessed on 13 October 2026.
[15] “NASDAQ Market Hours & Holidays 2026 – 2028 – TradingHours.com” https://www.tradinghours.com/markets/nasdaq Accessed on 13 October 2026.
The information has been prepared as of the date published and is subject to change thereafter. The information is provided for educational purposes only and doesn't take into account your personal objectives, financial circumstances, or needs. It does not constitute investment advice. We encourage you to seek independent advice if necessary. The information has not been prepared in accordance with legal requirements designed to promote the independence of investment research. No representation or warranty is given as to the accuracy or completeness of any information contained within. This material may contain historical or past performance figures and should not be relied on. Furthermore estimates, forward-looking statements, and forecasts cannot be guaranteed. The information on this site and the products and services offered are not intended for distribution to any person in any country or jurisdiction where such distribution or use would be contrary to local law or regulation.
