


Vantage uses cookies that are essential for our website to work. We also use optional analytical cookies to help us to improve our website and the services, content and ads we provide to you which you can accept or reject here. Please see our Cookies Policy for more information on how we use cookies.
CFDs and Spread Bets are complex instruments and come with a high risk of losing money rapidly due to leverage. 73.5% of retail investor accounts lose money when trading CFDs and Spread Bets with this provider. You should consider whether you understand how CFDs and Spread Bets work and whether you can afford to take the high risk of losing your money. Please seek independent advice if necessary.
Headlines
* Fed minutes to show support level for larger hikes, higher peak
* RBNZ hikes by 50bps despite cyclone’s economic blow
* Australia wage growth weaker than expected as rate bets pared
* Asia stocks track Wall Street lower ahead of FOMC minutes
FX: USD remains uneventful andjust about maintains the 104 handle this morning. The dollar has traded in a tight range so far this week. That comes even though Treasury yields have moved north. We note that the biggest component of the DXY is the euro which makes up over 57% of the basket of six currencies. The benchmark US Treasury 10-year yield popped up to fresh cycle highs at 3.96%. This level hasn’t been seen since the start of November.
EUR closed lower at 1.0646 after a slew of better-than-expected data. GBP was the major outperformer on the day. Strong PMI data saw buyers take cable above 1.21 after sinking to 1.1985. Also helping was the news that PM Sunak secured the backing of two key Brexiteers for a NI trade deal. USD/JPY jumped up to 135.22 on climbing Treasury yields before paring gains. AUD has been pressured by soft data. It is closing in on last week’s low at 0.6811 and the 200-day SMA at 0.6802. NZD was initially boosted after the 50bp RBNZ rate hike. The bank signalled further rate rises and maintained its peak rate forecast of 5.50%. But risk aversion has seen gains pull back. A support zone comes in around 0.6184/91.
Stocks: US equities closed lower on return from the long weekend. Hot flash PMI data from both sides of the pond spurred fresh hawkish central bank repricing. The benchmark S&P 500 ended down 2% with declines in every sector. The tech-laden Nasdaq 100 sunk 2.41%. The Dow slid 2.06%. There was consumer stock pessimism on weak Walmart guidance. Home Depot’s sales and guidance were also lacklustre. Both companies noted shifting consumer patterns to lower-priced groceries and travel.
Asian stocks were subdued again following the selloff in the US. The ASX 200 briefly dipped below 7,300. But the softer-than-expected Wage Price Index removed some of the hawkish RBA calls. The Nikkei 225 underperformed and neared the 27,000 level. The Hang Seng briefly pulled into correction territory on weakness in tech although losses were pared.
US equity futures are very modestly in the green. European equity futures are indicative of a weaker open.
Gold traded sideways amid an eventful dollar, even though yields jumped higher.
Day Ahead – FOMC minutes amid hawkish Fed repricing
There is much focus on the Fed minutes released later today. They should give us some clues on the amount of dissent of moving down gears to only a 25bp rate hike at its February meeting. This may point to changes in the March FOMC and projections / dot plot (SEPs). But the debate will not include the latest upside surprises in the January data like the NFP, CPI and retail sales figures. This is because the meeting occurred before the reports. We have also had numerous hawkish remarks from Fed officials.
The strong PMI data yesterday hit stocks and boosted yields. Markets now fully price in three 25bp Fed rate hikes by the summer. There is around a 21% chance of the Fed moving back to a 50bp rate rise in March. Fed fund futures now for the first time trade above the average Fed forecast for year end of 5.13%. The peak rate has hit an all time high and is above 5.36%. And yet the dollar is relatively subdued and has not beaten last week’s top.
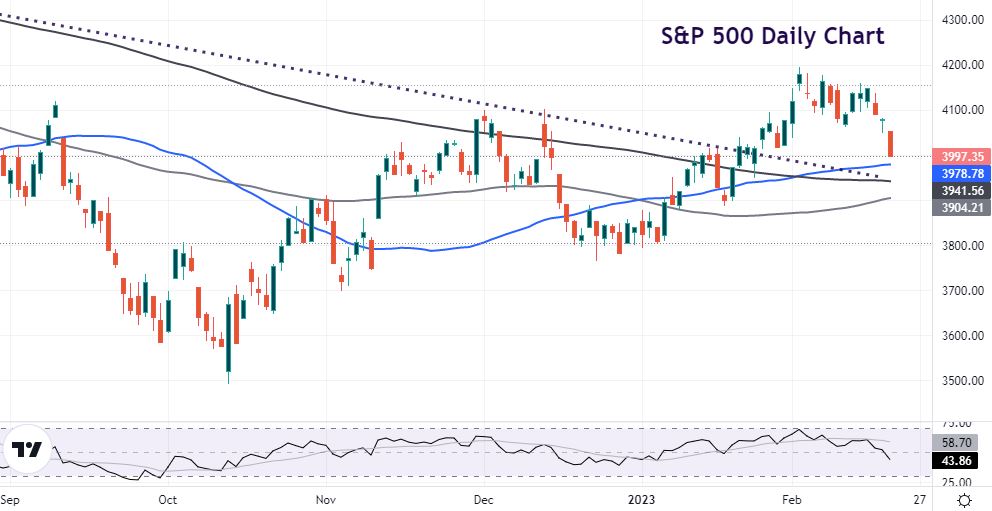
Chart of the Day – S&P 500 slides below 4,000
US stocks recorded their worst day in two months. Both the blue-chip S&P 500 and the tech-heavy Nasdaq indices had their steepest daily losses since December 15. The broader benchmark broke down out of its recent messy price range.
The 38.2% Fib level of last year’s drop comes is at 3998. Below here is the 50-day SMA at 3978. This comes ahead of the long-term downtrend support from the January high last year. The 200-day SMA is right here too at 3941.