


Vantage uses cookies that are essential for our website to work. We also use optional analytical cookies to help us to improve our website and the services, content and ads we provide to you which you can accept or reject here. Please see our Cookies Policy for more information on how we use cookies.
CFDs and Spread Bets are complex instruments and come with a high risk of losing money rapidly due to leverage. 73.5% of retail investor accounts lose money when trading CFDs and Spread Bets with this provider. You should consider whether you understand how CFDs and Spread Bets work and whether you can afford to take the high risk of losing your money. Please seek independent advice if necessary.
Headlines
* Fed officials float even higher rates after CPI data keeps FOMC on hike path
* US dollar finds friends after sticky US inflation readout
* US stocks stabilise after data raises interest rate fears and rates near 5.25%
* Gold futures seen dipping after volatile trading session
FX: USD dipped to a new low at 102.58 in the immediate aftermath of the US inflation data release. But buyers stepped in and the index is back in its 6-day range above 103. The longer it trades in narrow ranges, the bigger the breakout should be. The benchmark US Treasury 10-year yield posted another new cycle high at 3.79%. Only the high at 3.84% on the first trading of the year has beaten this level. The 100-day SMA remains at 3.74%. The 2-year yield which tracks the Fed fund rate closely popped higher to levels last seen in early November.
EUR spiked higher to 1.0804 before pulling back to close nears its lows around 1.07. The 50-day SMA at 1.0714 continues to act as a pivot with prices trading around this level. GBP made a high of 1.2269 before sellers hits the bids. UK CPI data is released shortly which will most likely cement another 25bps rate hike in March. USD/JPY traded to a five-week high of 133.31 as Treasury yields burst higher. The 50-day SMA at 132.07 now looks like support. AUD remains below 0.70. USD/CAD dropped to 1.3273 near the lows of the recent move. But it printed a doji candle and is back in the recent range above 1.33.
Stocks: US equities were choppy after the CPI data. They traded in the red but eventually finished mixed on the day. The S&P 500 dropped as much as 1% in early trading. But the benchmark blue-chip index ended flat. That means it held on to gains made in a strong start to the week. The tech-heavy Nasdaq rose 0.71%. It had fallen as much as 1.1% in the morning. It was boosted by tech stocks including Tesla and chipmaker Nvidia which rose 7.5% and 5.4%, respectively. The Dow close down, finishing 0.46% lower. That mid-August resistance level at 34,281 is proving tough to beat!
Asian stocks slipped led by drops of more than 1% in Australia and Jong Kong. The Nikkei 225 sank, reversing a small early gain.
US equity futures are in the red. European equity futures are also pointing to a soft open. The cash market closed mixed yesterday.
Gold continues to oscillate around its 50-day SMA at $1857. Prices slid to $1842 just above support before bouncing.
Data Breakdown – Sticky inflation sees more tightening priced in
Yesterday’s US CPI data showed us that the “disinflationary process” adopted by Fed Chair Powell recently is still just about intact. Both the headline and core annual figures came in mildly stronger than expected but still lower compared to the prior readings, while the monthly prints hit the consensus estimates. However, a core reading of 0.4% is still too strong for the Fed whose inflation target is 2%. Economists believe an increase of around 0.17% m/m is needed over time to hit this goal.
Bond markets are worried about a slowing in the pace of decline in price pressures. There will be much focus on services inflation going forward, as these prices remain elevated and sticky. The “super core” number, which excludes housing and is Powell’s key variable, remains uncomfortably high and is consistent with another couple of 25bp rate hikes. Concerns about the tight labour market may also linger while the new seasonal adjustment is likely to be modestly inflationary.
The big market move was in US Treasury yields which rebounded strongly from their selloff. Money markets have pushed the Fed funds terminal rate higher by a few basis points and it now stands around 5.27% in July. There is now less than a 25bp rate cut priced in by the end of the year. Notably, stocks are turning a blind eye. But how long this lasts for is obviously key.
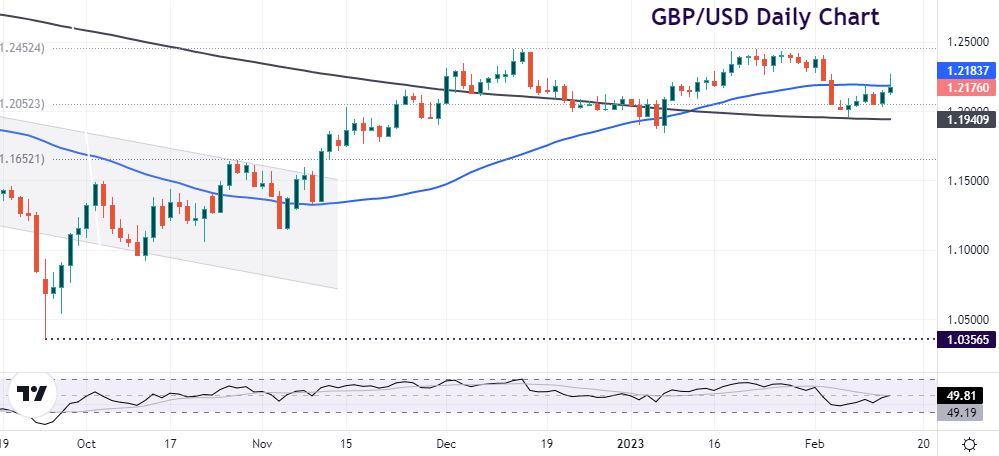
Chart of the Day – Cable awaits CPI
After the strong wage growth seen yesterday, the UK gets its own inflation data release this morning. Expectations are for a still double-digit headline print which is more than five times the MPC’s target of 2%. Policymakers are chiefly concerned with wage dynamics at the moment. The labour market remains very tight with the jobless rate near record lows. Earnings were the highest they’ve been and second only to the pandemic. We also get another inflation report before the next BoE meeting on 23 March.
GBP/USD found support at its 200-day SMA at 1.1940 last Monday. Yesterday saw gains through the 1.22 zone which includes last week’s high. But it looks like we have slipped back into consolidation mode with range trading above 1.20. The midway point of last year’s downtrend is at 1.2052.