
Vantage uses cookies that are essential for our website to work. We also use optional analytical cookies to help us to improve our website and the services, content and ads we provide to you which you can accept or reject here. Please see our Cookies Policy for more information on how we use cookies.
CFDs and Spread Bets are complex instruments and come with a high risk of losing money rapidly due to leverage. 73.5% of retail investor accounts lose money when trading CFDs and Spread Bets with this provider. You should consider whether you understand how CFDs and Spread Bets work and whether you can afford to take the high risk of losing your money. Please seek independent advice if necessary.
Headlines
* Equities fall on risk aversion, with 2023 and China reopening in focus
* Dollar continues to consolidate in another narrow range trading session
* Asian shares slip as Covid surge in China makes investors uneasy
FX: USD again traded in thin conditions. The DXY remains below the mid-August low at 104.63. The cycle low sits at 103.44. US Treasury yields advanced higher for a fourth day. The 10-year yield made a new high at 3.89%. The 50-day SMA is at 3.80%, while 3.90% is a Fib level.
EUR/USD continued to trade in a tight range. It hasn’t managed to close above the pandemic low at 1.0636 since mid-December. GBP/USD remains below its 200-day SMA at 1.2048. USD/JPY is reversing yesterday’s gains and back below 134. AUD again popped higher before closing nears its lows.
Gold is consolidating below $1820. The new cycle high is at $1833.
Stocks: US equities finished over 1% lower as fears over China covid infections resurfaced. The benchmark S&P closed1.2% down. The tech-laden Nasdaq ended off 1.35% as Apple dropped over 3%. Apple volatility continues to move sharply higher which is not a good sign for the overall market. The key level is $125. The Dow closed in negative territory, lower by 1.1%.
Asian stocksweakened with the broadest index of Asia-Pacific excluding Japan equities down 0.58%. The Hang Seng is down 0.79% as unsettled investors cast doubt over chances of a swift recovery in the world’s second largest economy after the relaxation of stringent Covid curbs. US equity futures are mildly positive. European equities are lower to start off the penultimate day of trading in 2022.
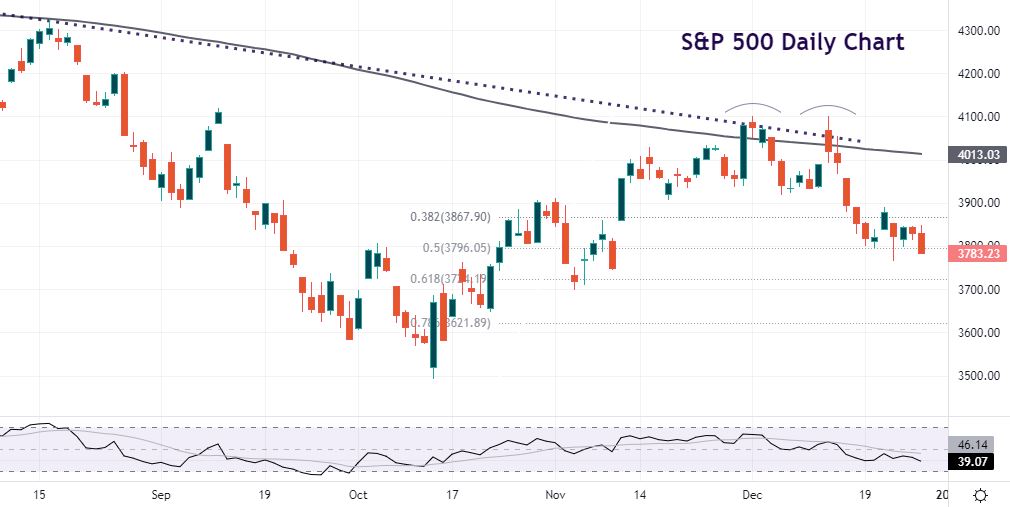
Chart of the Day – S&P 500 takes out near-term technical level
As much as we are aware of thin holiday volumes, markets can still trade on technical levels. The more than 1% fall in the benchmark S&P 500 index yesterday took out the 50% Fib level of the October rally at 3796. The area around this level has acted as support over the past week or so. But yesterday’s close below might now mean that sellers are in charge.
There is the semblance of a double top pattern around 4100. Prices were capped at the falling trendline and the 200-day SMA. The measure move of the double top means a downside target around 3760. Below here is the November low at 3698. The Fed pivot is key for stocks next year. In the meantime, festive markets are focusing on the China story and rising Treasury bond yields.
Fast & easy account opening
-
Register
Choose an account type and submit your application
-
Fund
Fund your account using a wide range of funding methods.
-
Trade
Access 1000+ CFD instruments across all asset classes on MT4

About us
Vantage is a global, multi-asset broker offering clients access to a nimble and powerful service for trading CFDs on Forex, Commodities, Indices, Shares.
With more than 10 years of market experience and headquartered in Sydney, Vantage now has over 1,000 staff across more than 30 global offices.
Vantage is more than a broker. It provides a trusted trading ecosystem that enables clients to achieve their own success, in a faster and simpler manner.
Empowering you to better trade on the right market opportunities. trade smarter @vantage.