
Vantage uses cookies that are essential for our website to work. We also use optional analytical cookies to help us to improve our website and the services, content and ads we provide to you which you can accept or reject here. Please see our Cookies Policy for more information on how we use cookies.
CFDs and Spread Bets are complex instruments and come with a high risk of losing money rapidly due to leverage. 73.5% of retail investor accounts lose money when trading CFDs and Spread Bets with this provider. You should consider whether you understand how CFDs and Spread Bets work and whether you can afford to take the high risk of losing your money. Please seek independent advice if necessary.
With a daily trading volume of around $6.6 trillion and a market capitalisation of $2.409 quadrillion, the forex or foreign exchange market is the world’s largest financial market. The market is expected to grow from a value of $702 billion in 2021 to around $1.07 trillion by 2027, according to market research firm IMARC Group. This represents a CAGR (compounded annual growth rate) of 7.3%. The immense popularity means that the forex market has very high liquidity and presents numerous opportunities to trade daily and use trading indicators effectively.
So, how do you determine the most exciting exchange rates at which to place your trades? Also, how do you mitigate or manage risk? This is where forex indicators come to play. Both experienced and novice traders can use indicators to understand market movements, place trades and minimise risk.
What are Forex Trading Indicators?
Forex trading indicators are possibly the most important tools for technical analysis. These indicators are mathematical calculations that you can use on a price chart. You see the indicators as lines plotted as per the calculations and results. Forex indicators help traders to analyse the price movement of currencies, identify the price trends and determine the prices at which to place bid and ask orders.
In the financial markets, it is crucial to time your entry and exit correctly. Failing to do this can lead to a loss, especially in highly volatile markets. This underlines the importance of using trading indicators to make calculated decisions.
Broadly speaking, there are two types of forex trading indicators – leading and lagging indicators. While leading indicators are those that use past price data to help predict future price movements, lagging indicators provide signals after a price movement has occurred or is in progress. Traders use lagging indicator to confirm the momentum in the market.
How Do These Indicators Work?
Forex trading indicators are based on the assumption that history repeats itself or that past patterns in the market will repeat and a similar situation will arise going ahead. Forex indicators look at the market as a pattern and try to indicate how the market will behave in specific situations. Data of past price movements are accrued and mathematically plotted on price charts to help make predictions.
At times, the market may respond to external events. Here, too, forex indicators can be used to make better predictions. For example, let’s say inflation is rising in a country. Every time the data is released, the local currency moves against other currencies. A trader can use forex indicators to determine the patterns formed before and after every release of inflation data. This allows the trader to make predictions before the next inflation data release. There are some market-moving events, like geopolitical turmoil, or some important economic releases, like the US NFP (nonfarm payroll) report. Traders can apply forex indicators to historical charts to understand how the market responded to these.
10 Most Popular Forex Trading Indicators
There are several forex trading indicators available for free on MetaTrader 4 and MetaTrader 5. Of these many indicators, there are a few that are all-time favourites among forex and other traders across the world. Here are the top ten forex indicators that FX traders use most actively.
#1 – Moving Averages
These are used to identify the direction of price movements. Here, the indicator eliminates short-term price spikes and takes into account the averages of a forex pair’s movements over a longer (specified) timeframe. This gives traders an idea of the overall price trend.
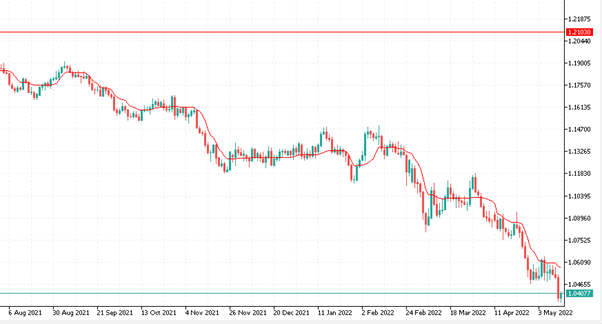
MA can be of different timeframes, the most popular being the 10, 50, 100, and 200 days. For instance, the200-day MA considers data over 200 days, while the 10-day MA averages data every 10 days. MA is used by traders not only to identify entry points, but also to determine support and resistance levels.
#2 – MACD
Moving Average Convergence and Divergence (MACD) helps identify changes in momentum. The indicator combines an exponential moving average (EMA) and a histogram. When two EMAs seem to be coming together, it indicates a decrease in momentum. On the other hand, when two EMAs move away from each other, it indicates a decline in the current momentum. A market reversal is indicated when there is a consistent divergence between MACD and price.
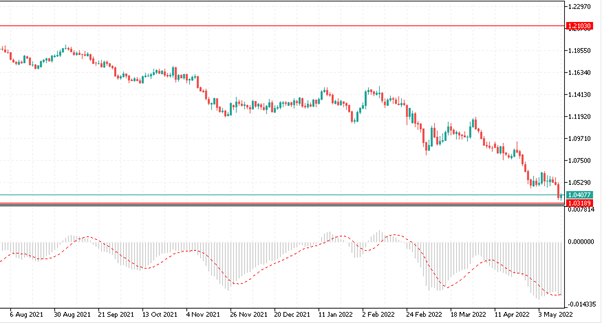
Traders can use this indicator for timing entry into the market by identifying a market reversal and continuation of price trend.
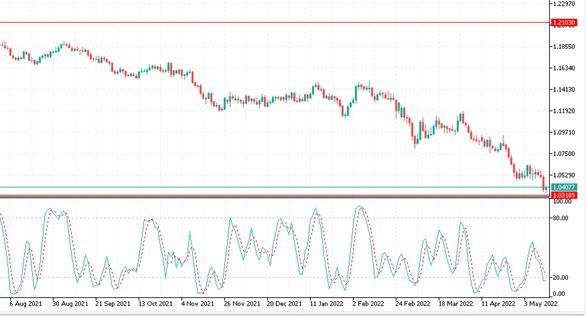
#3 – Stochastic Oscillator
This is a momentum indicator that has been in the use since the 1950s and continues to be highly popular for identifying overbought and oversold territories in the FX market. It moves between the range of 0 to 100 and indicates the point from where the price may reverse. If the price breaches the level of 70, it indicates a bearish reversal. If the price moves below 30, it indicates a bullish reversal.
#4 – Fibonacci Retracement
Fibonacci gives the “golden ratio” of 1.618, which yields three “magic” numbers: 23.6%, 38.2% and 61.8%. For forex trading, the indictor typically applies only two of these to the charts: 38.2% and 61.8%. This is done to identify the so-called “hidden” support or resistance levels. When there is a sudden spike in the price, it is often followed by a decline. The indicator marks the 38.2% level (38.2% of the rise) and the 61.8% level on the price chart to indicate possible reversal moves.
Although 50% is not part of the Fibonacci series of numbers, many traders consider this too. You can customise the levels on MT4 and MT5. If prices are in an uptrend, followed by a retracement down to a major support level, many traders may decide to go long. Similarly, when prices move to a key resistance level amid a broader downtrend, traders may choose to go short.
#5 – Parabolic SAR
This indicates bullish and bearish markets. The overall market trend is identified as bullish if the parabolic SAR falls below the price of the currency pair. If, on the other hand, the parabolic SAR remains above the price, the overall trend for the forex pair is identified as bearish.
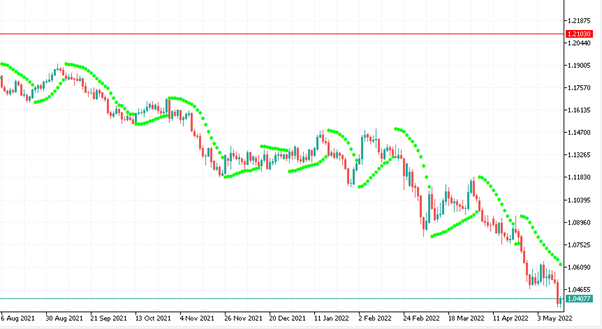
When the price crosses Parabolic SAR lines, the indicator typically turns, signalling the end of a trend. When this happens, the maximum or minimum price from the previous period is taken as the starting point. This indicator is most used for determining exit points.
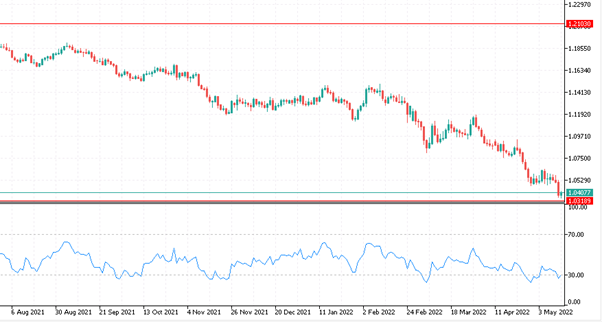
#6 – RSI or Relative Strength Index
This is one of the most popular leading indicators, meaning that it signals price movements before they occur. RSI helps understand the current momentum in the market and overall market condition. It helps identify overbought and oversold zones and also highlights when the price has become too risky. This indicator is expressed as a number between 0 to 100. If the figure is around 70 for a particular currency pair, it signals an overbought zone, while numbers below 30 suggest the asset is oversold.
If the RSI signals an overbought market, it indicates that a price correction is just around the corner. This means whatever gains the trader was planning with the current direction is about to come to an end and may very quickly turn into a loss. Novice traders often wait it out when the RSI signals a correction. On the other hand, if the RSI signals an oversold market, it means shorting opportunities are nearing an end and the price may rally going ahead.
#7 – Ichimoku Cloud
In Japanese, “ichimoku” means “one look.” This indicator has been given this name because it provides a huge amount of information in a single chart. One can determine several aspects of the price trend, including the momentum, direction, volatility, and potential reversals, in just one glance. With this information, a trader can determine entry and exit points as well as support and resistance levels.
When the price is above the ichimoku cloud, the overall trend is considered as bullish. When the price is below the cloud, the overall market trend is bearish.
#8 – Elliott Wave
This indicator tries to identify recurrent price patterns associated with changes in trader sentiment and trading psychology. The theory on which this indicator is based relates to the fractal nature of markets. Fractal is a curve or figure of which each segment has the same statistical characteristic as the whole. Take the snowflakes or a broccoli for instance. In these, similar patterns recur at progressively smaller scales to make up the whole.
The indicator tries to identify sets of waves that are nested within a larger wave, such that the smaller segments and the larger wave have the same pattern. These patterns alternate between an impulsive (also called motive) phase and a corrective phase. The impulse phase is divided into a set of 5 smaller (lower degree) waves, all of which alternate between motive and corrective. So, even within an impulse phase, waves 1, 3, and 5 are smaller impulse phases, while waves 2 and 4 are smaller corrective phases. The indicator is often used to confirm the market trend and determine stop-loss and take profit orders.
#9 – Bollinger Bands
This indicator uses simple moving averages or standard deviation to determine envelopes or ranges within which the price tends to move. The width of the band increases and decreases when there is volatility. When the bands are closer, it reflects low volatility, while the wider they are, the higher the volatility.
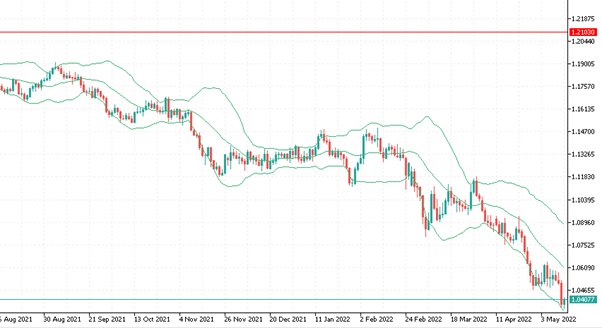
If prices move outside the Bollinger Bands, it shows that the asset is trading outside its typical levels. When prices continually remain outside the upper band, it indicates an overbought market. Similarly, when prices move below the lower band, it indicates an oversold market. Bollinger Bands are often used in combination with RSI to determine entry and exit positions as well as stop loss and take profit prices.
#10 – Pivot Point
This indicates the equilibrium level of demand and supply of currency pairs. If the price reaches the pivot point on the chart, it means demand and supply are at the same level. If the price moves above the pivot point, it indicates that the demand for the currency pair is high, while if the price moves below the pivot point, it indicates that supply is higher. When demand exceeds supply for a currency, it exerts an upward push on the price. Similarly, when supply is higher than demand, there is a downward push on the price.
How to Use Forex Indicators Effectively?
Since there are many useful forex trading indicators, choosing the right one can take time.
It’s a good idea to use more than one indicator. This can help confirm the results shown by the other. However, when doing so, it’s best to choose complementary indicators. These are indicators that work well together, without providing redundant results. For this, you will need to combine different types of indicators. For instance, you may combine a momentum (like the stochastic oscillator) with a trend indicator (like the Parabolic SAR or moving averages). You can also combine a volatility indicator (like Bollinger Bands) with a momentum indicator (like the RISE or MACD).
On the other hand, avoid using too many indicators. Two or three should be enough for you to determine the market condition. Using more than that can cause information overload and cause your chart to appear messy, which may lead to errors. So, if two indicators provide the same signal, choose one of them.
You may need to change the indicators you use depending on market conditions or if you’re considering a change in your trading strategy or trading style.
When using more than one indicator, you’ll need to ensure your chart is easy to read. This can be done by choosing contrasting colours so that the data is easily visible. You could also consider using two monitors, or maybe your laptop and smartphone, when actively trading. You can view the indicators on one screen and set your orders in another screen to avoid making mistakes. Also, choose a font style that you are most comfortable with.
If you are using MetaTrader 4 (MT4) or MetaTrader 5 (MT5) for trading, you can easily customise the colour, font, and even background colours, so that the charts are well organised and easier to read.
Using forex indicators can save a lot of time and help understand price movements better. They can also aid quick decision making, especially when sudden opportunities arise in a volatile market. Technical indicators can help keep emotions in check and make the most of market opportunities.
Fast & easy account opening
-
Register
Choose an account type and submit your application
-
Fund
Fund your account using a wide range of funding methods.
-
Trade
Access 1000+ CFD instruments across all asset classes on MT4

About us
Vantage is a global, multi-asset broker offering clients access to a nimble and powerful service for trading CFDs on Forex, Commodities, Indices, Shares.
With more than 10 years of market experience and headquartered in Sydney, Vantage now has over 1,000 staff across more than 30 global offices.
Vantage is more than a broker. It provides a trusted trading ecosystem that enables clients to achieve their own success, in a faster and simpler manner.
Empowering you to better trade on the right market opportunities. trade smarter @vantage.