


 Login





Why USD/JPY Stayed Pinned Near 158 as US Yields Outweighed Tokyo – USDJPY Analysis

Vantage Editorial Team >
Vantage Editorial Team >
Vantage is a global, multi-asset broker with a team of in-house writers and market analysts who produce educational and insightful trading content for traders of all levels.
 Updated Mon, 2026 October 12 02:52

Key Takeaways
- USDJPY traded at 158.017 at 10:29 (GMT+8) on 9 October 2026, inside a roughly 156.95 to 158.50 range that has held since 1 October.
- The three deepest hourly dips since 1 October, to near 157.26, 156.95, and near 157.52, all came in US trading hours.
- The Federal Reserve’s range sits at 3.75% to 4.00% against the Bank of Japan’s 1.25%, after both raised rates in September.
USDJPY traded at 158.017 at 10:29 (GMT+8) on 9 October 2026, and the past week’s USD/JPY news told two very different stories. Japan did most of the talking: the finance minister, the central bank governor, and the prime minister all weighed in between 2 and 7 October. 1,2 The US did most of the moving, and we went through the hourly chart candle by candle to check.
That gap between where the news came from and where the price moved is what this piece unpacks: why US data and yields appeared to outweigh Tokyo, and what that changes into US inflation data on 14 October.
As of 10:29 (GMT+8) on 9 October 2026, USDJPY on the Vantage feed traded 0.10% higher on the hour at 158.017, after the yen weakened 2.75% against the dollar over the month to 8 October. 3 For Asia-based traders, timing is the practical problem: the deepest dips arrived between 20:30 and 02:00 (GMT+8).
Why Is USD/JPY Stuck Near 158?
USD/JPY held near 158 as of 9 October 2026, with US data and yields, not Japanese headlines, lining up with its deepest dips. The Fed’s 3.75% to 4.00% range sits well above the Bank of Japan’s 1.25%, and all three dips came during US hours.
Tokyo vs Washington: The Numbers Behind USD/JPY News Today
| Driver | Japan (Bank of Japan) | US (Federal Reserve) |
|---|---|---|
| Policy Rate | 1.25% | 3.75% to 4.00% |
| Last Move | +0.25 points, 18 September 2026 (7 to 2 vote) 4 | +0.25 points, 16 September 2026 (unanimous) 5 |
| Next Decision | 29 to 30 October 2026 | 27 to 28 October 2026 |
| Market Pricing for Next Meeting | About 25% chance of a hike (6 October) 1 | 80.6% chance of a hold (7 October) 6 |
| 10-Year Government Bond Yield, 8 October | 3.09% 7 | Near 5.23% 8 |
| Main Headlines Since 2 October | Katayama, Ueda, and Takaichi remarks | Payrolls, FOMC minutes, Waller, and Musalem |
| Deepest Hourly Dips Since 1 October | 7 October dip of about 0.45 yen near Takaichi’s remarks, largely retraced within two hours | Near 157.26 (1 October), 156.95 (2 October), near 157.52 (8 October) |
Data for the table above is referenced from the sources cited in each cell and from the Vantage USDJPY H1 chart on TradingView, as of 9 October 2026.
Three Deep Dips, All in US Hours
For most of the past seven sessions, USDJPY moved between about 157.50 and 158.40 on the hourly chart. The full range since 1 October, 156.95 to near 158.50, is about 1.55 yen, or 0.98% of the price. For a stretch packed with central bank talk, that is a small box.
The first dip came at about 22:00 (GMT+8) on 1 October, when an hourly candle on the Vantage feed wicked down to near 157.26 before closing back near 157.76. The sources reviewed for this piece do not tie it to a single release.
The deepest came at 20:30 (GMT+8) on 2 October. US payrolls showed 29,000 jobs added in September, against forecasts between 84,000 and 95,000. 9 USDJPY touched 156.95 within the hour, then closed the day near 157.86, a daily range of 1.28 yen. 10
The third came in the US session of 8 October. The US 10-year Treasury yield touched 5.35% in the European morning and ended near 5.23%, and US stocks slid around the time of a Financial Times report on OpenAI’s revenue, which Vantage has not independently verified. 8 USDJPY fell from near 158.37 to near 157.52 between 22:00 and 02:00 (GMT+8), about 0.85 yen in roughly three hours.
None of the three happened during Tokyo office hours.
All three dips started on the US side. So what did Japan’s own news do?
Tokyo Talked, the Chart Mostly Shrugged
Japan’s calendar was busy, which is why the muted reaction stands out.
- On 2 October, Finance Minister Satsuki Katayama said the government agrees reflation is over, backing the Bank of Japan (BoJ). 1
- On 6 October, Governor Kazuo Ueda kept further tightening tied to the data in his first major speech since the September hike. 1
- On 7 October, Prime Minister Sanae Takaichi said spending and revenue plans could be reviewed if bond yields moved unexpectedly. 2
FXStreet described the pair as flat through the Ueda speech, with futures on 6 October pricing about a 25% chance of a BoJ hike at the 29 to 30 October meeting. 1 On 8 October, even an August current account surplus of JPY4.06 trillion, against a JPY3.10 trillion forecast, saw the pair back above 158 before the Asian session ended. 8
The one late-Tokyo-session wobble came on 7 October. Shortly after Bloomberg reported Takaichi’s comments on yields, USDJPY dipped about 0.45 yen to near 157.87 around 15:00 to 16:00 (GMT+8), then largely retraced within two hours on the Vantage feed.
After our price cut-off, Bloomberg reported Takaichi saying on 9 October that a more competitive economy would “ultimately lead to maintaining trust in the yen”. 11
If Tokyo was not setting the pace, the answer sits in the rate gap.
The Rate Gap Behind the Range
Rewind to September. The BoJ raised its policy rate to 1.25% on 18 September 2026, its highest since 1995, on a 7 to 2 vote, and the yen weakened after the decision. 4 Two days earlier, the Federal Reserve (Fed) had lifted its range to 3.75% to 4.00%, 5 its first hike since 2023. 12
In plain terms, both central banks moved by the same quarter point, so the 2.50 to 2.75 percentage-point policy gap stayed where it was. A BoJ hike that leaves the gap untouched works a bit like walking up a down escalator: real effort, same spot.
The Federal Open Market Committee (FOMC) minutes, released on 7 October, showed most officials expected another hike before year-end, with no timing given. 5,13 CME FedWatch data on 7 October showed 80.6% of traders pricing a hold at the 27 to 28 October meeting. 6
Bond yields tell the same story. Japan’s 10-year government bond (JGB) yield eased to 3.09% on 8 October, close to 30-year highs. 7 The US 10-year ended that day near 5.23%, 8 roughly 2.14 percentage points higher.
This simplifies things: risk appetite, hedging flows, and intervention risk also move USD/JPY. MUFG Research noted that worries about the BoJ falling behind the curve have been the main driver of higher JGB yields since the Takaichi administration took office, particularly at 10 years. 14
So here is our read: the past week’s deepest USDJPY dips lined up with US data and US yields, while Tokyo’s remarks produced smaller moves that faded quickly.
Over the past week, Tokyo wrote the yen’s headlines, but USDJPY’s deepest dips arrived in US trading hours.
Analysts outside Vantage frame the same tension in their own ways.
What Analysts Are Saying About USD/JPY
Before the Fed minutes landed, Citi analysts expected them to show that officials “hold a range of views regarding future monetary policy”. 15 The minutes showed most officials favouring another hike by year-end, with no timetable, 5 which leaves single data prints room to jolt the pair.
Bank of America expects USD/JPY to stay range-bound, according to Investing.com on 9 October, and flagged three downside risks: the US midterm elections, a higher chance of intervention beyond 160, and stretched long equity positioning. 16
Intervention is the wild card. Japan and the US Treasury carried out a coordinated yen-support operation at the end of July. 17 In the days after, State Street Investment’s Masahiko Loo said traders “now have a new variable to price: policy reaction functions”. 18 The IMF and World Bank meetings in Bangkok from 12 October offer the next venue for joint messaging. 1
Views differ. The hourly chart is clearer.
USDJPY Chart: Price Caught Between Averages
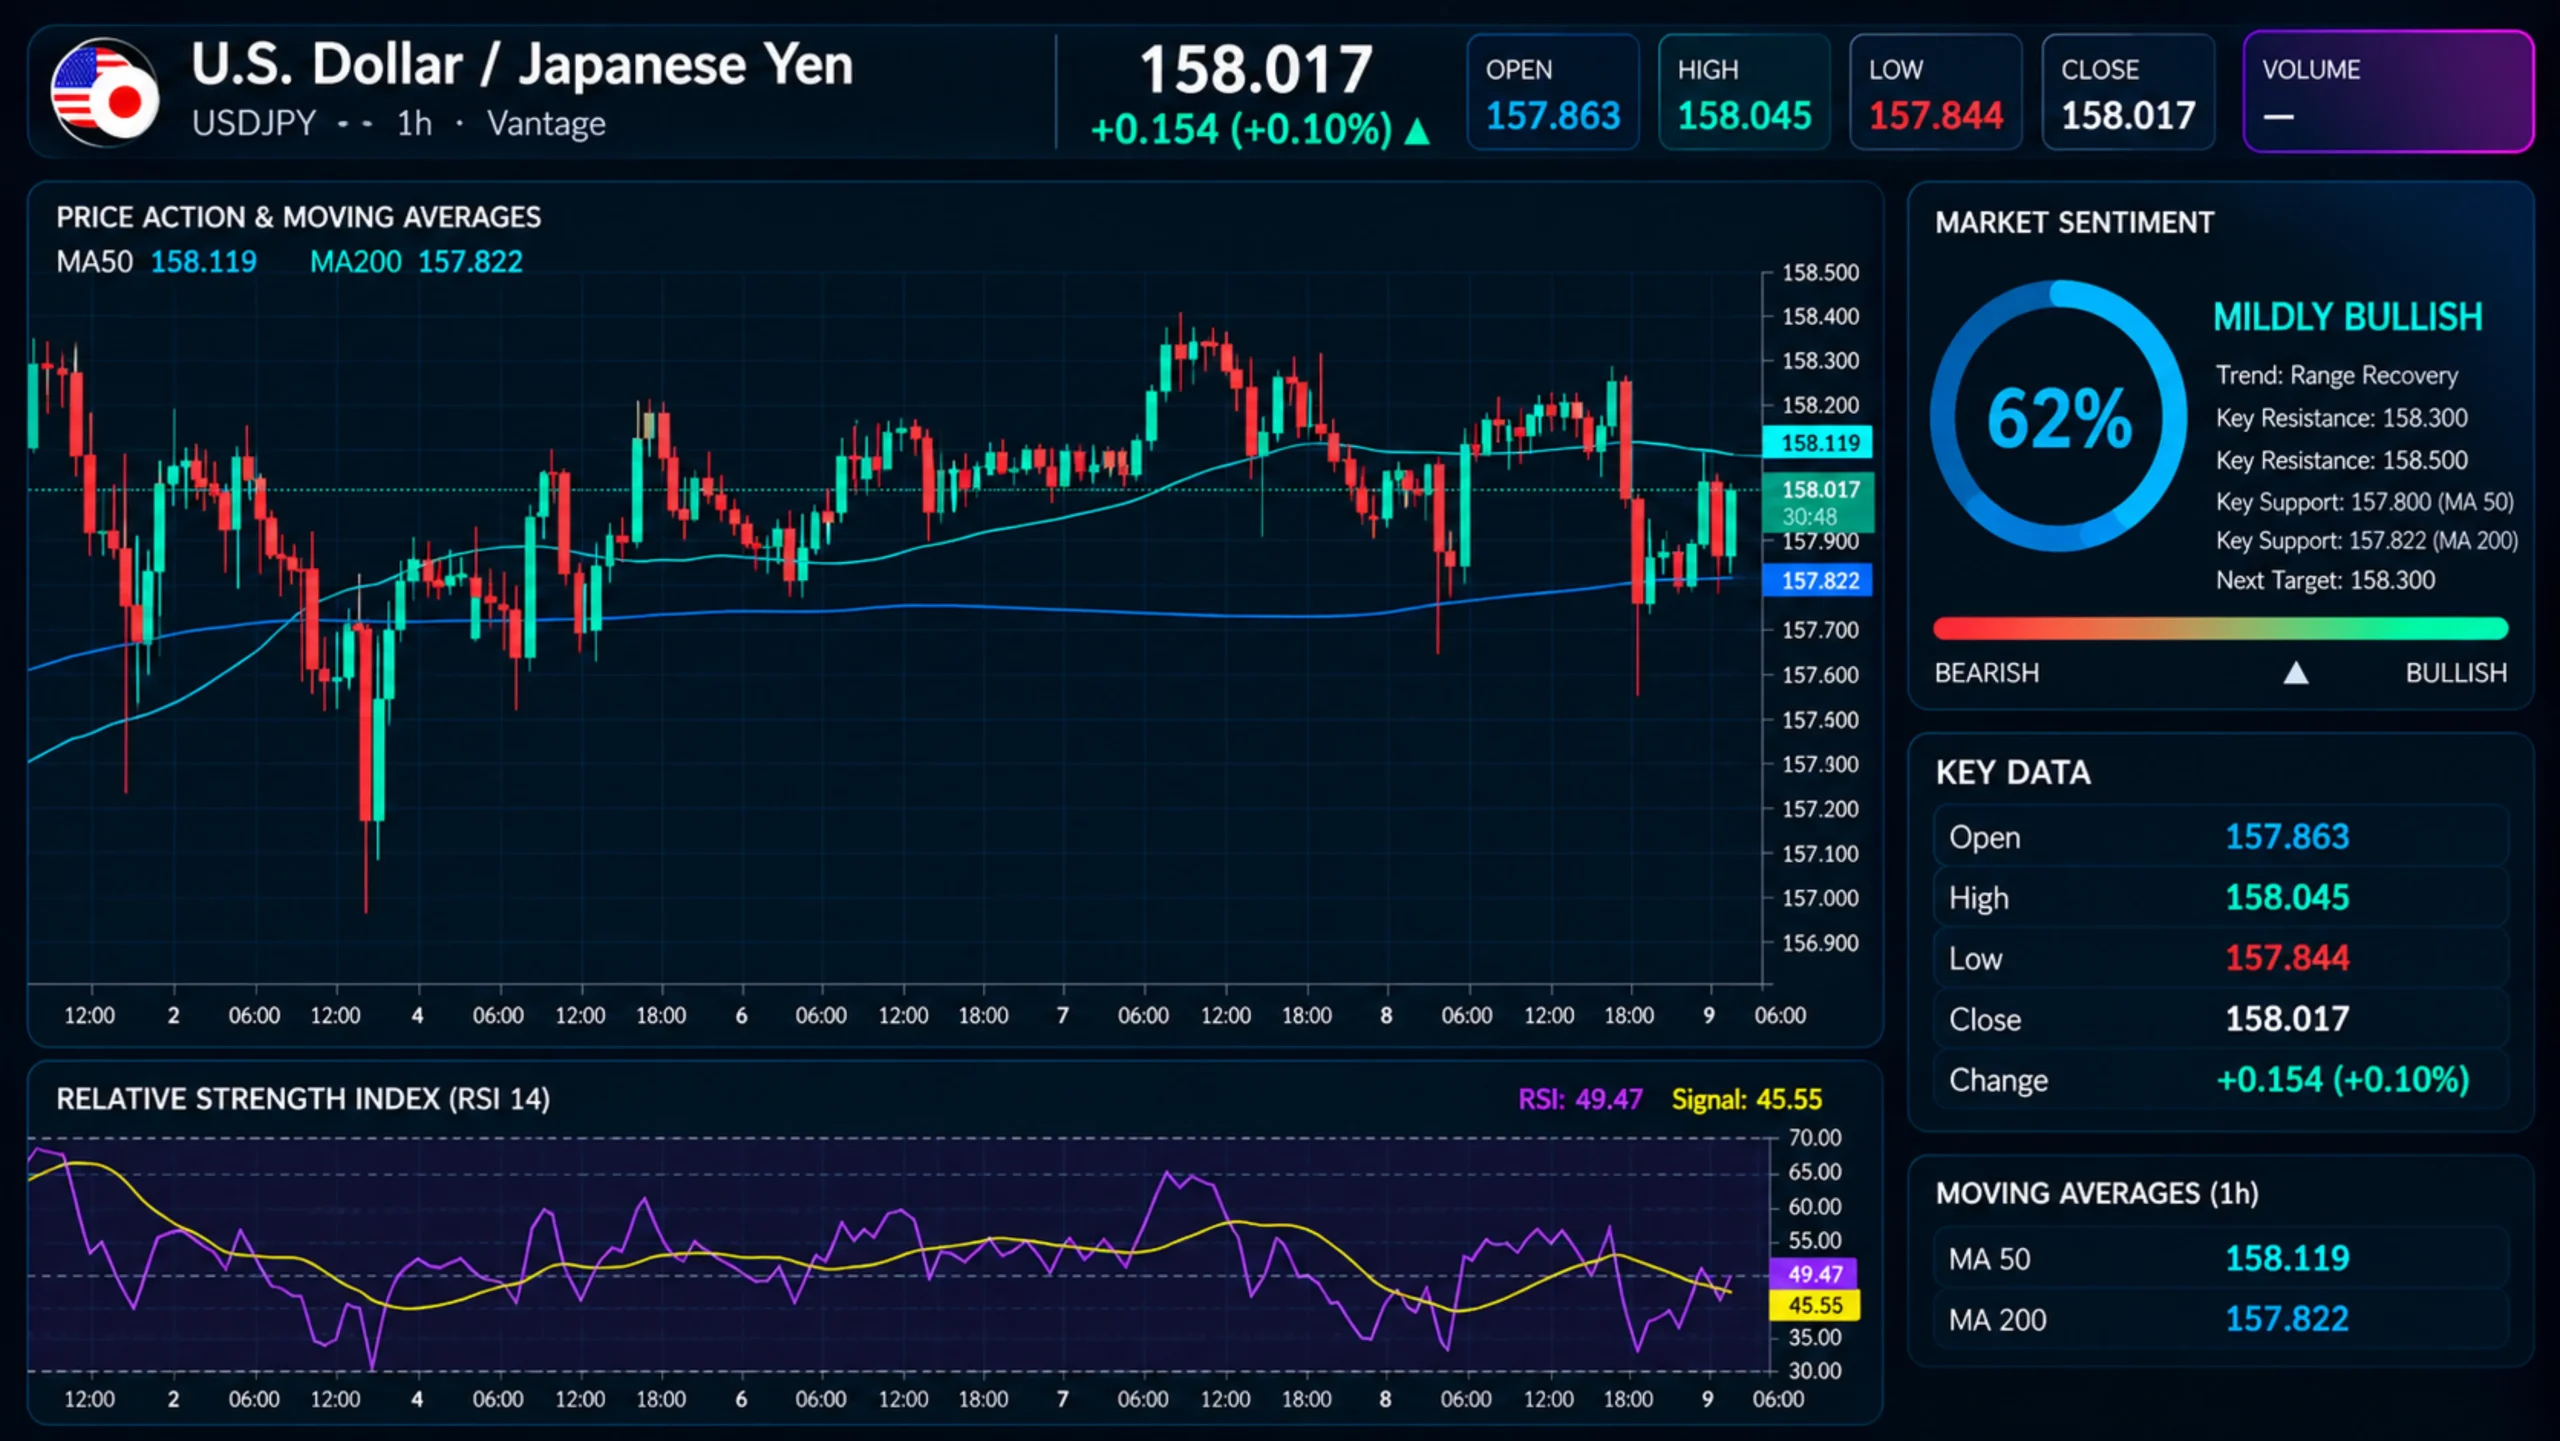
On the H1 USDJPY chart, price sat between its two moving averages (MAs) at the cut-off. The 50-period MA stood at 158.119 and the 200-period MA at 157.822, putting the pair about 0.10 yen below the first and 0.20 yen above the second as of 10:29 (GMT+8) on 9 October 2026.
The 50-period MA climbed from near 157.35 on 1 October to near 158.20 on 8 October, then eased to 158.12. The 8 October dip pushed price below both averages before it climbed back above the 200-period within hours.
One way to read this, using basic technical analysis: the two averages have framed a corridor about 0.30 yen wide. The read holds while price stays between them and weakens on an hourly close outside either.
The Relative Strength Index (RSI) stood at 49.47, with its signal line at 45.55, in the TradingView setup used for this analysis. That is about as close to a shrug as a momentum indicator gets; since 1 October it has ranged from near 70 at the start of the chart to near 30 after payrolls.
New to the pair? Vantage’s guide to trading USDJPY covers the basics. These averages and the extremes since 1 October set the levels traders are watching.
USD/JPY Levels Traders Are Watching
USDJPY H1 Levels as of 10:29 (GMT+8), 9 October 2026
| Level | Price | What It Marks |
|---|---|---|
| Range High | Near 158.50 | 7 October high; on 6 October, FXStreet noted no session above 158.50 since 24 September 1 |
| Level 1 Resistance | 158.12 | 50-period MA (H1) |
| Cut-Off Price | 158.02 | USDJPY on the Vantage feed at 10:29 (GMT+8) |
| Level 1 Support | 157.82 | 200-period MA (H1) |
| Level 2 Support | Near 157.52 | 8 October US-session low |
| Range Low | 156.95 | 2 October post-payrolls low 10 |
Levels read from the Vantage USDJPY H1 chart on TradingView, accessed on 9 October 2026, with the range low cross-checked against Investing.com historical data. Data indicative, for informational purposes only.
The calendar is far less undecided than the chart. Times below are in GMT+8:
- IMF and World Bank Meetings, 12 to 18 October: Bangkok, a likely venue for joint Tokyo and Washington currency messaging. 1
- US CPI, 14 October: September Consumer Price Index (CPI) at 20:30, the same slot as payrolls. 9
- Fed Decision, 29 October: FOMC statement at 02:00, after the 27 to 28 October meeting. 12
- BoJ Decision, 30 October: Policy decision and Outlook Report after the 29 to 30 October meeting. 1
What would change the read: an hourly close outside 156.95 to 158.50, or a Japan-side event producing the next wide move. Follow the latest USDJPY news today and US dollar news as those releases land.
USD JPY News Today: Quick Answers
What Is Moving USD/JPY Today?
US data and Treasury yields appeared to carry more weight than Japanese headlines; the 8 October dip lined up with the US 10-year falling to near 5.23%. 8
Why Did the Yen Weaken After the Bank of Japan Raised Rates?
The yen weakened after the 18 September hike, 4 and the Fed’s own hike two days earlier kept the policy gap at 2.50 to 2.75 percentage points. 5
Is This a USDJPY Forecast?
No. It reports market pricing and the levels traders are watching on the USD / JPY hourly chart, not a USD JPY forecast. The chart has been noncommittal enough without our guesses.
Overnight Data and Gap Risk
We started with a contradiction: Japan’s headlines, America’s chart. It had not resolved by the cut-off, and the next test lands at 20:30 (GMT+8) on 14 October, when US CPI arrives in the slot that set this month’s low. More forex news today and currency trading news coverage follows as the data lands.
The three deepest USDJPY dips since 1 October landed outside Asian hours, one covering 0.85 yen in about three hours. A Stop Loss can limit losses to a planned size, but in fast markets orders can be filled at a worse price than the level set, and overnight or weekend gaps can carry price past it. Our guide to forex risk management explains why.
Leverage magnifies losses as well as gains. At 1:100, a 0.54% move such as the 8 October dip equals roughly 54% of the margin posted on that position, so position size relative to account equity, not the leverage available, sets how much one move can reach. That double edge applies across forex trading.
Related Reading
RISK WARNING: CFDs are complex financial instruments and carry a high risk of losing money rapidly due to leverage. You should ensure you fully understand the risks involved and carefully consider whether you can afford to take the high risk of losing your money before trading.
Disclaimer: The information is provided for educational purposes only and doesn’t take into account your personal objectives, financial circumstances, or needs. It does not constitute investment advice. We encourage you to seek independent advice if necessary. The information has not been prepared in accordance with legal requirements designed to promote the independence of investment research. No representation or warranty is given as to the accuracy or completeness of any information contained within. This material may contain historical or past performance figures and should not be relied on. Furthermore estimates, forward-looking statements, and forecasts cannot be guaranteed. The information on this site and the products and services offered are not intended for distribution to any person in any country or jurisdiction where such distribution or use would be contrary to local law or regulation.
References
[1] “The Japanese Yen Flatlines Through a BoJ Speech That Changed Nothing – FXStreet” https://fxstreet.com/news/the-japanese-yen-flatlines-through-a-boj-speech-that-changed-nothing-202610062233 Accessed on 9 October 2026.
[2] “Takaichi Says Japan May Review Spending if Yields Move Sharply – Bloomberg” https://www.bloomberg.com/news/articles/2026-10-07/takaichi-says-japan-may-review-spending-if-yields-move-sharply Accessed on 9 October 2026.
[3] “Japanese Yen – Quote – Chart – Historical Data – News – Trading Economics” https://tradingeconomics.com/japan/currency Accessed on 9 October 2026.
[4] “Bank of Japan Lifts Rate to 31-Year High of 1.25% on Sept 18 – Nation Thailand” https://www.nationthailand.com/news/world/40071184 Accessed on 9 October 2026.
[5] “Fed Officials See Another Hike Coming, but No Sign as to When, Minutes Show – CNBC” https://www.cnbc.com/2026/10/07/fed-officials-see-another-hike-coming-but-no-sign-as-to-when-minutes-show.html Accessed on 9 October 2026.
[6] “Fed Officials View Another Rate Hike as ‘Likely,’ Meeting Minutes Show – The Hill” https://thehill.com/business/6135206-fed-officials-project-future-increases/ Accessed on 9 October 2026.
[7] “Japan 10 Year Government Bond Yield – Trading Economics” https://tradingeconomics.com/japan/government-bond-yield Accessed on 9 October 2026.
[8] “Financial & Forex Market Recap, Oct. 8, 2026 – Babypips” https://www.babypips.com/news/financial-forex-market-recap-2026-10-08 Accessed on 9 October 2026.
[9] “US Jobs Report September 2026: Payrolls Miss, Fed Hike Odds – Babypips” https://www.babypips.com/news/headline-us-jobs-report-september-2026-payrolls-miss-fed-hike-odds Accessed on 9 October 2026.
[10] “USD/JPY Historical Data – Investing.com” https://www.investing.com/currencies/usd-jpy-historical-data Accessed on 9 October 2026.
[11] “Japan’s Takaichi Says Growth Push Will Help Support Trust in Yen – Bloomberg” https://www.bloomberg.com/news/articles/2026-10-09/japan-s-takaichi-says-growth-push-will-help-support-trust-in-yen Accessed on 9 October 2026.
[12] “FOMC Minutes October 2026: Release Time and Preview – Admiral Markets” https://admiralmarkets.com/analytics/traders-blog/fomc-minutes-october-2026 Accessed on 9 October 2026.
[13] “Meeting Calendars, Statements, and Minutes (2021-2027) – Federal Reserve” https://www.federalreserve.gov/monetarypolicy/fomccalendars.htm Accessed on 9 October 2026.
[14] “Japan Economic & Financial Weekly – MUFG Research” https://www.mufgresearch.com/rates/japan-economic-financial-weekly-05-october-2026 Accessed on 9 October 2026.
[15] “Fed Minutes Could Detail Rate-Hike Decision, Policy Path – Reuters via Yahoo Finance” https://finance.yahoo.com/economy/policy/articles/fed-minutes-could-detail-rate-100347966.html Accessed on 9 October 2026.
[16] “BofA Sees Downside Risks for USD/JPY – Investing.com” https://www.investing.com/news/forex-news/bofa-sees-downside-risks-for-usdjpy-93CH-4938182 Accessed on 9 October 2026.
[17] “U.S., Japan Confirm Coordinated Yen Intervention, Signal Readiness for More – CNBC” https://www.cnbc.com/2026/08/03/yen-intervention-us-japan-trump-bessent-katayama.html Accessed on 9 October 2026.
[18] “A ‘Weaponized’ Yen: How the U.S.-Japan Intervention May Reshape Global Currency Markets – CNBC” https://www.cnbc.com/2026/08/07/japan-us-yen-intervention-global-currency-markets.html Accessed on 9 October 2026.
The information has been prepared as of the date published and is subject to change thereafter. The information is provided for educational purposes only and doesn't take into account your personal objectives, financial circumstances, or needs. It does not constitute investment advice. We encourage you to seek independent advice if necessary. The information has not been prepared in accordance with legal requirements designed to promote the independence of investment research. No representation or warranty is given as to the accuracy or completeness of any information contained within. This material may contain historical or past performance figures and should not be relied on. Furthermore estimates, forward-looking statements, and forecasts cannot be guaranteed. The information on this site and the products and services offered are not intended for distribution to any person in any country or jurisdiction where such distribution or use would be contrary to local law or regulation.
