


 Login





Why Gold Rebounded as Treasury Yields and Oil Eased – XAUUSD Analysis

Vantage Editorial Team >
Vantage Editorial Team >
Vantage is a global, multi-asset broker with a team of in-house writers and market analysts who produce educational and insightful trading content for traders of all levels.
 Updated Wed, 2026 October 14 02:51

- Vantage XAUUSD traded at $4,206.38 at 09:10 (GMT+8) on 12 October 2026, roughly $140 above its 7 October low near $4,066.
- US 10-year and 30-year Treasury yields hit 24-year highs on 5 October, then eased after a 30-year bond auction drew solid demand on 8 October.2,4
- CME FedWatch pricing for a December Fed rate hike rose from almost 70% on 6 October to 82% on 9 October.1,2
Gold prices today sit back above $4,200, and they got there in a week when markets raised their bets on a December Federal Reserve rate hike. Vantage XAUUSD showed $4,206.38 at 09:10 (GMT+8) on 12 October 2026, after an early Asia high of $4,217.23, while CME FedWatch put December hike odds at 82% as of 9 October.1 By the textbook, that’s a rough week to be a metal that pays no interest. Somebody forgot to tell the chart.
That gap is what this XAUUSD analysis today unpacks: why the gold price in USD climbed while rate-hike pricing moved the other way, what the move left on the hourly chart, and what the US Consumer Price Index (CPI) release on 14 October puts to the test.
Instrument snapshot: As of 09:10 (GMT+8) on 12 October 2026, Vantage XAUUSD traded at $4,206.38, 0.06% lower on the current hourly bar and about 3.5% above the 7 October low.
Why did Gold Rebound this Week?
Gold rebounded about $140 from its 7 October low to $4,206.38 by 09:10 (GMT+8) on 12 October 2026 as 30-year Treasury yields and oil prices eased, even though markets raised the odds of a December Fed rate hike to 82%, according to CME’s FedWatch tool.
Here’s the week side by side.
What Moved Gold, 5 to 12 October 2026
| Driver | Early Week (5 to 7 October) | Late Week (8 to 12 October) |
| US 30-Year Treasury Yield | Hit a 24-year high on 5 October 2 | Eased after a strong 30-year auction on 8 October 4 |
| Oil | Elevated on reports of possible US strikes on Iran; 11 dipped on 6 October after a G7 stockpile release 2 | Fell after President Trump ruled out an Iran strike before the midterms 11 |
| US Dollar | Firm, adding pressure on gold 3 | Rally paused 1 |
| December Fed Hike Odds | Almost 70% on 6 October 2 | 82% early on 9 October; above 85% later that day 1,13 |
| Gold (Vantage XAUUSD) | Low near $4,066 on 7 October | $4,206.38 at 09:10 (GMT+8), 12 October |
Table 1: Weekly drivers compiled from Reuters, Bloomberg, investingLive, Trading Economics and the Qatar News Agency; gold levels from the Vantage XAUUSD H1 chart on TradingView. Accessed on 12 October 2026.
Notice the fourth row. It’s the one that should have kept gold pinned down, and it didn’t.
Gold News: Hike Odds Rose, Gold Rose Anyway
The week started badly for anyone following gold news. US 10-year and 30-year Treasury yields hit fresh 24-year highs on 5 October,2 and by 7 October spot gold had slipped to its lowest level since 5 August as a firmer dollar and higher yields weighed on it.3 On the gold USD chart, that low printed near $4,066 at around 20:00 (GMT+8).
Analysts weren’t short of reasons for the slide. Saxo Bank’s head of commodity strategy, Ole Hansen, pointed to “macroeconomic headwinds from rising real yields and dollar strength.” 2 Market analyst Fawad Razaqzada told Reuters on 5 October that the risk of a near-term dip was “all to do with the fact that the dollar has been climbing higher.” 10
The Federal Reserve raised rates in September for the first time in three years, and a weak September payrolls report on 2 October cut the odds of an October hike to about 20%, from around 70% a week earlier.5 ANZ noted at the time that high bond yields and renewed energy inflation risks were still capping the metal.5 The spike to roughly $4,225 on the left edge of Figure 1 is that payrolls release, and it faded within hours.
Then came the part we keep coming back to. Pricing for a December hike climbed from almost 70% on 6 October2 to 82% early on 9 October,1 and above 85% later that day.13 October odds edged down from 21% to 18% over the same days,1,2 so markets pushed the expected hike later rather than dropping it. St. Louis Fed President Alberto Musalem said on 8 October that rates should rise over the next six to nine months, though he stopped short of backing a move this month.[4] Gold, meanwhile, climbed about $140 from its 7 October low.
If the Fed’s expected path turned more hawkish, something else was doing the heavy lifting.
Bond Market and Oil Did the Lifting
Two things gave way on 8 October, and neither of them was the Fed. A 30-year US Treasury auction drew solid demand, and the bond market rally pulled long-dated yields back from their highest levels in more than two decades, with yields lower across maturities. Separately, President Donald Trump posted on Truth Social that the US was having productive discussions with Tehran and would not attack Iran before the midterm elections.11 Oil fell as markets unwound part of the escalation premium built on earlier reports that strikes were being weighed.11
Each of those reaches gold through a different door. Lower long-dated yields shrink the income an investor gives up by holding bullion instead of bonds. Cheaper oil eases the inflation worry that keeps rate-hike pricing alive in the first place. (Our gold trading guide walks through how these rate links work.)
OCBC strategist Christopher Wong said the rebound “appears to be driven largely by some relief in the US Treasury market,” and cautioned against reading too much into it while inflation concerns linger.
That’s the twist in this week’s gold rate news. The rebound tracked long-end yields and crude rather than the expected path of the policy rate, which shifted later rather than lower, and those two dials can move apart for a while. Last week, one eased while the other kept turning.
Gold’s rebound came from the bond and oil markets. The Fed’s expected path moved the other way.
A fair warning: that’s a simplification. The dollar’s rally also paused over the same days,1 and real yields fell alongside oil after the Truth Social post,11 so no single driver can be isolated cleanly.
So much for the why. The hourly chart shows what the rebound left behind.
XAUUSD Technical Analysis Today: Averages Converge
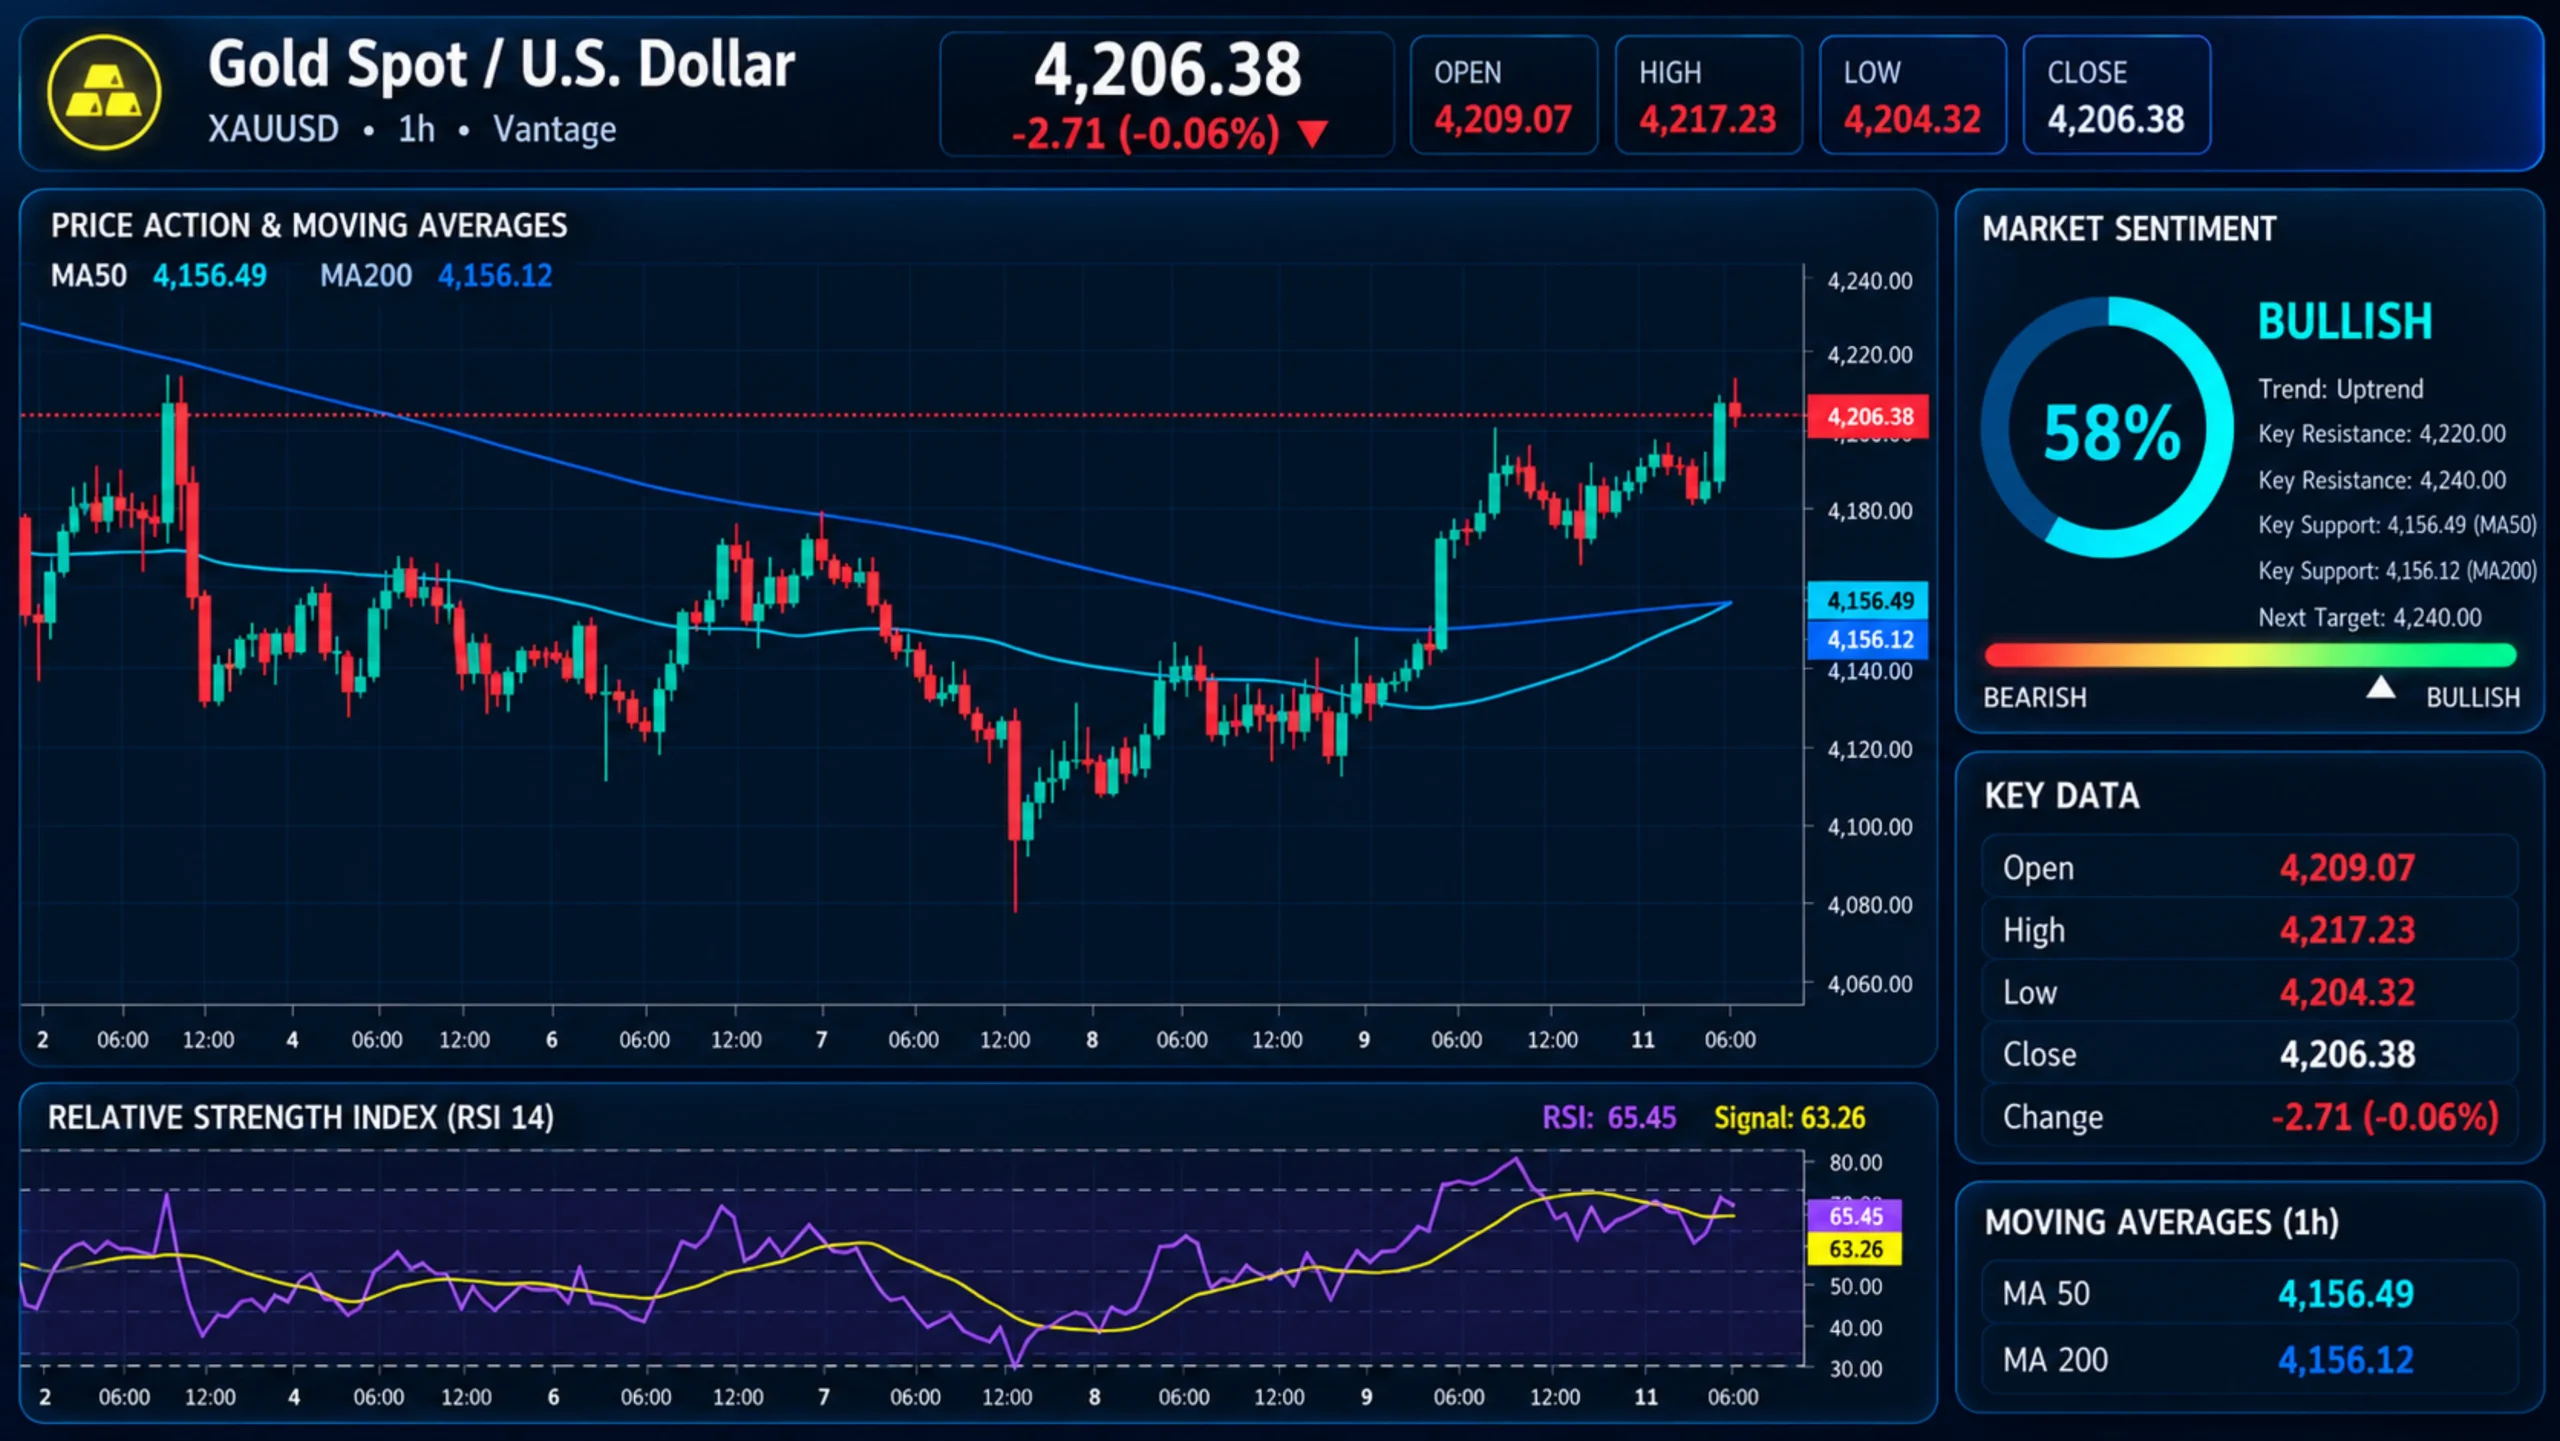
The hourly structure changed on 9 October. Price broke above both moving averages in early Asia trade and reached about $4,207 by mid-afternoon (GMT+8), then spent the rest of Friday holding a band between roughly $4,170 and $4,200. Monday’s open pushed through the top of that band to $4,217.23, before price eased to $4,206.38 by 09:10 (GMT+8) on 12 October.
On the TradingView setup used for this analysis, the two moving averages read $4,156.49 and $4,156.12 at the cut-off. Going by how the lines behave, the faster 50-period average (the steeper, rising line) has just edged above the 200-period average, which sloped down for most of the window before flattening. Thirty-seven cents apart, the two lines are close enough to share an umbrella, and a crossover this fresh on an hourly chart says little about direction on its own.
Momentum tells a cooler story than price. The 14-period Relative Strength Index (RSI) on the same setup fell to about 26 near the 7 October low, peaked near 77 on Friday afternoon (GMT+8), above the 70 line many traders use to mark stretched conditions, and read 65.45 at the cut-off against 63.26 for its own moving average. Price set a marginally higher hourly high on Monday while the RSI stayed below its Friday peak. Warm, then, though no longer running a fever.
On its own, that gap describes slowing momentum on one timeframe. It doesn’t settle direction, and it doesn’t tell you which levels the market has already tested.
Gold Price Chart Today: Levels Traders Are Watching

These are the areas on the gold price chart today that traders are watching: reference points from past price action, not signals. Vantage’s gold price news tag collects ongoing coverage.
XAUUSD Levels as of 09:10 (GMT+8), 12 October 2026
| Level | Price Area | Why It Is on the Chart |
| Level 1 Resistance | Near $4,225 | 2 October spike high after the payrolls release |
| Session High | $4,217.23 | High of the 12 October hourly bar in early Asia trade |
| Level 1 Support | Near $4,170 | 9 October pullback low inside Friday’s band |
| Level 2 Support | Near $4,156 | 50- and 200-period moving averages, 37 cents apart |
| Level 3 Support | Near $4,100 | 8 October range floor; support area flagged by Saxo Bank 2 |
| Level 4 Support | Near $4,066 | 7 October low, gold’s lowest since 5 August 3 |
Table 2: Levels read from the Vantage XAUUSD H1 chart on TradingView as of 09:10 (GMT+8), 12 October 2026, with context from Reuters and the Qatar News Agency. Indicative only.
The XAUUSD news tag gathers related analysis. A level only tells half the story, though. The other half lands on Wednesday.
Inflation Data Tests Both Dials This Week
This week’s calendar tests both channels at once. The CPI headline speaks to the Fed path; the reaction in 30-year yields speaks to the channel that lifted gold last week. Vantage’s CPI news tag collects coverage of the release. Monday 12 October is Columbus Day, a Federal Reserve holiday, so the Fed’s daily statistical releases move to 13 October.8 All times are GMT+8.
- Fed’s Hammack, 13 October, 00:10: Cleveland Fed President Beth Hammack speaks at the National Association for Business Economics annual meeting.12
- US CPI (September), 14 October, 20:30: The consensus on Investing.com’s calendar has annual CPI at 3.6%, up from 3.4% in August.6,7 That slot is dinner in Kuala Lumpur and breakfast in Washington.
- Fed Beige Book, 15 October, 02:00: The Fed’s regional survey of business conditions, released at 14:00 Eastern on 14 October.8
- US Producer Price Index (PPI) (September), 15 October, 20:30: A read on cost pressure further up the supply chain.7
- Fed Blackout, 17 to 29 October: Fed officials generally stop speaking publicly around the meeting, so fewer comments like Musalem’s reach the market.9
- Iran’s Reply, Date Not Set: Iran’s foreign minister said on 8 October that Tehran was reviewing Washington’s response and expected to reply within days.11
- Fed Rate Decision, 29 October, 02:00: The Federal Open Market Committee (FOMC) statement from its 27 to 28 October meeting, followed by the press conference at 02:30.8
What would change the read: the explanation in this piece weakens if 30-year yields climb back toward their 5 October highs while gold holds near current levels, because that would point to a driver other than yields. It holds while gold keeps tracking the long end of the curve rather than December hike pricing.
Last week opened on a contradiction: higher hike odds and a higher gold price. The bond and oil markets account for most of it. Whether that account still fits after Wednesday depends on which dial the CPI print turns.
Gold Price Questions, Answered
What is the gold rate today in the USA?
XAUUSD is the global spot reference for the gold price in dollars, and it stood at $4,206.38 per troy ounce on Vantage XAUUSD at 09:10 (GMT+8) on 12 October 2026. Anyone checking the gold rate today, USA retail buyers included, starts from that spot quote; coins and bars sold by US dealers add a premium on top. The gold rate in dollar today moves every second the market is open, so the XAUUSD page carries the gold price USD live and the latest gold rate USD quote.
Is this a gold price forecast or XAUUSD prediction today?
No. This article isn’t a gold price prediction or an XAUUSD forecast. What it can show is what markets are pricing: an 82% chance of a December hike as of 9 October,1 and a 3.6% CPI consensus for Wednesday.6 Any gold price forecast written this week faces the same CPI print, which tends to age forecasts quickly.
How does the gold futures price differ from the gold USD price?
The gold futures price for a later delivery month includes the cost of carrying gold until that date, so it usually sits above the spot gold USD price. On 9 October at 01:37 GMT, US gold futures traded at $4,194.40 while spot gold stood at $4,169.32.1
Volatility Risk Into the Inflation Print
Gold moved about $150 between its 7 October low and Monday’s high, and scheduled releases such as CPI can widen hourly ranges within minutes. A Stop Loss can limit losses to a planned size, but it doesn’t guarantee execution at that level: in a fast market, or when price gaps between sessions, an order can fill at a worse price.
Trading gold as a CFD involves leverage, which magnifies losses as well as potential returns relative to the margin committed. Leverage is double-edged, and its effect depends on position size relative to equity rather than on direction. Whether the horizon is longer-term XAUUSD investing or a position held through one data release, sizing as a percentage of account equity is a common risk framework in weeks when a single print can move price by more than a typical session’s range.
Related Reading
RISK WARNING: CFDs are complex financial instruments and carry a high risk of losing money rapidly due to leverage. You should ensure you fully understand the risks involved and carefully consider whether you can afford to take the high risk of losing your money before trading.
Disclaimer: The information is provided for educational purposes only and doesn’t take into account your personal objectives, financial circumstances, or needs. It does not constitute investment advice. We encourage you to seek independent advice if necessary. The information has not been prepared in accordance with legal requirements designed to promote the independence of investment research. No representation or warranty is given as to the accuracy or completeness of any information contained within. This material may contain historical or past performance figures and should not be relied on. Furthermore estimates, forward-looking statements, and forecasts cannot be guaranteed. The information on this site and the products and services offered are not intended for distribution to any person in any country or jurisdiction where such distribution or use would be contrary to local law or regulation.
References
[1] “Gold rises on softer dollar, easing yields; Fed outlook in focus – New Straits Times (Reuters)” https://www.nst.com.my/amp/business/economy/2026/10/1551082/gold-rises-softer-dollar-easing-yields-fed-outlook-focus Accessed on 12 October 2026.
[2] “Gold ticks up as softer Fed rate expectations offset higher yields – Kitco (Reuters)” https://www.kitco.com/news/off-the-wire/2026-10-06/gold-ticks-softer-fed-rate-expectations-offset-higher-yields Accessed on 12 October 2026.
[3] “Gold Recovers After Hitting Two-Month Low – Qatar News Agency” https://qna.org.qa/en/News-Area/News/2026-10/8/gold-recovers-after-hitting-two-month-low Accessed on 12 October 2026.
[4] “Gold Advances as Strong Demand Lowers Treasury Yields – Advisor Perspectives (Bloomberg)” https://www.advisorperspectives.com/articles/2026/10/09/gold-advances-strong-demand-lowers-treasury-yields Accessed on 12 October 2026.
[5] “Gold edges higher after weekly slide as weak jobs data ease Fed hike bets – Investing.com” https://www.investing.com/news/commodities-news/gold-edges-higher-after-weekly-slide-as-weak-jobs-data-ease-fed-hike-bets-4930980 Accessed on 12 October 2026.
[6] “U.S. Consumer Price Index (CPI) YoY – Investing.com” https://www.investing.com/economic-calendar/cpi-733 Accessed on 12 October 2026.
[7] “Schedule of Releases, October 2026 – US Bureau of Labor Statistics” https://www.bls.gov/schedule/2026/10_sched_list.htm Accessed on 12 October 2026.
[8] “October 2026 Calendar – Board of Governors of the Federal Reserve System” https://www.federalreserve.gov/newsevents/2026-october.htm Accessed on 12 October 2026.
[9] “Federal Reserve Calendars – Federal Reserve Bank of Chicago” https://www.chicagofed.org/utilities/about-us/federal-reserve-calendars Accessed on 12 October 2026.
[10] “Gold ticks higher on softer Fed outlook as strong dollar limits gains – Capital.com (Reuters)” https://capital.com/en-au/news/gold-ticks-higher-on-softer-fed-outlook-as-strong-dollar Accessed on 12 October 2026.
[11] “Gold erases its weekly losses as Trump rules out attacks against Iran before the midterm elections – investingLive” https://investinglive.com/commodities/gold-erases-its-weekly-losses-as-trump-rules-out-attacks-against-iran-before-the-midterm-elections/ Accessed on 12 October 2026.
[12] “Federal Reserve Events – Capital.com (Reuters)” https://capital.com/en-gb/news/federal-reserve-events Accessed on 12 October 2026.
[13] “Gold Advances as Oil Prices and Bond Yields Retreat – Trading Economics” https://tradingeconomics.com/commodity/gold/news/590678 Accessed on 12 October 2026.
The information has been prepared as of the date published and is subject to change thereafter. The information is provided for educational purposes only and doesn't take into account your personal objectives, financial circumstances, or needs. It does not constitute investment advice. We encourage you to seek independent advice if necessary. The information has not been prepared in accordance with legal requirements designed to promote the independence of investment research. No representation or warranty is given as to the accuracy or completeness of any information contained within. This material may contain historical or past performance figures and should not be relied on. Furthermore estimates, forward-looking statements, and forecasts cannot be guaranteed. The information on this site and the products and services offered are not intended for distribution to any person in any country or jurisdiction where such distribution or use would be contrary to local law or regulation.
