
CFDs and Spread Bets are complex instruments and come with a high risk of losing money rapidly due to leverage. 72.65% of retail investor accounts lose money when trading CFDs and Spread Bets with this provider. You should consider whether you understand how CFDs and Spread Bets work and whether you can afford to take the high risk of losing your money.


 Login


SEARCH
-
Search query too short. Please enter a full word or phrase.
-

Keywords
Popular Search


SEARCH
-
Search query too short. Please enter a full word or phrase.
-
Keywords
Popular Search



 Market Analysis Daily Analysis Why Applied Materials Stock Fell 31% as Chip Equipment Doubts Grew – AMAT Analysis
Applied Materials Stock NewsEarnings News TodayFeatured NewsFinancial NewsMicron NewsNasdaq News TodayNVIDIA NewsStock Market NewsStock Market News TodayStocksTechnical AnalysisVantage News
Why Applied Materials Stock Fell 31% as Chip Equipment Doubts Grew – AMAT Analysis

Vantage Editorial Team >
26 October 2026 | Daily Analysis | 20 min read
Vantage Editorial Team >
Vantage is a global, multi-asset broker with a team of in-house writers and market analysts who produce educational and insightful trading content for traders of all levels.

Key Takeaways
- The Applied Materials stock price closed at $377.24 on 23 October, about 31% below its 2 October high near $547 and about 24% below its 12 October close. 3
- The decline started on 6 October and deepened on 13 October, when the stock fell about 6.70% on the day of an investor event that gave no wafer fab equipment (WFE) spending forecast. 3,4
- The Philadelphia Semiconductor Index fell 6.72% on 22 October after Lam Research flagged supply limits, and Applied Materials reports fiscal Q4 results on or around 12 November. 7,9
Applied Materials (NASDAQ: AMAT) stock fell about 31% in three weeks, from near $547 on 2 October to $377.24 at the 23 October close. 3 Over the same stretch, the company set 2030 margin goals above today’s levels, and rival Lam Research (NASDAQ: LRCX) posted record revenue. 1,6 Good news in, lower prices out.
That close is the latest AMAT stock price today as of 01:43 (UTC) / 09:43 (GMT+8) on 26 October 2026; the final hourly bar on the TradingView chart printed $377.16, and TradingView’s overnight session quoted $376.33. It leaves the Applied Materials share price about 48% below its record close near $723 on 30 June. 4
So why is AMAT stock sinking while the company keeps talking up demand? That puzzle is what this piece unpacks: the market appears to have priced the timing of chip equipment spending rather than its size, and that shifts the risk picture into the 12 November results. Whether you typed stock price AMAT, AMAT stocks price, or $AMAT stock into a search bar, the answer starts in the same place.
Why Is AMAT Stock Down Today?
Applied Materials stock fell about 31% from its 2 October high to $377.24 at the 23 October close. The decline followed a 13 October investor day without a spending forecast and a 6.72% chip index drop on 22 October after Lam Research flagged supply constraints.
If you searched why AMAT stock is down today, or why AMAT stock dropped a lot today, the timeline below is the short version. For every update as it lands, our AMAT stock news hub carries the running coverage.
Table 1: AMAT Stock Decline Timeline, 13 to 23 October 2026
| Date | What Happened | AMAT Stock Move |
| 13 October | Investor day sets 2030 goals but no WFE spending forecast | Fell about 6.70% 3 |
| 15 October | Losing streak reaches eight sessions | Down about 21% since the 5 October close 15 |
| 16 October | Needham cuts its price target to $580 from $740 | Analyst caution over valuation 11 |
| 21 October | Lam Research reports a record quarter and flags supply limits | Closed at $408.94 11 |
| 22 October | Philadelphia Semiconductor Index falls 6.72% | Fell 6.70% in morning trade to $381.53 7,11 |
| 23 October | Week ends with the stock near its low | Closed at $377.24 3 |
Table 1 draws on the sources cited in each row and the TradingView AMAT 1H chart, accessed on 26 October 2026.
The timeline tells you what happened. The chart tells you how it happened, and the how matters for anyone holding positions overnight.
What the AMAT Stock Chart Shows
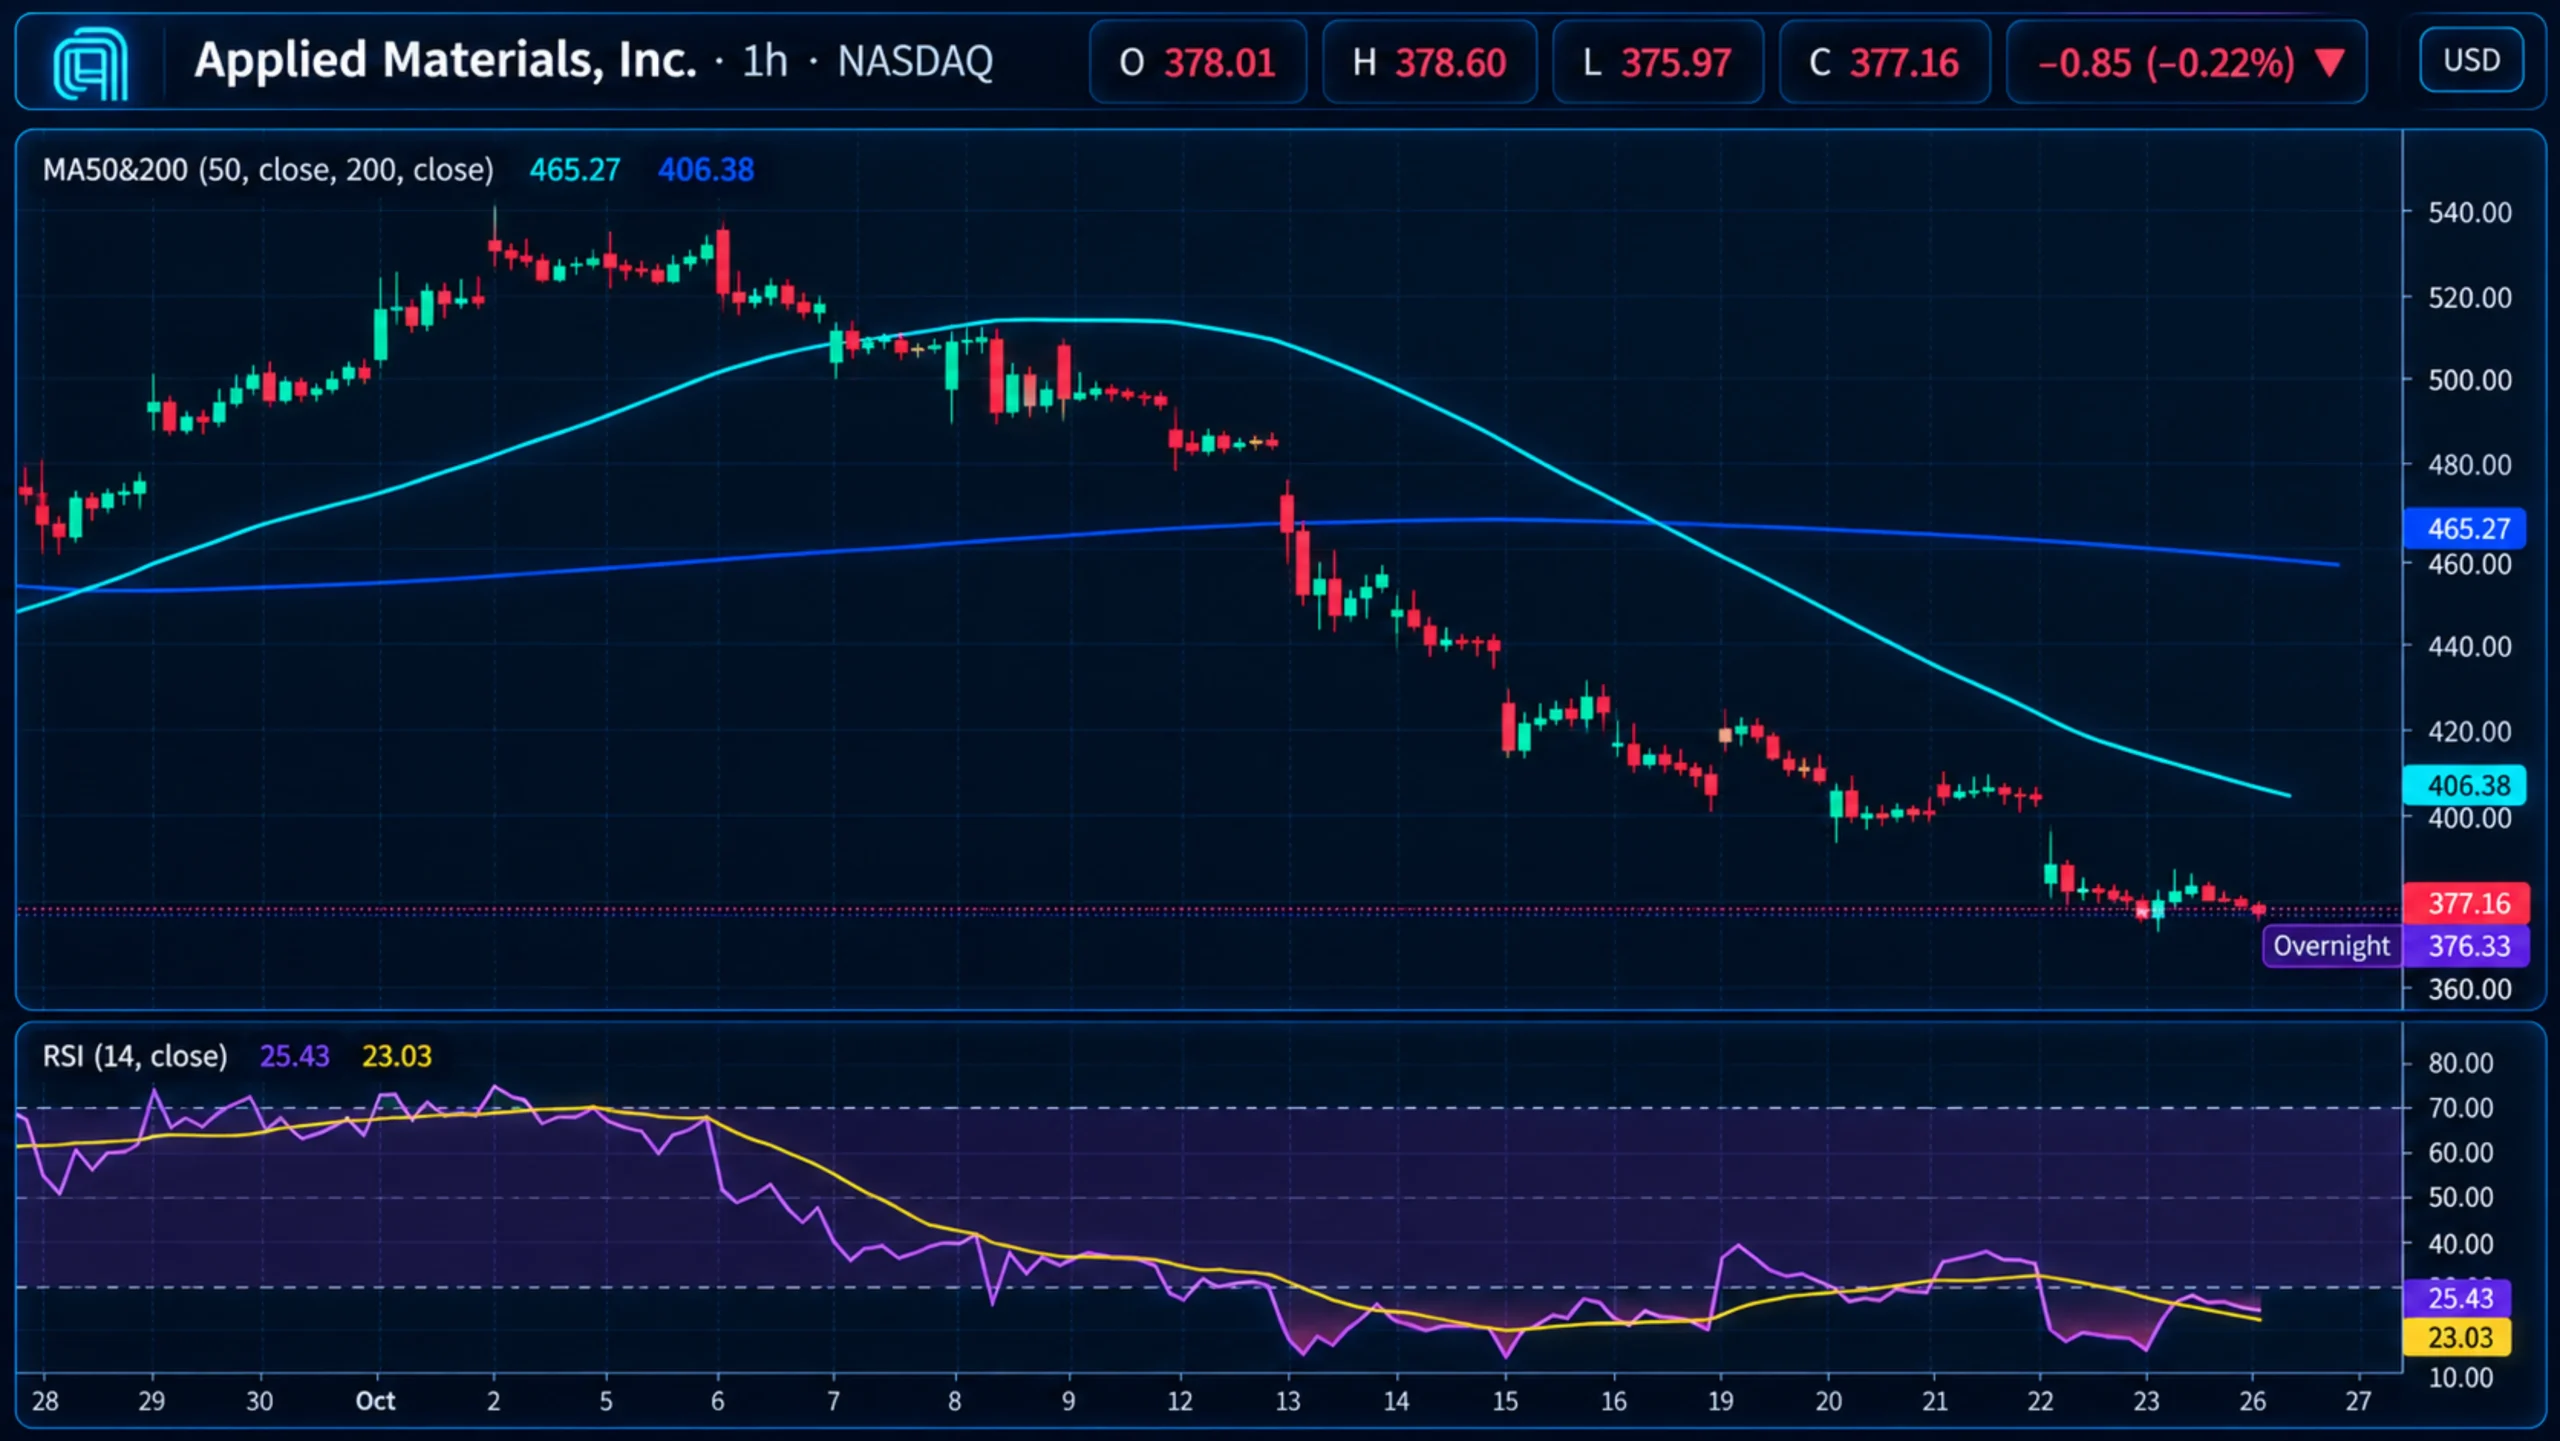
The hourly chart reads like a staircase, not a slope. Applied Materials held a band of roughly $530 to $547 from 2 to 6 October, drifted towards $500 by 12 October, then stepped down in gaps: about $498 to $485 at the 13 October open, about $447 to $432 on 15 October, and about $408 to $390 on 22 October.
On the same chart, the hourly 50-period moving average (MA) crossed below the hourly 200-period MA around 16 October. As of the 26 October cut-off, the 50-period MA sat at $406.38 and the 200-period MA at $465.27, with price below both. Our technical analysis archive covers how these averages are read.
The Relative Strength Index (RSI) read 25.43 on the TradingView setup used for this analysis, under the 30 line usually labelled oversold. It reached the mid-teens on 13 and 15 October and the high teens on 22 and 23 October. A fair reminder: oversold describes the last 14 hourly bars, not the next 14.
In the final session before the cut-off, price held between about $373 and $384 while the RSI lifted to 25.43. The chart shows when the damage happened. It doesn’t show why the first gap opened on a day the company was presenting its growth plans.
An Investor Day Without a Forecast
“We’re not going to give a specific WFE forecast today,” chief executive Gary Dickerson told the SEMICON West investor breakfast on 13 October. 11 Instead, Applied Materials set 2030 goals: a non-GAAP gross margin of about 54%, a non-GAAP operating margin of about 40%, and a gain of more than two percentage points of WFE share from 2025. 1
Dickerson pointed to factory space, supply chains, and the financing of energy infrastructure as variables that could shape the near-term path. 2 The session read as a mismatch of calendars: a spending number for next year was missing, margin goals for 2030 were not.
The stock fell about 6.70% that day, its sixth straight losing session, 4 and more than Lam Research, KLA (NASDAQ: KLAC), and ASML (NASDAQ: ASML), which lost roughly 2.60% to 3.50%. 3 This one was mostly an equipment story: the broader iShares Semiconductor ETF slipped only about 1% in afternoon trading. 16 Memory names had a rough day too, after a report on China’s ChangXin Memory; 15 our Micron news page tracks that side of the trade.
There’s also a credibility wrinkle. According to 24/7 Wall St, Applied Materials lost 2.1 percentage points of global WFE share in 2025, 10 so the 2030 goal would roughly win back what was given up last year. That explains the first gap. It doesn’t explain why the decline kept going after the presentation ended.
Lam Research’s Supply Warning Hit the Whole Group
On 21 October, Lam Research reported record September-quarter revenue of $8.22 billion and guided December-quarter revenue to $8.6 billion, plus or minus $400 million. 6 Chief financial officer Doug Bettinger said the guide “would have been a bit higher” without near-term supply chain constraints. 5 A record quarter met six cautious words, and the six words set the tone.
The call also flagged cleanroom space and component limits running into 2027, 5 and Lam expects China’s share of its revenue to be meaningfully lower in the December quarter. 6 The next day, the Philadelphia Semiconductor Index (SOX) fell 6.72% 7 on a risk-off session for technology shares across the Nasdaq. 11
Applied Materials fell 6.70% in morning trade to $381.53, from a prior close of $408.94. 11 The same session carried comments from Nvidia (NASDAQ: NVDA) chief executive Jensen Huang that demand for AI cloud capacity was strong but working capital was scarce; 7 NVIDIA news has the detail. Read together, the two weeks look like a demand scare. The filings say something narrower.
Demand Held, Timing Did Not
The obvious explanation is that AI chip demand cracked. The documents don’t show that. Applied Materials guided fiscal Q4 revenue to $10.25 billion, plus or minus $500 million, after a record $9.12 billion in the third quarter. 8 Lam described AI demand as strong and tied its softer guide to parts supply and a pullback from domestic Chinese customers. 6
Here’s the twist. What both companies named were physical limits: cleanroom space, components, and how quickly tools can ship. Dickerson listed similar variables on 13 October, eight days before Lam’s call. 2,5 On that reading, the market appears to have priced the speed limit rather than the destination, meaning how fast spending turns into revenue rather than whether it arrives.
Timing isn’t the whole story, though. Needham’s cut was framed around valuation after the year’s run, 11 and the stock was still up about 80% year to date on 13 October. 16 A stock carrying a gain that size meeting an unanswered question is a reasonable second explanation, and the two aren’t mutually exclusive.
Applied Materials and Lam Research both described strong demand in October. The 31% decline lined up with the limits they named more closely than with any change in demand.
Timing questions tend to get answered on fixed dates. The next one is the fiscal Q4 report, where consensus sat near $10.30 billion of revenue and adjusted earnings per share (EPS) of $4.06, just above the company’s own midpoint. 3,8 So what do the analysts who model this for a living make of it?
AMAT Stock Price Target: What Analysts Are Saying

Analysts read the same investor day in very different ways. Cantor Fitzgerald’s C.J. Muse said the company offered a “bullish outlook” on WFE growth led by AI. 12 Evercore ISI, writing on the morning of the event, focused on the EPIC Center research site unveiled the previous day: 16 “We believe EPIC could be a strategic differentiator for AMAT”. 13
On the supply worry, Bank of America called Lam’s problem “transitory” and likely tied to gas delivery subsystems. 14 Not everyone moved in the same direction, though. Needham cut its price target to $580 from $740 on 16 October, while Morgan Stanley kept a $563 target on 21 October. 11
Table 2: Reported AMAT Stock Price Targets, October 2026
| Firm | Date | Reported Price Target | Change |
| Cantor Fitzgerald | 13 October | $850 | Reported after the investor day 4 |
| Needham | 16 October | $580 | Cut from $740 11 |
| Morgan Stanley | 21 October | $563 | Maintained 11 |
Table 2 lists third-party views as reported by the cited outlets, accessed on 26 October 2026. They are not Vantage forecasts.
A spread that wide among just three firms suggests they are working from different assumptions, and 2027 spending is the number the company held back. That brings us to what the chart and the calendar offer in the meantime.
AMAT Stock Watch: Levels and Dates
These are the reference points visible on the uploaded chart. They’re observations, not signals.
Table 3: AMAT Reference Levels as of 01:43 (UTC) / 09:43 (GMT+8), 26 October 2026
| Reference | Level | Chart Context |
| Hourly 200-Period MA | $465.27 | Sloping lower since the 16 October cross |
| 21 October Session Range | About $404 to $414 | Last range before the 22 October gap |
| Hourly 50-Period MA | $406.38 | Above price through 22 and 23 October |
| 20 October Low | About $400 | Intraday low on the hourly chart |
| 23 October Close | $377.24 | Official close; 3 final hourly bar printed $377.16 |
| 23 October Low | About $373 | Lowest print on the chart |
Table 3 levels are read from the TradingView AMAT 1H chart (Nasdaq data) used for this analysis, accessed on 26 October 2026. Indicative only.
What to Watch
- Applied Materials Fiscal Q4 Results, On or Around 12 November 2026: The company guided revenue of $10.25 billion, plus or minus $500 million, and non-GAAP EPS of $4.02, plus or minus $0.20. 8 Whether management offers a calendar 2027 spending view is the question the investor day left open. The date is based on secondary reporting until the company confirms it. 9 Results coverage runs in earnings news today.
- China Revenue Mix, Same Release: China made up about 30% of Applied Materials’ fiscal 2025 revenue, 3 and Lam has signalled a lower China share for its December quarter. 6
- Chip Index Moves, Daily: The SOX fell 6.72% on 22 October, 7 and AMAT fell 6.70% in morning trade that day. 11 On 13 October, by contrast, the drop was concentrated in equipment names. 16
Applied Materials Stock FAQ
What Is the Stock Symbol for Applied Materials?
The stock symbol AMAT trades on the Nasdaq, written as NASDAQ: AMAT. Applied Materials Inc stock is a member of the Philadelphia Semiconductor Index, so sector-wide moves such as 22 October’s tend to show up on its chart.
Is AMAT a Good Stock to Buy?
Vantage doesn’t make stock recommendations. The record shows Q3 revenue of $9.12 billion, a Q4 guide of $10.25 billion, and a share price about 31% below its 2 October high; 8 how those weigh depends on each person’s objectives and risk tolerance.
What Is the AMAT Stock Forecast?
Vantage doesn’t publish an AMAT stock price forecast. For reference, the company guided fiscal Q4 revenue of $10.25 billion, 8 and the three analyst price targets cited in this article for Applied Materials stock ranged from $563 to $850 in October. 4,11 Any Applied Materials stock forecast rests on 2027 spending, which the company has not quantified.
What Is the AMAT Stock Post Sell-Off Outlook?
The read changes on evidence: a calendar 2027 spending view at the 12 November results, signs that the supply limits Lam described are easing, and how price behaves around the hourly 50-period MA at $406.38 as of the 26 October cut-off.
Overnight Gaps and Leverage on AMAT
Back to the opening puzzle. Apart from a lower China share at Lam, Applied Materials and its peers didn’t report weaker AI-related demand in October; they reported limits on how fast it ships, and the stock fell about 31% while valuation questions hung over a big year. The 12 November report is the next fixed date on which that timing question gets a primary-source answer.
The 13, 15, and 22 October declines opened as gaps, and Applied Materials reports after the US close, outside Vantage’s listed AMAT trading hours, currently 21:30 to 04:00 (GMT+8) and subject to the US daylight saving change on 1 November. A Stop Loss can limit a loss to a planned size during the session, but a gap at the open can fill the order at a worse price than the level set.
For UK retail clients, leverage on share CFDs such as AMAT is capped at 1:5, and leverage magnifies losses as well as gains. At that ratio, margin is 20% of position value, so a 6.70% one-day move like 13 October’s equals about a third of the margin posted. Position size relative to account equity decides how much of one session reaches the account balance.
RISK WARNING: CFDs are complex financial instruments and carry a high risk of losing money rapidly due to leverage. You should ensure you fully understand the risks involved and carefully consider whether you can afford to take the high risk of losing your money before trading.
Disclaimer: The information is provided for educational purposes only and doesn’t take into account your personal objectives, financial circumstances, or needs. It does not constitute investment advice. We encourage you to seek independent advice if necessary. The information has not been prepared in accordance with legal requirements designed to promote the independence of investment research. No representation or warranty is given as to the accuracy or completeness of any information contained within. This material may contain historical or past performance figures and should not be relied on. Furthermore estimates, forward-looking statements, and forecasts cannot be guaranteed. The information on this site and the products and services offered are not intended for distribution to any person in any country or jurisdiction where such distribution or use would be contrary to local law or regulation.
References
[1] “Applied Materials Set to Outperform as AI Drives Sustained Demand for Wafer Fab Equipment – GlobeNewswire” https://www.globenewswire.com/news-release/2026/10/13/3380021/0/en/applied-materials-set-to-outperform-as-ai-drives-sustained-demand-for-wafer-fab-equipment.html Accessed on 26 October 2026.
[2] “Applied Materials Shares Slide as Chip Equipment Outlook Remains Uncertain – Investing.com” https://www.investing.com/news/stock-market-news/applied-materials-shares-slide-as-chip-equipment-outlook-remains-uncertain-4947269 Accessed on 26 October 2026.
[3] “Applied Materials Stock Falls 24% Since October 12 After Investor Day Offers No Spending Forecast – Dealroom” https://app.dealroom.co/news/feed/applied-materials-stock-falls-24-since-october-12-after-investor-day-offers-no-spending-forecast Accessed on 26 October 2026.
[4] “Applied Materials Stock Sinks for 6th Day, but Cantor Sees 85% Upside – Benzinga” https://www.benzinga.com/analyst-stock-ratings/analyst-color/26/10/62341492/applied-materials-stock-sinks-sixth-day-cantor-850-target Accessed on 26 October 2026.
[5] “Lam Research (LRCX) Q1 2027 Earnings Call Transcript – The Motley Fool” https://www.fool.com/earnings/call-transcripts/2026/10/21/lam-research-lrcx-q1-2027-earnings-call-transcript/ Accessed on 26 October 2026.
[6] “Lam Research Stock Sinks 7% on a Guide That Beat: Would Have Been a Bit Higher – Yahoo Finance” https://finance.yahoo.com/markets/stocks/articles/lam-research-stock-sinks-7-065348053.html Accessed on 26 October 2026.
[7] “Chip Stocks Lose $200 Billion as Equipment Maker’s Warning Counters NVIDIA’s AI Optimism – Tech Times” https://www.techtimes.com/articles/329406/20261023/chip-stocks-lose-200-billion-equipment-makers-warning-counters-nvidias-ai-optimism.htm Accessed on 26 October 2026.
[8] “Applied Materials Announces Third Quarter 2026 Results – Applied Materials” https://ir.appliedmaterials.com/news-releases/news-release-details/applied-materials-announces-third-quarter-2026-results Accessed on 26 October 2026.
[9] “Has Buying Applied Materials Stock’s Dips Paid Off? – Yahoo Finance” https://finance.yahoo.com/markets/stocks/articles/buying-applied-materials-stocks-dips-230046351.html Accessed on 26 October 2026.
[10] “Applied Materials Faces Market Share Test as Global Chip Equipment Spending Surges 23% – 24/7 Wall St.” https://247wallst.com/investing/2026/10/11/applied-materials-faces-market-share-test-as-global-chip-equipment-spending-surges-23/ Accessed on 26 October 2026.
[11] “Why Is Applied Materials Stock Sliding Today? – Investing.com” https://ng.investing.com/news/stock-market-news/why-is-applied-materials-stock-sliding-today-93CH-2751825 Accessed on 26 October 2026.
[12] “Applied Materials, Inc. (AMAT) Stock Price and Overview – StockAnalysis” https://stockanalysis.com/stocks/amat/ Accessed on 26 October 2026.
[13] “Applied Materials (AMAT) Latest Headlines – StreetInsider” https://www.streetinsider.com/dr/quote.php?q=amat Accessed on 26 October 2026.
[14] “Lam Research Earnings Analysis: Questions Answered and Next Catalysts – Investing.com” https://www.investing.com/news/stock-market-news/lam-research-earnings-analysis-questions-answered-and-next-catalysts-93CH-4967037 Accessed on 26 October 2026.
[15] “Applied Materials Stock Fell 21% in 8 Straight Sessions. Here’s What Its 2030 Targets Mean for Shares – Yahoo Finance” https://finance.yahoo.com/markets/stocks/articles/applied-materials-stock-fell-21-193922310.html Accessed on 26 October 2026.
[16] “Semiconductor Equipment Stocks Slide as Investors Take Profits on a Huge Year – 24/7 Wall St.” https://247wallst.com/investing/2026/10/13/semiconductor-equipment-stocks-slide-as-investors-take-profits-on-a-huge-year-applied-materials-sinks-7-lam-research-and-kla-drop-4/ Accessed on 26 October 2026.
Key Points In This Article

Latest Financial Market Analysis


Market Analysis Tags
- # USD News
- # USDCAD News
- # USDJPY News
- # USDX News
- # Forex News
- # Forex News Today
- # GBPUSD News
- # EURUSD News
- # Currency Trading News
- # AUDUSD news
Related Articles
- Why EUR/USD Fell as French Bond Stress Outweighed ECB Rate Hikes – EURUSD Analysis
- Why the US Dollar Index Slipped as Fed Hike Bets Moved to December – USDX Analysis
- Gold Price Falls 2% as Yields Drop: What It Means for XAUUSD Traders
- Why Euro Dollar Held Steady as French Yields Topped 5% – EURUSD Analysis
- Why Crude Oil Prices Rose as Iran Strike Reports Lifted Brent: UKOUSD and USOUSD Analysis
- Why Silver Fell as Oil Lifted Fed Hike Bets – XAGUSD Analysis
- Micron Stock Steadies After China-Led Memory Slide: What It Means for MU Traders
- Bank of Canada Interest Rate Announcement: 2.25% vs 3.1% CPI