


Vantage uses cookies that are essential for our website to work. We also use optional analytical cookies to help us to improve our website and the services, content and ads we provide to you which you can accept or reject here. Please see our Cookies Policy for more information on how we use cookies.
A Lesson in Support and Resistance in the Forex Market
In the Forex Market, a currency pair, or any other trading instrument for that matter, is always in one of two phases; a trending phase or a consolidation period. Throughout strong trending periods, prices tend to move uninterrupted from one level to another, whereas during consolidation periods prices seem to move in both directions without producing any meaningful change in price. It’s during this consolidation period that support and resistance areas are formed. The support area represents a level of demand, and a resistance area represents a level of supply.
A resistance level is an area where an advance in price meets resistance in the form of strong selling, preventing it from going any higher. Conversely, a level of support is an area where price is prevented from falling further due to strong buying.
Now, the longer the time in which a forex instrument is spent trading in this range (between support & resistance areas), the more significant those areas become for future technical analysis setups. Personally, I tend to prefer support and resistance levels drawn on the weekly timeframe as it’s clearer to define significant areas.
A rectangle chart pattern is a great example of how a trader can apply technical analysis to areas of support and resistance. The higher and lower areas of this pattern are quite clear support and resistance levels. As always though, it’s not a valid breakout trade until it breaks out of the range in either direction. When a breakout does occur, these levels change their role. For example, if price breaks upwards of the range the resistance level now becomes a level of support, and vice-versa for a downward break.
In this example we see price consolidating in between the top and bottom boundaries. Once each area has at least two tests of support or resistance it becomes a valid level.
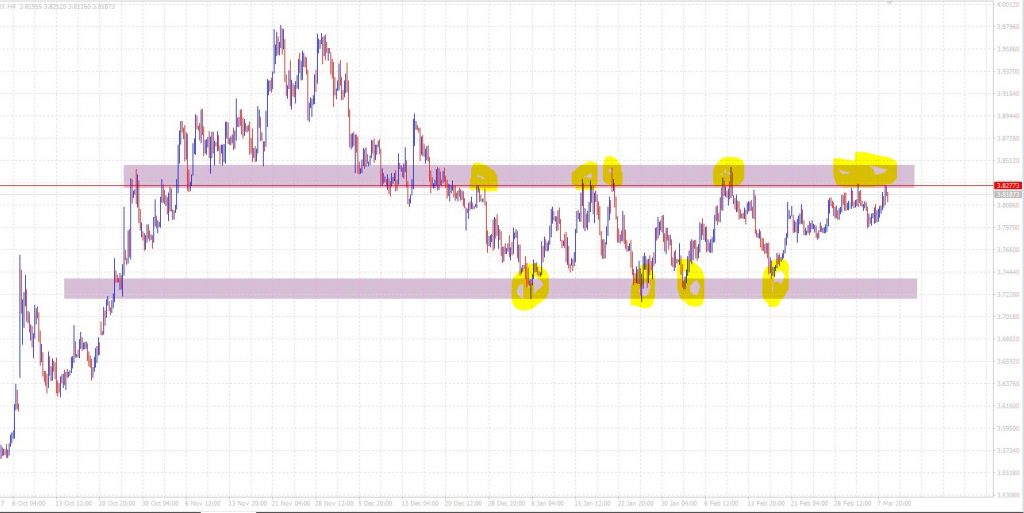
USDTRY
In the above example, a trader has a couple of trading possibilities. The first, could be trading the range, ie. Shorting resistance / Buying Support. The second would be to trade a breakout of the range, ie. buying a selling a breakout of the horizontal boundaries.
As this is a current USDTRY H4 chart, it could be worthy of a watch for forex trading possibilities.
I hope you find this article informative and a useful addition to your trading strategy.