Vantage uses cookies that are essential for our website to work. We also use optional analytical cookies to help us to improve our website and the services, content and ads we provide to you which you can accept or reject here. Please see our Cookies Policy for more information on how we use cookies.
CFDs and Spread Bets are complex instruments and come with a high risk of losing money rapidly due to leverage. 73.5% of retail investor accounts lose money when trading CFDs and Spread Bets with this provider. You should consider whether you understand how CFDs and Spread Bets work and whether you can afford to take the high risk of losing your money. Please seek independent advice if necessary.
The Basics of Support & Resistance
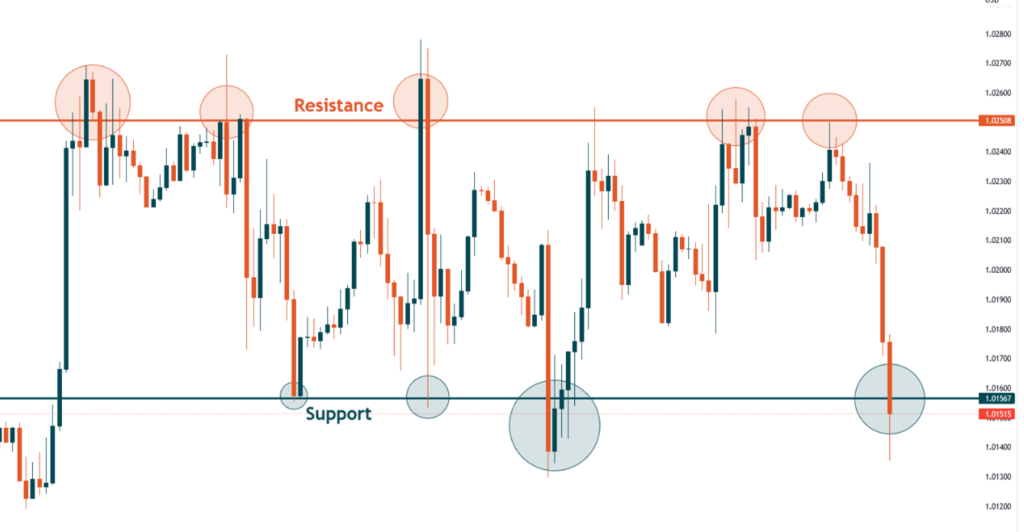
Support and resistance are fundamental concepts of technical analysis in forex trading. The core idea is to identify price areas where market might reverse. Individuals who just began their trading journey would most likely base their trading decisions on these horizontal lines on the chart.
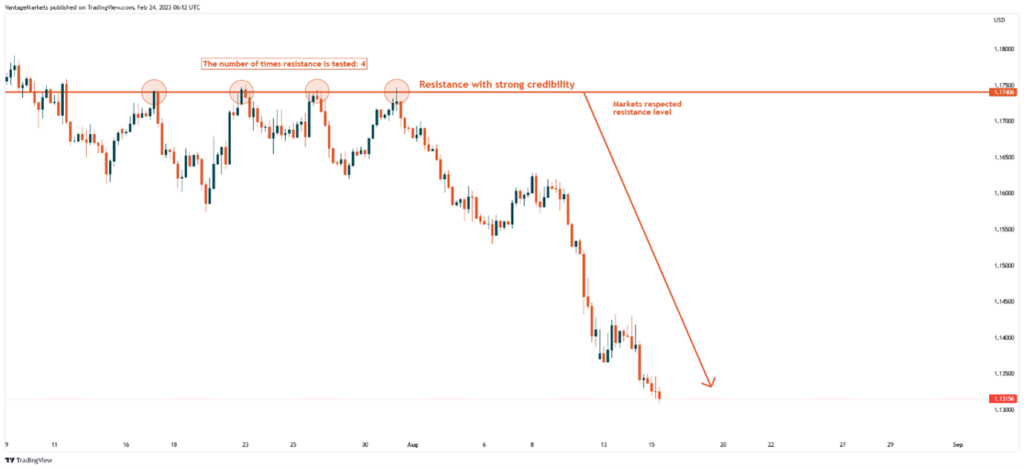
As we dive into the topic of support and resistance, here’s a look at how it might look like when featured in a chart.
What is Support?
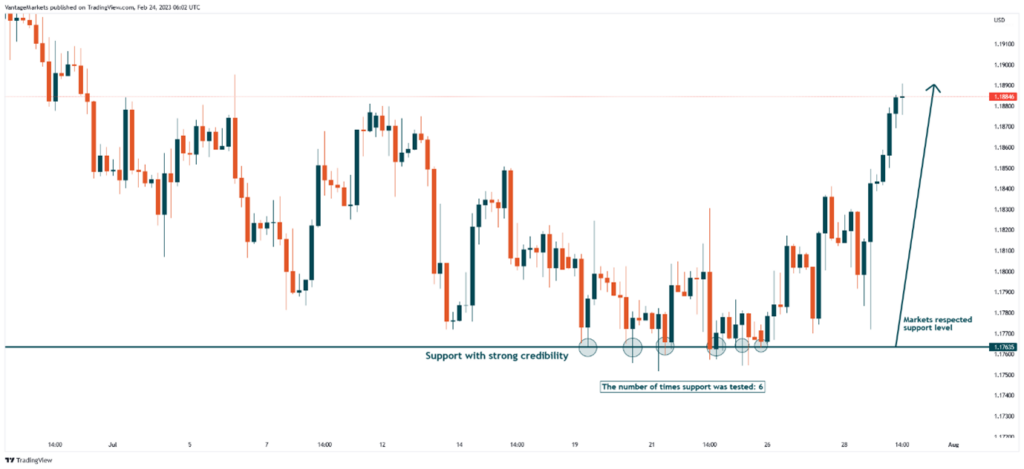
Support is a price level where the market tends to reverse from a bearish move. The more times a support is verified, the more credibility it has.
How Do You Determine A Support Level?
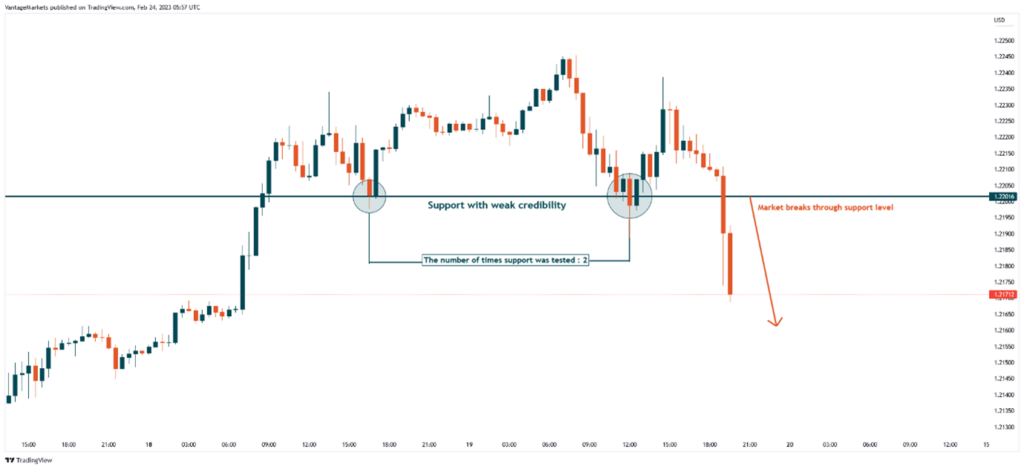
A support level can be easily recognised as a price point that markets cannot seem to break lower. Whenever a market approaches a support level, prices would most likely reverse bullish. The more times a support level is tested, the more credibility it has.
For example, EURUSD is on a bearish trend, but markets can’t seem to break below the price point of 1.20000, it can be said that there is a support area near the price point of 1.20000.
What is Resistance?
Resistance is the opposite of support. It is a price level where the market tends to reverse from a bullish move. The more times a resistance is verified, the more credibility it has.
How Do You Determine A Resistance Level?
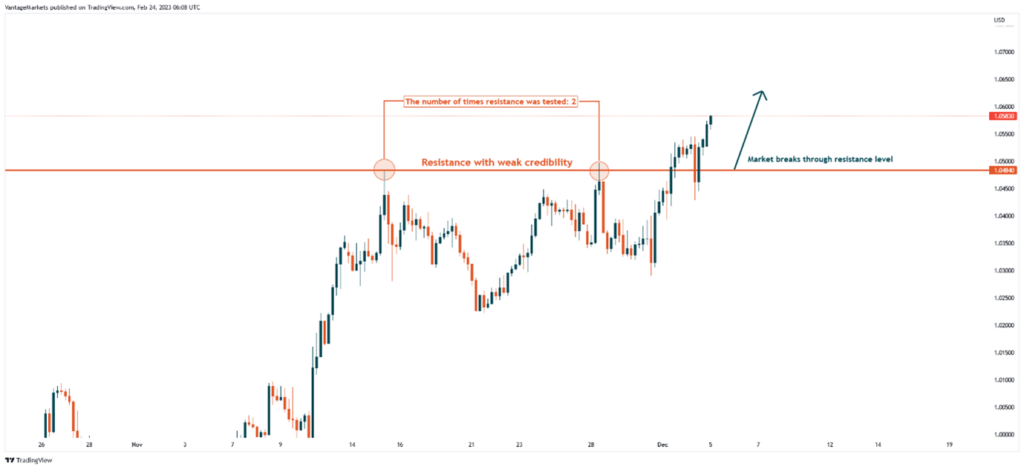
A resistance level can be easily recognised as a price point that markets cannot seem to break higher. Whenever a market approaches a resistance level, prices would most likely reverse bearish. The more times a resistance level is tested, the more credibility it has.
For example, GBPUSD is on a bullish trend, but markets are unable to break above the price point of 1.2300, it can be said that there is area of resistance near the price point of 1.2300.
How to Trade Support & Resistance?
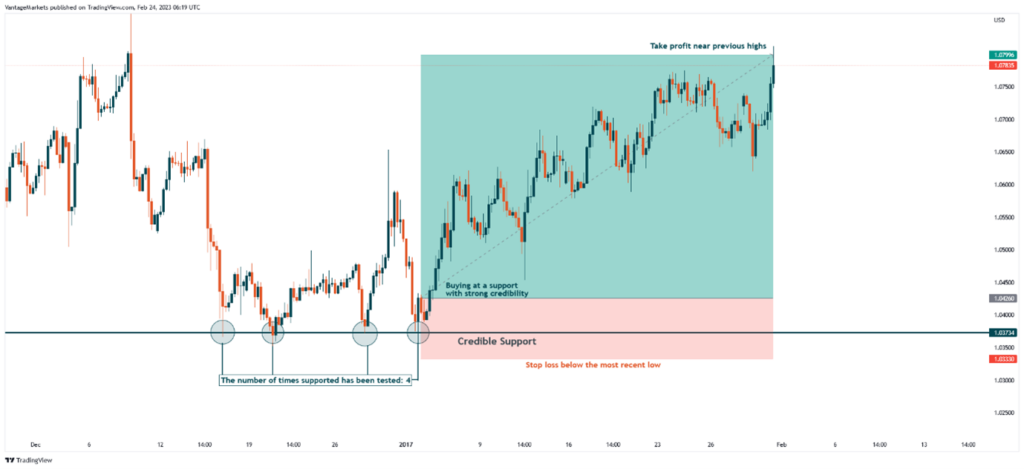
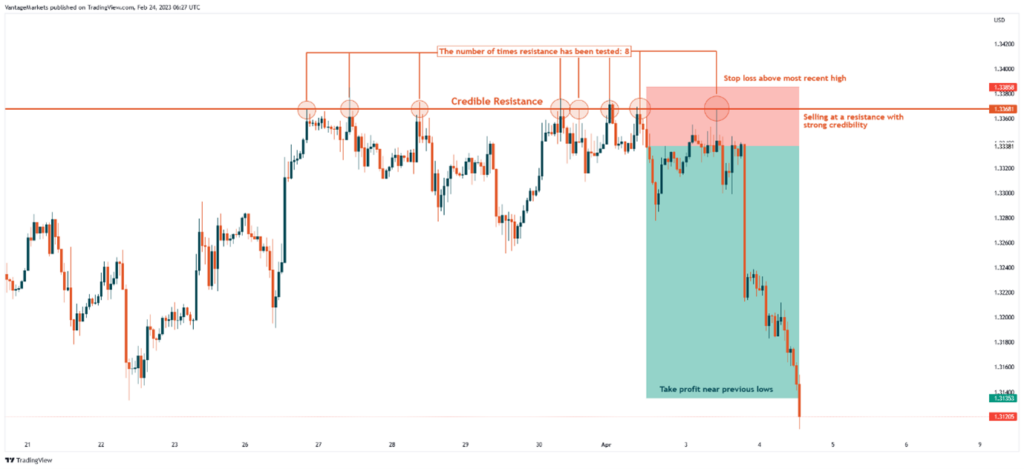
The rule of thumb is to “buy at support, sell at resistance.” This means that in a bullish market, when markets reach a support level with credibility, a buy trade may be executed. While the reverse is also true, when markets reach a credible resistance level, a sell trade may be executed.
Traders can use support and resistance levels to determine potential entry and exit points for their trades. Figure 6 shows an example of buying at support in EURUSD, while Figure 7 shows an example of selling at resistance in EURUSD.
A Break in Support or Resistance
Support and resistance areas are not always observed by the market. There will be occasions when even with a presumably credible support, markets could go further bearish, leading to a break in support level.
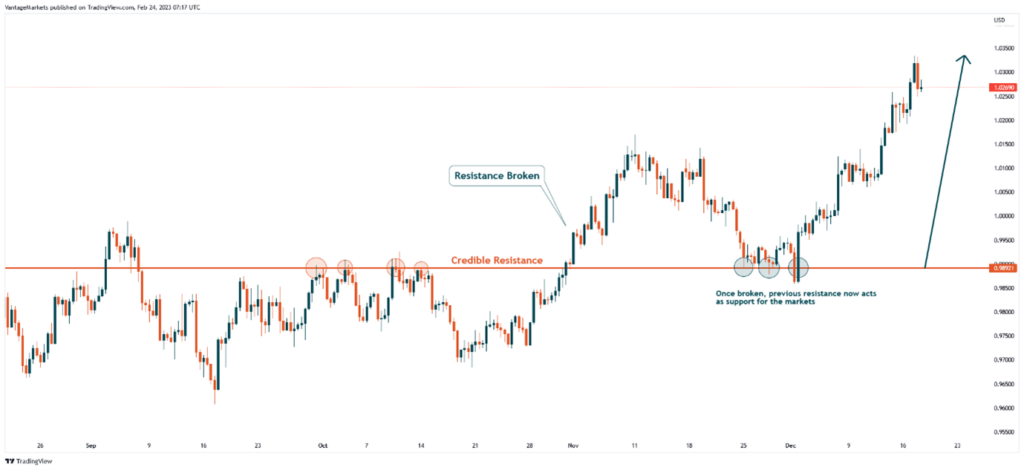
However, even with credible support or resistance levels being broken, other trade opportunities may occur. When a support level is broken, the same support can be used as a resistance level, and if a resistance level is broken, the same resistance level then becomes a support level.
Figures 8 demonstrates how a broken support level turns into a resistance level.
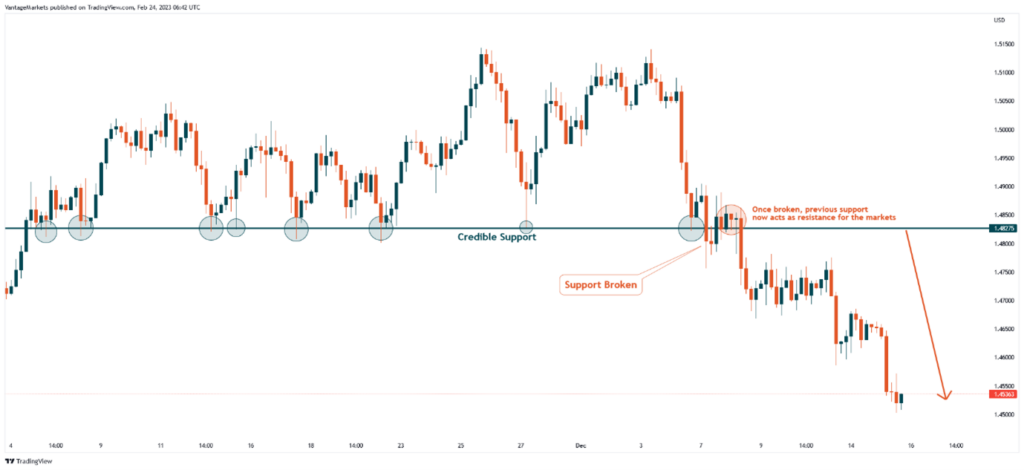
Figure 9 demonstrates how a broken resistance level turns into a support level.
Dynamic Support and Resistance
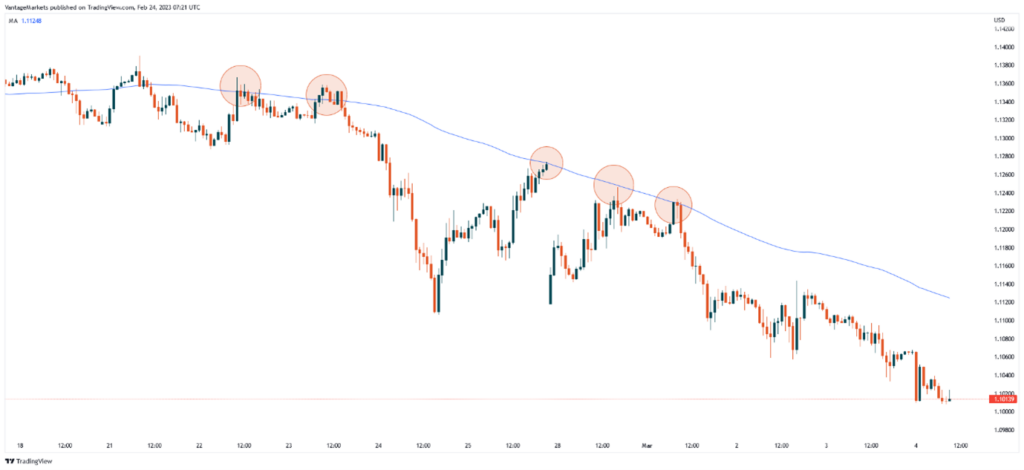
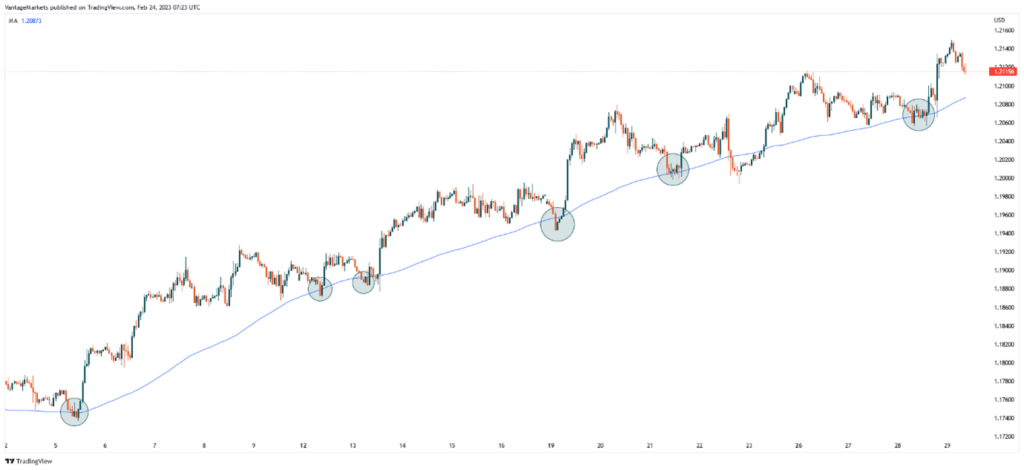
Dynamic support and resistance come in the form of adaptive moving averages that show areas of rejection in the financial markets.
Figure 10 shows an example of dynamic resistance using a 100-period moving average in EURUSD. When the market approaches the moving average, it tends to repel from it, serving the same purpose as a horizontal resistance level. Figure 11 demonstrates the same concept but as dynamic support.
Conclusion
In conclusion, support and resistance are key concepts in technical analysis that traders can use as a reference to identify potential price reversals in financial markets.
It’s important to note that these levels are only indicative of a possible reversal of prices, and they by no means should be regarded as constantly reliable. To improve its success rate, traders should refer to more historical prices, continuously monitor price movements and adjust their trading strategies accordingly.
Taking support and resistance trading to the next level? Check out our Complete Guide to Supply and Demand article to learn more.
Disclaimer
Vantage does not represent or warrant that the material provided here is accurate, current, or complete, and therefore should not be relied upon as such. The information provided here, whether from a third party or not, is not to be considered as a recommendation; or an offer to buy or sell; or the solicitation of an offer to buy or sell any financial instruments; or to participate in any specific trading strategy. Any research provided does not have regard to the specific investment objectives, financial situation and needs of any specific person who may receive it. We advise any readers of this content to seek their own advice. Past performance is not an indication of future results whereas reference to examples and/or charts is solely made for illustration and/or educational purposes. Without the approval of Vantage, reproduction or redistribution of this information is not permitted.
Latest Releases
-
How to Buy Bonds in the UK
Bonds are a popular debt instrument that can offer capital gains, steady income or potential to profit from speculation. Here’s …
-
Forex Broker UK – All You Need to Know
Forex brokers offer retail investors in the U.K. speed, convenience and cost savings for global forex trades. Here’s what you …
-
Top 5 UK Stocks to Buy in 2023
From aviation to banking and property development, we picked five best U.K. stocks listed on the London Stock Exchange to …
-
Apr 08,2024
AI and Reactivity – How AI Can Enhance Trading News Reaction Times
Explore how AI transforms trading news response times, ensures swift reactions, and mitigates risks in the fast-paced financial markets.
-
Apr 08,2024
The Psychology of Market Reaction: Understanding Investor Behaviour
Explore the psychological dynamics influencing investor behaviour and market reactions, unveiling the role of cognitive biases and emotions in financial decision-making.
-
Apr 02,2024
Understanding Central Bank Policies: How They Influence the Economy and Market
Discover how central banks influence global economies through policy while examining their evolving strategies in line with technological advances.


