

 Login
Login


DAILY TRADING: Coca-Cola (KO) Stock Price Today, Cooling From a $90.90 High

Vantage Editorial Team >
Vantage Editorial Team >
Vantage is a global, multi-asset broker with a team of in-house writers and market analysts who produce educational and insightful trading content for traders of all levels.
 Updated Fri, 2026 August 14 08:31

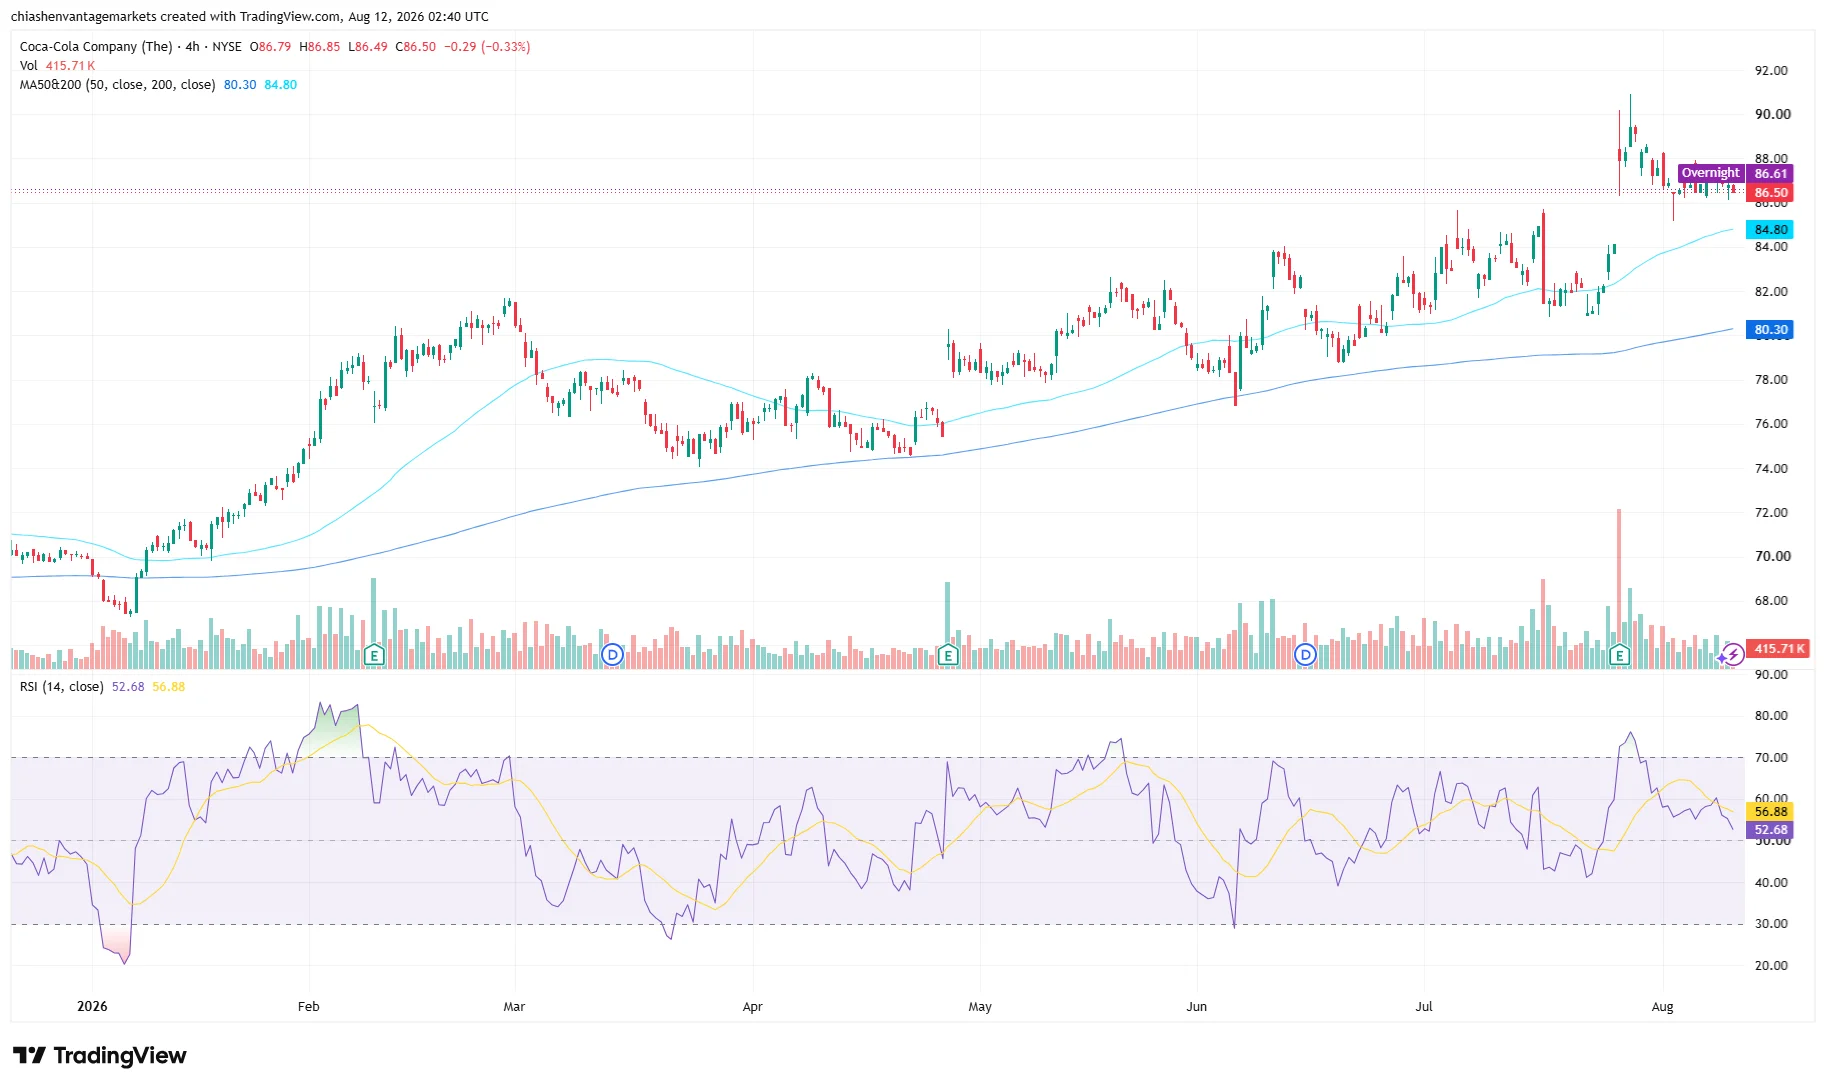
Here is the KO stock quote as it actually stands right now: Coca-Cola, ticker KO on the NYSE, is trading at $86.50 as of 10:40 (GMT+8) on 12 August 2026, per the Vantage KO CFD 4-hour chart, down 0.33% on the session. That is roughly 4.8% off the $90.90 high the stock price of KO touched days after its Q2 report.
If you have been watching KO stock today and wondering whether the pullback is the start of something ugly, I will save you the suspense: I do not think so, and the chart makes a fairly good case for why. Coca-Cola just delivered a strong beat-and-raise quarter, several covering analysts subsequently raised their price objectives, and now the stock is doing the thing stocks do after a sharp move: taking a breath. Let us walk through the KO stock analysis properly, chart first.
The Technical Picture: KO Stock Price Analysis
On the 4-hour chart, the 50-period moving average sits at 84.80 and the 200-period moving average sits at 80.30, per the TradingView setup used for this analysis. The current KO stock price of 86.50 is holding above both, roughly two percent clear of the 50-period line and close to eight percent above the 200-period line.
KO spent January through April 2026 rebuilding off a low near the 65 handle, then spent May and June consolidating in the low 80s, the kind of sideways grind that makes a stock look boring right up until it is not. KO broke higher from its low-$80s consolidation in late July, accelerating after the 28 July earnings release and reaching an intraday high of $90.90 on 29 July, on volume clearly above the recent average, visible as the tall bar on the volume pane.
Since that spike, KO stock has faded back to 86.50. The RSI (14), per the TradingView setup used for this analysis, currently reads 52.68, sitting just under its own moving-average overlay at 56.88 after spiking well into overbought territory earlier in August. That, by itself, does not constitute a breakdown signal. It is more consistent with momentum cooling after the sharp move higher, although continued weakness in RSI would warrant closer attention.
KO’s technical structure remains constructive, but momentum has cooled. Price is still above the rising 50-period MA at 84.80 and 200-period MA at 80.30, while RSI has fallen to 52.68 from its earlier overbought reading. That combination is consistent with consolidation within an intact uptrend rather than a confirmed reversal. A sustained break below the 50-period MA would provide a more meaningful warning that the post-earnings trend is losing momentum.
The Fundamental Backdrop: Why Coca-Cola Stock Jumped in the First Place
Coca-Cola reported second-quarter 2026 results on 28 July, and the numbers did most of the talking. Comparable earnings per share came in at $0.97, ahead of the $0.93 consensus1. Net revenue rose 7% year on year to $13.38 billion, and organic revenue grew 6%. Global unit case volume increased 5%, helped by FIFA World Cup marketing activation: Trademark Coca-Cola volume rose 5% and Coca-Cola Zero Sugar rose 16%2. Comparable operating margin expanded about 90 basis points to 35.6%2, and comparable gross margin expanded about 120 basis points on the earnings call6. For a company this size, that is not a rounding error, it is a genuinely strong quarter.
Alongside the results, the company raised its full-year 2026 guidance: organic revenue growth to approximately 5%, at the top of its prior 4% to 5% range, and comparable earnings-per-share growth to 9% to 10%, up from 8% to 9%2. Free cash flow guidance was lifted to approximately $12.4 billion2. Separately, Coca-Cola’s pending sale of 41.52% of its 66.52% stake in Coca-Cola Beverages Africa (CCBA) to Coca-Cola HBC, a transaction valuing 100% of CCBA at $3.4 billion, is now assumed to close toward the end of the third quarter or during the fourth quarter of 2026, subject to regulatory approvals3.
Analyst reaction was consistent in direction, if not magnitude. RBC Capital raised its 12-month price objective on KO to $96 from $87 while keeping a constructive stance. Argus analyst Taylor Conrad raised his objective to $97 from $91. Barclays analyst Lauren Lieberman raised hers to $93 from $91, describing the quarter as clean. TD Cowen raised its objective to $100 from $904. Some analyst compilations put the average 12-month target in the mid-$90s, although estimates vary by provider and analyst universe5. The combination of an earnings beat, higher full-year guidance and subsequent objective increases provided a clear fundamental catalyst for the post-earnings move.
Where They Meet, and Where They Don’t
The fundamentals provide a clear catalyst for the spike. A genuine earnings and guidance beat, followed by a wave of analyst price-objective increases, is exactly the kind of catalyst that produces a sharp, high-volume move on a chart. What the fundamentals alone do not fully explain is the shape of the pullback: RSI cooling back under its own moving-average overlay while price holds its ground above both the 50-period and 200-period lines.
I read that combination as the market digesting the move rather than rejecting it. Some of this re-rating was arguably already in motion before 28 July: Coca-Cola’s first-quarter results and guidance update in April established a similar pattern, and the second-quarter print largely confirmed rather than surprised the direction of travel. That reads less like a one-off earnings pop and more like a reassessment of Coca-Cola’s earnings-growth trajectory.
Where I would want confirmation before treating the higher range as settled: continued volume on any further push toward the 90.90 area, and whether the 50-period moving average keeps climbing fast enough to act as a rising floor rather than getting left behind by a stalling price.
KO Stock Forecast? Levels to Watch and Risk Framing
I will not pretend to hand you a KO stock forecast, because that is not what this is. What I can give you is where the chart’s attention is currently focused.
| Instrument | Near-Term Support | Near-Term Resistance | What I’m Watching |
| KO (Coca-Cola CFD) | $84.80 (50-period MA) / $82.00 | $88.00 / $90.90 | Whether the 50-period MA holds as a rising floor |
Table 1: Near-term levels traders are watching on KO stock as of 10:40 (GMT+8), 12 August 2026, based on the Vantage KO CFD 4-hour chart. Indicative only.
What to watch next: confirmation of the CCBA divestiture timeline through the third or fourth quarter of 20263; Coca-Cola’s third-quarter 2026 results, expected in October, against management’s warning that the second half will face tougher comparisons and a six-day reduction in fourth-quarter selling days2; and whether the current RSI cooling resolves back above its moving-average overlay or continues to soften.
On exposure: the levels above are reference points traders are watching, not instructions. A Stop Loss is a risk management tool that closes a position automatically once price reaches a level set in advance; it limits losses to a planned size rather than preventing them altogether, and it does not remove the need to size a position sensibly relative to account equity before entering the market.
On leverage: Vantage offers share CFDs, including KO stocks, with leverage that can vary by jurisdiction, account type and instrument; eligible clients may access leverage of up to 1:33.3 on share CFDs. Leverage is a double-edged tool. It multiplies gains and losses to the same degree, so position sizing and margin awareness matter more, not less, in a stock that rallied roughly 10% from the late-July consolidation to its $90.90 intraday high and is still working off an overbought reading.
Chart Reference
References
[1] “Coca-Cola hikes full-year forecast. CEO tells CNBC the World Cup boosted its brands – CNBC” https://www.cnbc.com/2026/07/28/coca-cola-ko-q2-2026-earnings.html Accessed on 12 August 2026.
[2] “Coca-Cola Reports Second Quarter 2026 Results and Raises Full Year Guidance – The Coca-Cola Company” https://investors.coca-colacompany.com/news-events/press-releases/detail/1168/coca-cola-reports-second-quarter-2026-results-and-raises-full-year-guidance Accessed on 12 August 2026.
[3] “Q2 2026 Earnings Release, Exhibit 99.1 – The Coca-Cola Company (SEC 8-K filing)” https://investors.coca-colacompany.com/filings-reports/all-sec-filings/content/0001628280-26-049922/a2026q2earningsreleaseex-9.htm Accessed on 12 August 2026.
[4] “The Coca-Cola Company (KO) Stock Price & Overview – StockAnalysis.com” https://stockanalysis.com/stocks/ko/ Accessed on 12 August 2026.
[5] “What Are Wall Street Analysts’ Target Price for Coca-Cola Stock? – Barchart via Yahoo Finance” https://finance.yahoo.com/markets/stocks/articles/wall-street-analysts-target-price-102956087.html Accessed on 12 August 2026.
[6] “Earnings Call Transcript: Coca-Cola Beats Q2 2026 Forecasts, Shares Jump 6% – Investing.com” https://www.investing.com/news/transcripts/earnings-call-transcript-cocacola-beats-q2-2026-forecasts-shares-jump-6-93CH-4817082 Accessed on 12 August 2026.
our Stock Market News Today tag rounds up the wider tape KO stock trades inside, and our Earnings News Today tag covers the reporting season this quarter sits in. For the chart-reading fundamentals behind this piece, see our Technical analysis tag, and for the closing risk framing, our Risk Management tag.
RISK WARNING: CFDs are complex financial instruments and carry a high risk of losing money rapidly due to leverage. You should ensure you fully understand the risks involved and carefully consider whether you can afford to take the high risk of losing your money before trading.
Disclaimer: The information is provided for educational purposes only and doesn’t take into account your personal objectives, financial circumstances, or needs. It does not constitute investment advice. We encourage you to seek independent advice if necessary. The information has not been prepared in accordance with legal requirements designed to promote the independence of investment research. No representation or warranty is given as to the accuracy or completeness of any information contained within. This material may contain historical or past performance figures and should not be relied on. Furthermore estimates, forward-looking statements, and forecasts cannot be guaranteed. The information on this site and the products and services offered are not intended for distribution to any person in any country or jurisdiction where such distribution or use would be contrary to local law or regulation.
The information has been prepared as of the date published and is subject to change thereafter. The information is provided for educational purposes only and doesn't take into account your personal objectives, financial circumstances, or needs. It does not constitute investment advice. We encourage you to seek independent advice if necessary. The information has not been prepared in accordance with legal requirements designed to promote the independence of investment research. No representation or warranty is given as to the accuracy or completeness of any information contained within. This material may contain historical or past performance figures and should not be relied on. Furthermore estimates, forward-looking statements, and forecasts cannot be guaranteed. The information on this site and the products and services offered are not intended for distribution to any person in any country or jurisdiction where such distribution or use would be contrary to local law or regulation.