Sour sentiment abates as the dollar powers ahead
Jamie Dutta >
Jamie Dutta >
Jamie Dutta is a Market Analyst for Vantage. He comes with extensive experience as a full-time trader and financial market commentator, having worked as a trader in top tier investment banks and trading houses.

Overnight Headlines
*Dollar breaks out to fresh 20-year highs as risk mood improves
*Fed’s Powell can’t guarantee “soft landing” as Fed looks to control inflation
*Rate hike bets build in Japan despite BoJ easy money insistence
*Gold falls below key support and 200-day SMA at $1836
USD pushed up to a new high at 104.92 even as government bond yields dipped. 10-year US Treasury yields fell below 3% and have moved lower for four straight days since topping out at 3.20%. EUR/USD fell 1.3% to 1.0353, the weakest since January 2017. GBP slipped for a sixth day to a new cycle low at 1.2164. Returning safe haven demand for JPY sent USD/JPY tumbling 1.3% to 128.34. AUD fell over 1% to close at 0.6856. That’s the lowest in nearly two years.
US equities pared most of their losses in the final hour of trade. The S&P500 recovered from a 1.8% fall to finish 0.1% lower. That drop had pushed it to the brink of a bear market. The Nasdaq eked out a marginal gain. Asian stocks are firmer as risk momentum improves slightly. Softbank has surged in Japan amid buyback hopes, despite a record loss. European futures are showing a higher open, reversing yesterday’s losses.
Market Thoughts – Fear gauge elevated but not in panic mode
The VIX, Wall Street’s so-called “fear gauge”, continues to hover above 30 with many investors waiting for it to rise sharply so we see some sort of selling capitulation. The VIX measures the expectation of stock market volatility in the S&P500 as expressed by 30-day options prices.
It averages below 20 on a long-term basis. But it hit a high close of 82.69 during the March 2020 pandemic market sell-off. Investors’ aggregate equity positioning has fallen to the lowest levels since that crisis. This may be a reason why we don’t get a sharp spike higher in the near term. Or will we have a moment of high-profile pain as various other asset classes, like digital assets, suffer?
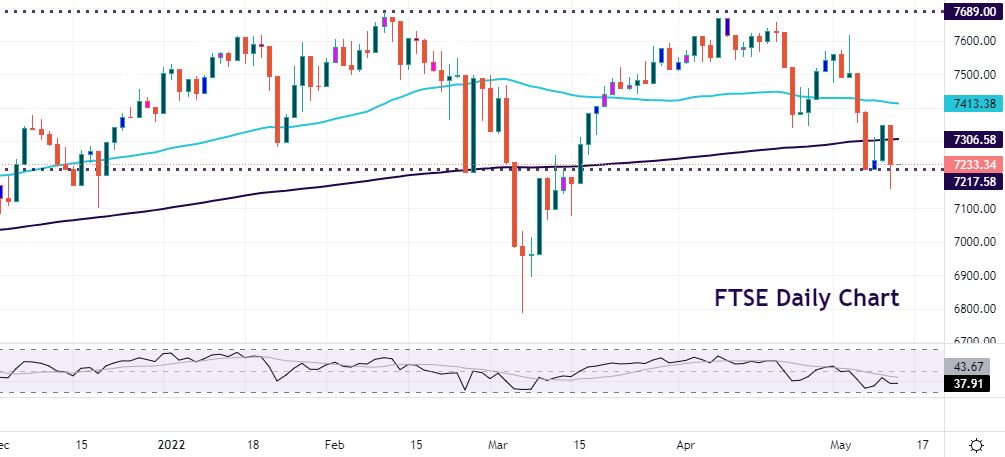
Chart of the Day – FTSE 100 bounces off support
Global equities have begun to price in stagflation themes. These include higher inflation, rising rates and slowing growth. The latter is under pressure from supply chain bottlenecks, and a slowdown in China driven by severe Covid-19 lockdowns. That said, the FTSE 100 has held up relatively well compared to the more tech-heavy US indices. The UK benchmark has only a small weighting of high-valuation growth names.
The market has hit strong resistance at the January 2020 high at 7689 on a few occasions this year. A long-term double top could be in the making. Prices have recently been trading around the 200-day SMA at 7305. The drop yesterday then dipped below previous support at 7217 and the midway point of this year’s high/low. The weekly close will be key for near-term direction. Initial support is at 7158 and 7101.
The information has been prepared as of the date published and is subject to change thereafter. The information is provided for educational purposes only and doesn't take into account your personal objectives, financial circumstances, or needs. It does not constitute investment advice. We encourage you to seek independent advice if necessary. The information has not been prepared in accordance with legal requirements designed to promote the independence of investment research. No representation or warranty is given as to the accuracy or completeness of any information contained within. This material may contain historical or past performance figures and should not be relied on. Furthermore estimates, forward-looking statements, and forecasts cannot be guaranteed. The information on this site and the products and services offered are not intended for distribution to any person in any country or jurisdiction where such distribution or use would be contrary to local law or regulation.
