

 Login
Login


[DAILY TRADING] SP500 Analysis 14 July 2026 – SP500 Index Holds Near 7,530 as Iran Risk Meets CPI Day

Vantage Editorial Team >
Vantage Editorial Team >
Vantage is a global, multi-asset broker with a team of in-house writers and market analysts who produce educational and insightful trading content for traders of all levels.
 Updated Thu, 2026 July 16 06:10
![[DAILY TRADING] SP500 Analysis 14 July 2026 – SP500 Index Holds Near 7,530 as Iran Risk Meets CPI Day](/wp-content/themes/vantage/images/press-single-top-img.webp)
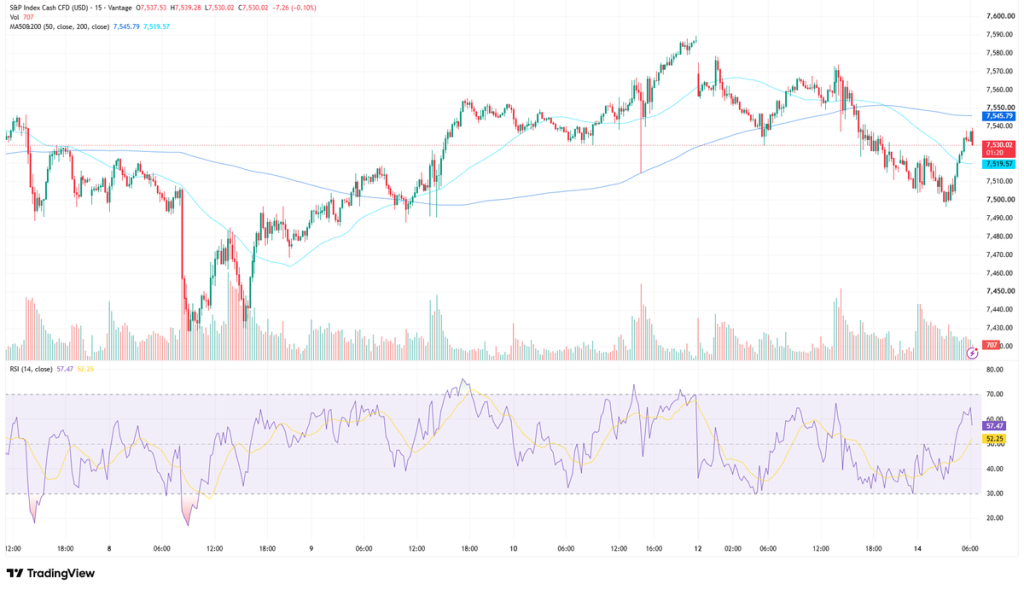
As of 14:28 (GMT+8) / 06:28 UTC on 14 July 2026, the Vantage SP500 index now trades near 7,530, little changed after Monday’s sharper pullback. The SP500 price opened at 7,537.53, reached a high of 7,539.28 and a low of 7,530.02, before sitting at 7,530.02, down 7.26 points, or 0.10%, on the period shown.
The S&P 500 index is digesting a heavy week of catalysts. Monday brought a fresh US-Iran escalation around the Strait of Hormuz, and Tuesday’s calendar layers on the US CPI report for June and the start of second-quarter bank earnings. This SP500 news update reads the chart and the flow together, without calling a direction.
SP500 Chart: What Today’s Price Action Is Showing
On the 15-minute SP500 chart, price has traded in a tight band this session, holding between the 7,530.02 low and the 7,539.28 high. That range sits below the 50-period moving average, at 7,545.79, and above the 200-period moving average, at 7,519.57, per the TradingView setup used here. Price threading between the two typically signals indecision rather than a clean trend.
The Relative Strength Index reads 57.47, with its moving-average overlay at 52.25, both attributed to the TradingView setup used for this analysis. Neither is close to overbought or oversold. Volume on the most recent bar was 707 contracts on the Vantage CFD feed, in line with a stabilising session.
SP500 News: Why the Index Pulled Back
Monday’s session broke a run of gains. The SP500 lost 0.79% to close at 7,515.34, down from Friday’s 7,575.39, after President Trump said the US would reinstate what he termed a blockade on Iranian shipping through the Strait of Hormuz and apply a 20% cargo fee.[1]
Iran said it had closed the Strait, a claim disputed by the White House.[2] Shipping conditions remain a live dispute between the two governments rather than a settled fact, and traders are watching for further statements.
The friction pushed oil higher, with Brent settling near $83.50 a barrel and WTI near $78.30.[1] Higher energy prices can reinforce inflation concerns, contributing to pressure on equities.
Tuesday’s June CPI report is scheduled before the US market opens.[3] Strategist Louis Navellier has suggested the print could show a modest month-on-month decline, supporting the case inflation is still easing.[4] That is his view as reported, not a Vantage forecast.
Earnings season also opens this week, with JPMorgan Chase, Goldman Sachs, Morgan Stanley, Bank of America, Citigroup and Wells Fargo among the first to report, alongside Netflix and UnitedHealth Group.[3] LSEG data points to aggregate SP500 earnings growth near 23.7% year on year.[2]
Semiconductor names have added volatility too, following a turbulent US debut for chipmaker SK Hynix.[5] The spillover has hit the Nasdaq harder, but sentiment has spread across broader US indices.
SP500 Levels to Watch
The table below sets out the S&P 500 price zones traders are watching this session. These are reference levels, not trade signals.
| Level | Support | Resistance | What’s happening |
| SP500 | 7,500 / 7,519.57 (200-period MA) | 7,545.79 (50-period MA) / 7,575.39 | Consolidating after Monday’s decline; holding above the 200-period MA |
The 7,500 mark has acted as a floor over the past two sessions, close to the 200-period moving average at 7,519.57. On the upside, the 50-period moving average at 7,545.79 and Friday’s 7,575.39 close are the nearest markers should sentiment improve.
SP500 Outlook: What to Watch Today
- CPI Report, 14 July 2026: US CPI for June is scheduled for release before the US market opens, alongside June PPI a day later.
- Bank Earnings, 14 July 2026: JPMorgan Chase, Goldman Sachs, Wells Fargo, Citigroup, Bank of America and Morgan Stanley are among the lenders reporting this week.
- Fed Commentary, This week: Further remarks from Federal Reserve officials follow Monday’s comments from Vice Chair Michelle Bowman and Governor Christopher Waller.
- Strait of Hormuz, Ongoing: Any shift in the shipping dispute between the US and Iran carries direct implications for oil prices and the inflation outlook.
Markets have reacted fast to Middle East headlines, and that could continue through the CPI print and early earnings. Vantage offers the SP500 alongside 900+ other CFD instruments, and leverage cuts both ways here: leveraged positions amplify gains and losses alike.
Unlike an SP500 index fund, a CFD lets traders take either side of the move. Stop Loss placement around the current range is one tool used to manage downside exposure ahead of a data-heavy session.
Leverage works both ways when CPI and Iran headlines can move the SP500 within minutes. Position sizing relative to account equity is worth revisiting before the CPI print, especially for leveraged exposure across correlated CFDs.
RISK WARNING: CFDs are complex financial instruments and carry a high risk of losing money rapidly due to leverage. You should ensure you fully understand the risks involved and carefully consider whether you can afford to take the high risk of losing your money before trading.
Disclaimer: The information is provided for educational purposes only and doesn’t take into account your personal objectives, financial circumstances, or needs. It does not constitute investment advice. We encourage you to seek independent advice if necessary. The information has not been prepared in accordance with legal requirements designed to promote the independence of investment research. No representation or warranty is given as to the accuracy or completeness of any information contained within. This material may contain historical or past performance figures and should not be relied on. Furthermore estimates, forward-looking statements, and forecasts cannot be guaranteed. The information on this site and the products and services offered are not intended for distribution to any person in any country or jurisdiction where such distribution or use would be contrary to local law or regulation.
References
[1] “S&P 500: Wall Street Benchmark Falls to 7,515 as Trump Reinstates Iran Shipping Blockade – BBN Times” https://www.bbntimes.com/financial/s-p-500-wall-street-benchmark-falls-to-7-515-as-trump-reinstates-iran-shipping-blockade Accessed on 14 July 2026.
[2] “S&P 500, Nasdaq Futures Decline as US-Iran Escalation Rattles Sentiment – Reuters via U.S. News” https://money.usnews.com/investing/news/articles/2026-07-13/s-p-500-nasdaq-futures-decline-as-us-iran-escalation-rattles-sentiment Accessed on 14 July 2026.
[3] “Stock market news for July 13, 2026 – CNBC” https://www.cnbc.com/2026/07/13/stock-market-today-live-updates.html Accessed on 14 July 2026.
[4] “Stock Market: Will S&P 500 Open Up or Down Today? – Benzinga” https://www.benzinga.com/markets/prediction-markets/26/07/60432670/stock-market-will-sp-500-open-up-or-down-today-9 Accessed on 14 July 2026.
[5] “Stock market today: Dow, S&P 500, Nasdaq fall as chip stocks tumble, oil surges on US-Iran tensions – Yahoo Finance” https://finance.yahoo.com/markets/live/stock-market-today-monday-july-13-dow-sp-nasdaq-113249278.html Accessed on 14 July 2026.
[6] “Stock market today: S&P 500, Nasdaq, Dow futures slip as Iran tensions ratchet up, bank earnings and Fed report on deck – Yahoo Finance” https://finance.yahoo.com/markets/stocks/live/stock-market-today-tuesday-july-14-231302282.html Accessed on 14 July 2026.
[7] “United States Stock Market Index – Trading Economics” https://tradingeconomics.com/united-states/stock-market Accessed on 14 July 2026.
The information has been prepared as of the date published and is subject to change thereafter. The information is provided for educational purposes only and doesn't take into account your personal objectives, financial circumstances, or needs. It does not constitute investment advice. We encourage you to seek independent advice if necessary. The information has not been prepared in accordance with legal requirements designed to promote the independence of investment research. No representation or warranty is given as to the accuracy or completeness of any information contained within. This material may contain historical or past performance figures and should not be relied on. Furthermore estimates, forward-looking statements, and forecasts cannot be guaranteed. The information on this site and the products and services offered are not intended for distribution to any person in any country or jurisdiction where such distribution or use would be contrary to local law or regulation.