


 Login





Why Gold Slipped as Treasury Yields Outweighed Fed Relief – XAUUSD Analysis

Vantage Editorial Team >
Vantage Editorial Team >
Vantage is a global, multi-asset broker with a team of in-house writers and market analysts who produce educational and insightful trading content for traders of all levels.
 Updated Thu, 2026 October 8 07:21

Key Takeaways
- Vantage XAUUSD traded at $4,144.11 as of 10:24 (GMT+8) on 7 October 2026, below both its 50-hour and 200-hour moving averages.
- Odds of an October Fed rate hike fell from over 70% to just above 20% in a week, according to CME FedWatch data cited by BullionVault.1,8
The gold price in USD sat at $4,144.11 as of 02:24 (UTC) / 10:24 (GMT+8) on 7 October 2026, and on paper it had every reason to be higher. Over the past week, the odds of an October Federal Reserve (Fed) rate hike fell from over 70% to just above 20%, and Friday’s soft US jobs report extended the slide.1,6,8 Gold rose more than 1% on the data, then handed the gains back.7
That disconnect is the real gold rate news this week, and it runs through most of today’s XAUUSD news. Below, we unpack why bonds and the dollar have been shouting louder than the Fed, and which levels matter before next week’s US inflation print.
As of 10:24 (GMT+8) on 7 October 2026, the Vantage XAUUSD price stood at $4,144.11 on the one-hour chart, with the 50-hour moving average (MA) at $4,149.17 and the 200-hour MA at $4,180.51 (Figure 1).
Why Is the Gold Price Down Today?
XAUUSD analysis today: Gold traded at $4,144.11 at 10:24 (GMT+8) on 7 October 2026, near two-month lows, as high Treasury yields and a strong US dollar outweighed fading Fed hike bets. A falling 200-hour moving average at $4,180.51 capped two rallies; support held near $4,105.
Here is this week’s gold price news in one table:
Gold Rate USD Drivers at a Glance (as of 7 October 2026)
| Driver | Latest Reading | How It Lined Up With Gold |
|---|---|---|
| October Fed Hike Odds | Just above 20%, from over 70% a week earlier1,8 | Supportive: Lower odds cut the cost of holding gold |
| US 10-Year Treasury Yield | 5.278% close on 6 October, near 2002-era highs2 | Weighed on gold, which pays no yield |
| US Dollar Index | Reached its highest since April 2025 on 5 October1 | Weighed on gold, which is priced in dollars |
| XAUUSD Chart | Below the falling 200-hour MA at $4,180.51 | Capped rallies on 2 and 6 October |
Data compiled by Vantage from BullionVault, Investing.com, and CME FedWatch, as of 7 October 2026.
Three of four drivers worked against gold. So why did the Fed, usually gold’s loudest ally, lose the vote?
Yields and the Dollar Outshout the Fed
Start with the jobs report, because that is where gold’s week was supposed to turn. The US economy added just 29,000 jobs in September, and unemployment rose to 4.2%, Kitco reported.6 Markets still priced at least one hike by December at above 80%, though, so the Federal Reserve relief was partial at best.1
Then the bond market had its say. US 10-year and 30-year Treasury yields both recently hit their highest levels since 2002.2,7 Even after Treasuries rallied on Tuesday, the 10-year closed at 5.278% and the 30-year at 5.661%.2 When cash and bonds pay that much, a metal that pays nothing has to work a lot harder for attention.
The dollar piled on. French fiscal and political stress helped push the euro to a 17-month low, lifting the US Dollar Index to its highest level since April 2025 on Monday.1,2
Analysts noticed the mismatch quickly. Jeff Toshima, former Tokyo director at the World Gold Council, put it plainly: “Gold’s price action looks a little worrying”.1 XS.com’s Simon-Peter Massabni said the jobs data gave gold policy support but had “not yet provided technical confirmation” of a renewed uptrend.6
Positioning split by time horizon. Money managers cut Comex net longs for a fifth straight week, to 386.98 tonnes, while gold exchange-traded fund (ETF) holdings rose to a four-year high in September, Saxo Bank’s Ole Hansen noted.1
The Middle East conflict hums in the background, with Brent at $101.21 a barrel on Tuesday.2 For gold, oil matters mostly through inflation expectations, which loop straight back to yields.
The macro picture says yields are winning. The chart agrees, and it is not subtle.
XAUUSD Technical Analysis Today: Rallies Stall at the 200-Hour MA
On the XAUUSD chart, the falling 200-hour MA has played bouncer since late September.
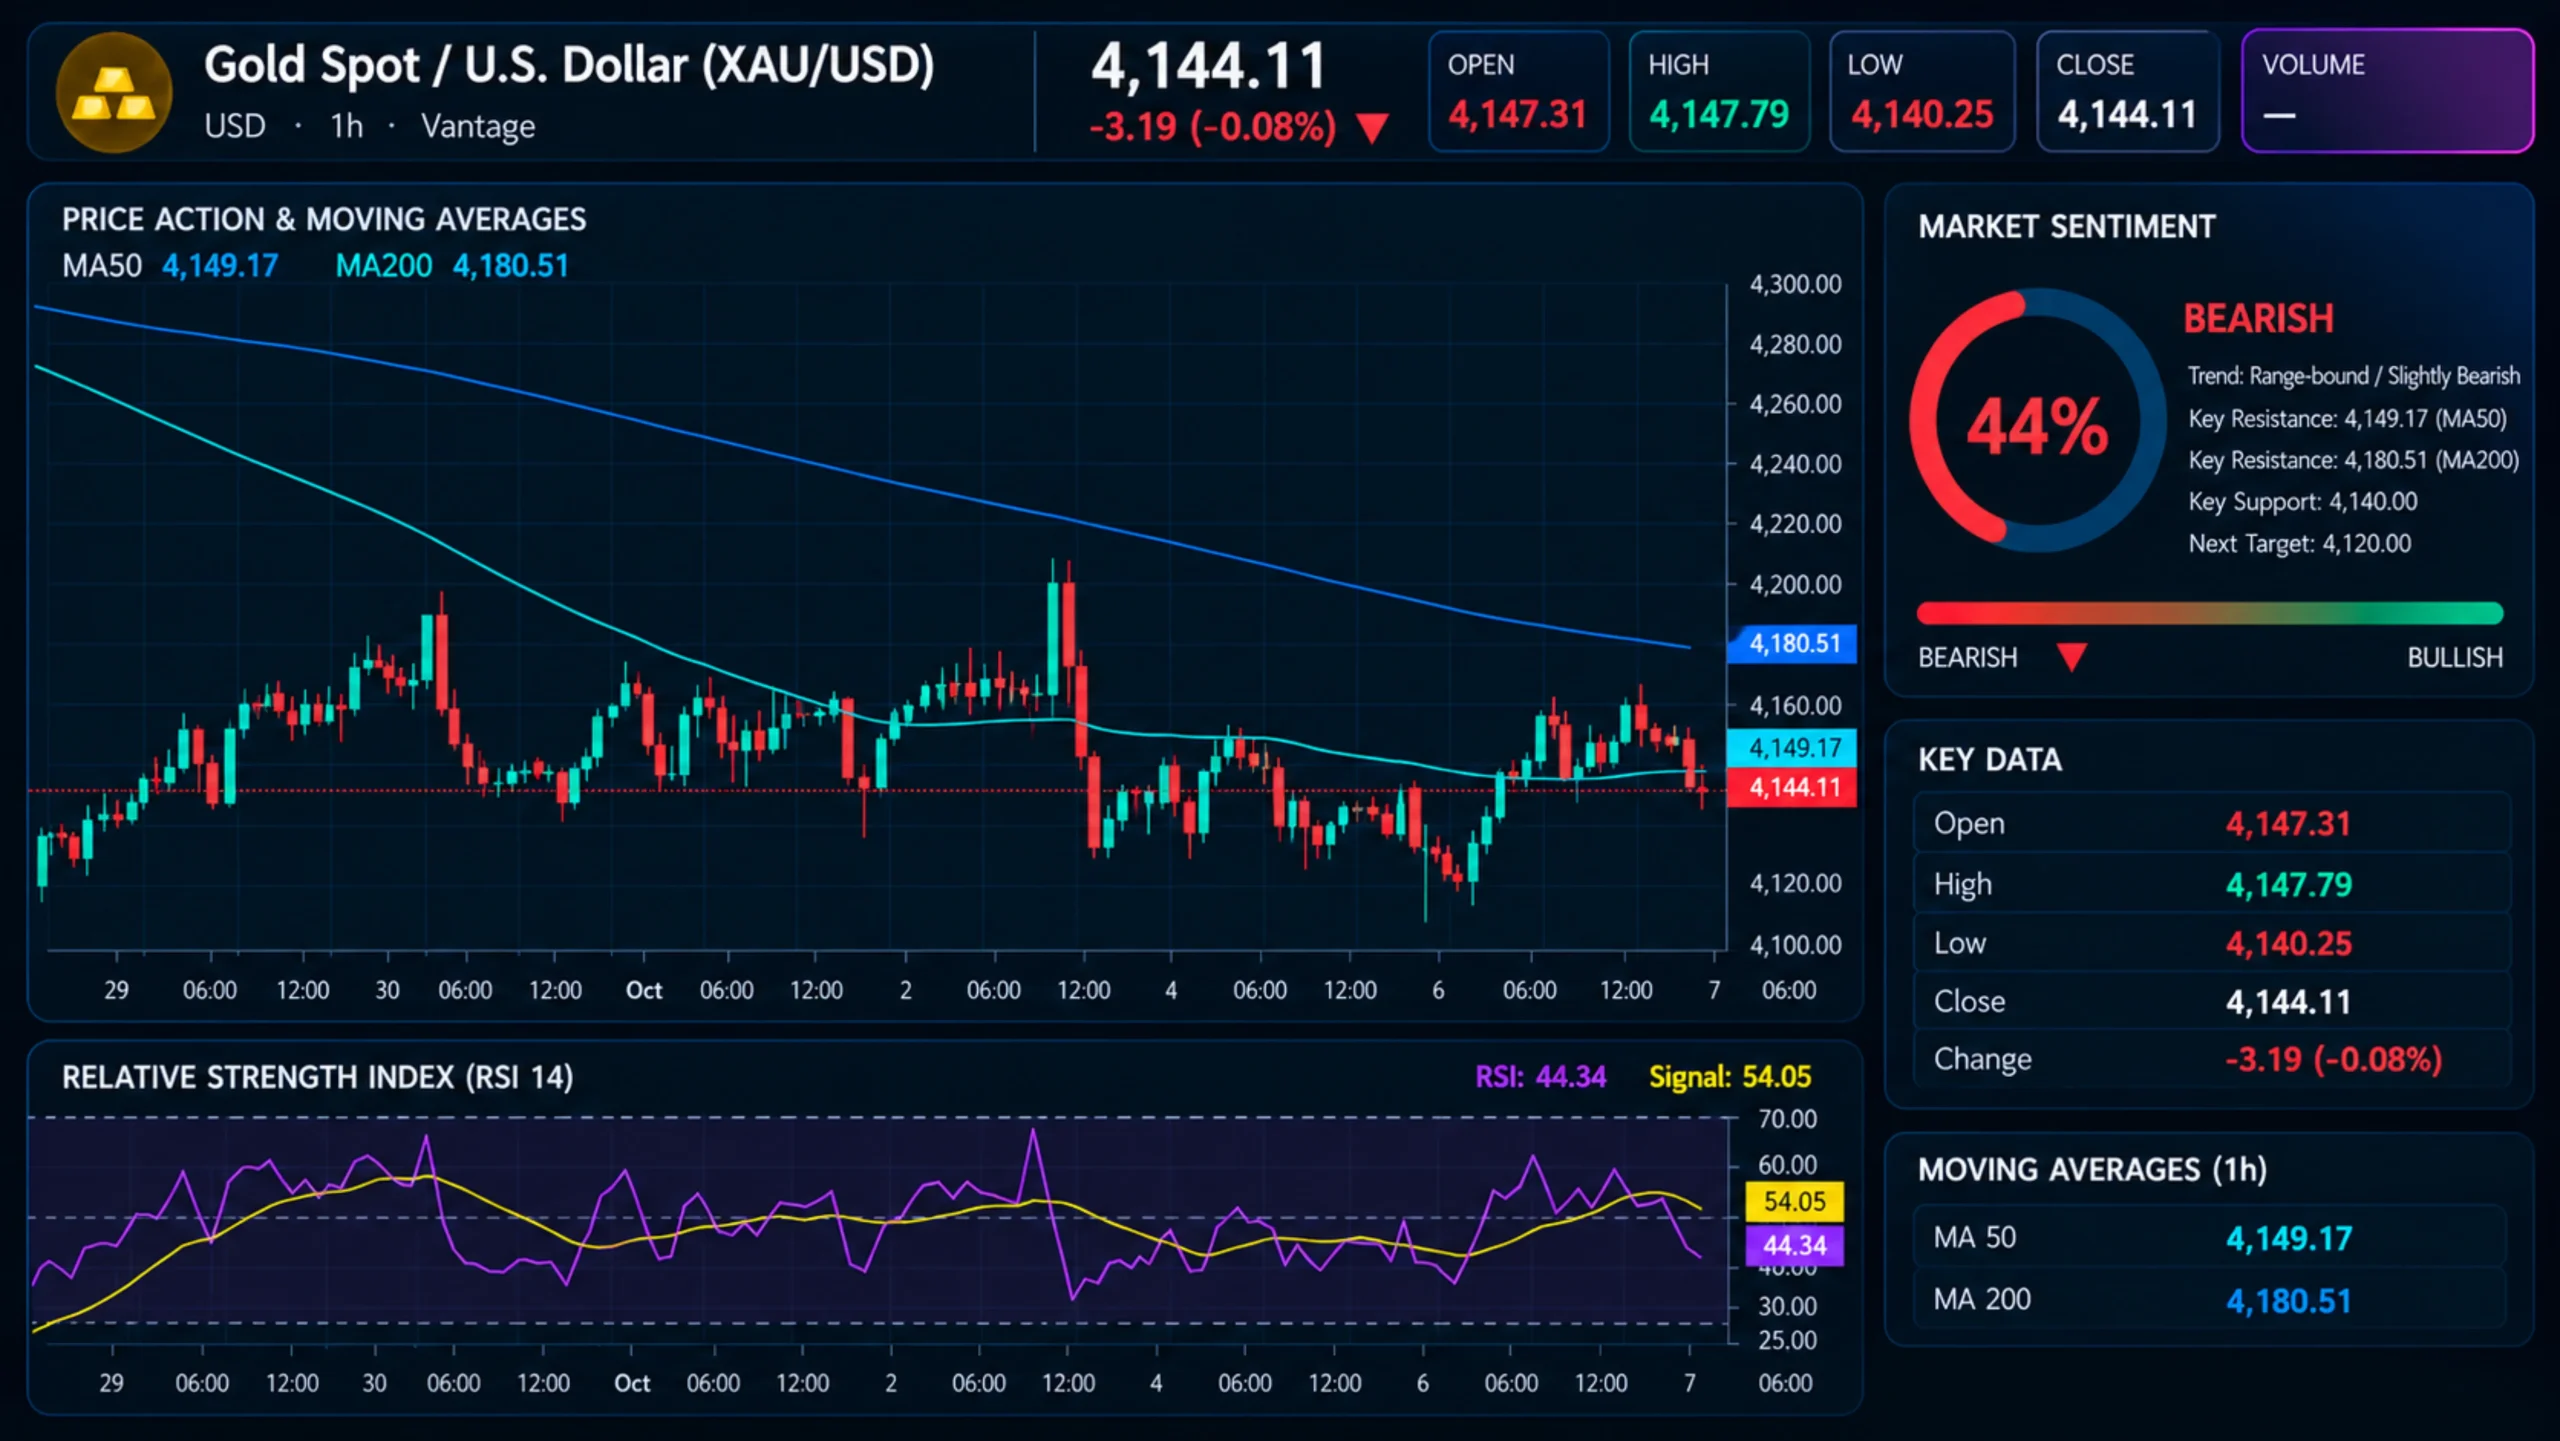
The 200-hour MA slid from around $4,300 to $4,180.51. Two attempts to clear it ended the same way:
- 2 October, Jobs Data: Gold spiked to the $4,225 area after the 20:30 (GMT+8) release, tagged the 200-hour MA, then dropped roughly $100 to near $4,125 within hours. Bloomberg put the intraday low at $4,125.39.3
- 6 October, Bond Bounce: Gold climbed from the $4,105 to $4,115 area into the $4,180 to $4,185 zone, met the 200-hour MA again, and stalled.
The 50-hour MA tells a calmer story. It has flattened at $4,149.17, and gold keeps crossing it, which is what a sideways market looks like on a gold USD chart.
Momentum has cooled with it. The 14-period Relative Strength Index (RSI) read 44.34 as of 10:24 (GMT+8), according to the TradingView setup used for this analysis. That is down from a peak near 63 during Tuesday’s rally and below its signal line at 54.05.
On Friday, Marex analyst Edward Meir summed up the technical analysis picture bluntly: “The charts still look fairly grim”.7
The Fed gave gold a reason to rally. The 200-hour moving average gave it a ceiling.
A lower high on 6 October, a falling average overhead, and a floor that has held twice: That is a defined range.
XAUUSD Levels Traders Are Watching

Key XAUUSD Levels as of 10:24 (GMT+8) on 7 October 2026
| Level | Price (USD) | Why It Matters |
|---|---|---|
| Level 2 Resistance | 4,220 to 4,225 area | Highs of 30 September and the 2 October jobs-data spike |
| Level 1 Resistance | 4,180.51 | Falling 200-hour MA; capped the 6 October rally |
| Pivot | 4,149.17 | Flat 50-hour MA; price traded just below it |
| Level 1 Support | 4,125 area | 2 October post-payrolls low 3 |
| Level 2 Support | 4,105 to 4,115 area | 6 October lows; held twice |
Levels are read from the Vantage XAUUSD H1 chart on TradingView (Figure 1). Data indicative, for informational purposes only.
The $4,105 to $4,115 floor sits at two-month lows; BullionVault noted last week’s dip took gold to its weakest level since 5 August.1 Trade Nation’s David Morrison pointed to support around $4,000 if dollar strength persists, though he also said he believes gold is not far from bottoming.6 For now, he noted, the gold and silver charts suggest “neither is ready to take off yet”.2
Levels show where gold has reacted before. The calendar decides whether they hold.
Fed Minutes and CPI Test the Range
This read changes if yields ease while hike bets stay low, or if hotter inflation rebuilds those bets. Fifth Third’s Bill Adams argued that September’s Consumer Price Index (CPI) and Producer Price Index (PPI) reports carry more weight for the late-October Fed decision than the jobs data.6
Dates worth marking on the economic calendar:
- Fed Minutes, 8 October, 02:00 (GMT+8): The Federal Reserve publishes minutes of the Federal Open Market Committee (FOMC) meeting held on 15 to 16 September, at 14:00 (ET) on 7 October.4
- US CPI, 14 October, 20:30 (GMT+8): The Bureau of Labor Statistics releases September consumer prices.5
- US PPI, 15 October, 20:30 (GMT+8): September producer prices follow a day later.5
- FOMC Decision, 29 October, 02:00 (GMT+8): The two-day meeting ends on 28 October in Washington.4
Gold looked oddly heavy for a market that had just watched hike odds collapse. Each Fed-led rally ran into a falling 200-hour MA and a bond market that has not blinked. So far, yields have been the stronger force.
Gold moved about $100 within hours of a single data release on 2 October. Gold trading carries significant risk, and a Stop Loss does not prevent losses, though it can limit them to a planned size. Prices can gap past it around major releases.
Leverage on XAUUSD is double-edged: It magnifies losses as much as potential returns, relative to the capital committed. Whether the horizon is a short-term trade or longer-term XAUUSD investing, position sizing that reflects total account equity, rather than the size of one expected move, keeps a single volatile session from having an outsized effect on the account balance. For more on trading XAUUSD, see the Vantage Academy guide; gold trading contract details sit on the product page.
Gold Price FAQ
What Is the US Gold Rate Today?
For anyone checking the gold rate in dollar today, Vantage XAUUSD traded at $4,144.11 per ounce as of 10:24 (GMT+8) on 7 October 2026, below both hourly moving averages (Figure 1).
Is There a Gold Price Prediction or XAUUSD Prediction Today?
Vantage does not publish a gold price prediction or an XAUUSD forecast. This analysis sets out the levels traders are watching instead, from $4,180.51 down to the $4,105 area. Any third-party XAUUSD prediction carries no guarantee.
What Is Driving XAUUSD News Today?
High Treasury yields and a firm dollar have weighed on gold, even as markets cut October hike bets.1,2 For updates, follow gold news today.
RISK WARNING: CFDs are complex financial instruments and carry a high risk of losing money rapidly due to leverage. You should ensure you fully understand the risks involved and carefully consider whether you can afford to take the high risk of losing your money before trading.
Disclaimer: The information is provided for educational purposes only and doesn’t take into account your personal objectives, financial circumstances, or needs. It does not constitute investment advice. We encourage you to seek independent advice if necessary. The information has not been prepared in accordance with legal requirements designed to promote the independence of investment research. No representation or warranty is given as to the accuracy or completeness of any information contained within. This material may contain historical or past performance figures and should not be relied on. Furthermore estimates, forward-looking statements, and forecasts cannot be guaranteed. The information on this site and the products and services offered are not intended for distribution to any person in any country or jurisdiction where such distribution or use would be contrary to local law or regulation.
References
[1] “Gold Under Pressure as Bond Yields and Dollar Stay Elevated, Speculators Cut Longs – BullionVault” https://www.bullionvault.com/gold-news/gold-price-news/gold-falls-bond-yields-dollar-100520261 Accessed on 7 October 2026.
[2] “Gold up slightly as dollar eases and bonds catch a bid, but gains capped by oil – Investing.com” https://www.investing.com/news/commodities-news/gold-holds-near-4140-as-dollar-yields-offset-lower-fed-hike-expectations-4933176 Accessed on 7 October 2026.
[3] “Gold Declines as High Yields Outweigh Bets on Fed Rate Hold – Bloomberg” https://www.bloomberg.com/news/articles/2026-10-02/gold-steadies-as-easing-us-bond-yields-reduce-rate-hike-bets Accessed on 7 October 2026.
[4] “October 2026 – Federal Reserve Board” https://www.federalreserve.gov/newsevents/2026-october.htm Accessed on 7 October 2026.
[5] “Schedule of Releases for October 2026 – US Bureau of Labor Statistics” https://www.bls.gov/schedule/2026/10_sched_list.htm Accessed on 7 October 2026.
[6] “Gold bulls disappointed as weak jobs report fails to spark rally, $4,000 support looms – Kitco” https://www.kitco.com/news/article/2026-10-02/gold-bulls-disappointed-weak-jobs-report-fails-spark-rally-4000-support Accessed on 7 October 2026.
[7] “Gold heads for weekly drop as strong dollar, elevated Treasury yields weigh – Kitco (Reuters)” https://www.kitco.com/news/off-the-wire/2026-10-02/gold-heads-weekly-drop-strong-dollar-elevated-treasury-yields-weigh Accessed on 7 October 2026.
[8] “CME FedWatch Tool – CME Group” https://www.cmegroup.com/markets/interest-rates/cme-fedwatch-tool.html Accessed on 7 October 2026.
The information has been prepared as of the date published and is subject to change thereafter. The information is provided for educational purposes only and doesn't take into account your personal objectives, financial circumstances, or needs. It does not constitute investment advice. We encourage you to seek independent advice if necessary. The information has not been prepared in accordance with legal requirements designed to promote the independence of investment research. No representation or warranty is given as to the accuracy or completeness of any information contained within. This material may contain historical or past performance figures and should not be relied on. Furthermore estimates, forward-looking statements, and forecasts cannot be guaranteed. The information on this site and the products and services offered are not intended for distribution to any person in any country or jurisdiction where such distribution or use would be contrary to local law or regulation.
