


Vantage uses cookies that are essential for our website to work. We also use optional analytical cookies to help us to improve our website and the services, content and ads we provide to you which you can accept or reject here. Please see our Cookies Policy for more information on how we use cookies.
Chart Patterns – Continuation
Ascending Triangle – Bullish Continuation Pattern:
The Ascending Triangle is one of the most reliable bullish continuation or accumulation patterns. It is characterized by a series of higher lows failing at a flat top – this means it is a ‘terminal’ pattern – eventually price will have to stop carving higher lows, or more often than not, the top will have to break.
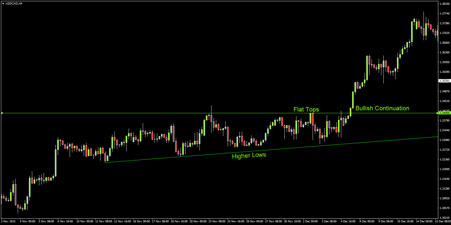
Just like the reversal patterns discussed in the previous section, the buy signal occurs when the top breaks and the pattern is confirmed.
Descending Triangle – Bearish Continuation Pattern:
The Descending Triangle on the other hand, is a very reliable bearish continuation pattern. The pattern is characterized by a series of lower highs meeting a flat bottom.
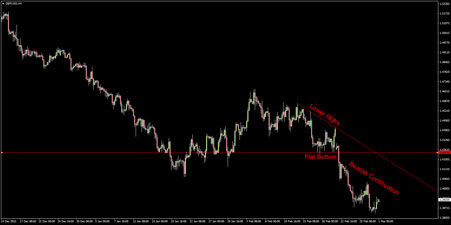
Traders will enter short when the flat bottom is taken out. As we discussed in the Trend Trading section, price can decline quite quickly in a bear market – these patterns often yield impressive moves lower.
Bull Flag – Bullish Continuation Pattern:
Bull Flags or Pennants are an extremely reliable bullish continuation pattern. They are deceptive to the novice trader as price is temporarily trending down, but at a relatively shallow pace. Bull flags are characterized by a series of parallel lower highs and lower lows within a dominant uptrend:
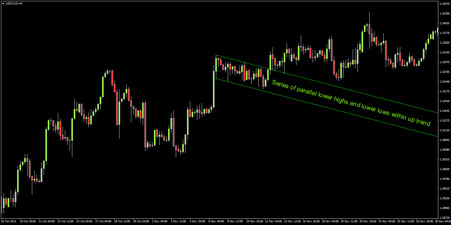
A buy signal is triggered when the upper parallel is breached.
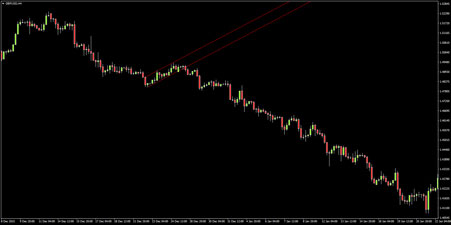
Bear Flag – Bearish Continuation Pattern:
The last continuation pattern we will look at is the Bear Flag. The opposite of the Bull Flag, characterized by a series of parallel higher lows and higher highs within a dominant down trend:
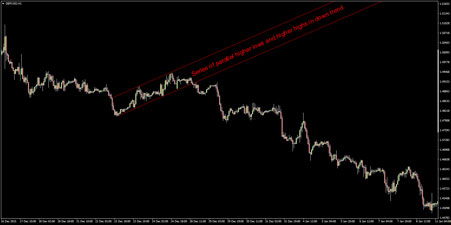
Traders will look to enter short once the lower parallel breaks. Just like the Descending Triangle, these patterns can lead to some fierce bearish continuation – in this case, GBPUSD declines over 800 pips in less than a month.
The Take Away: Chart patterns are often high probability, high reward trades that offer the trade clear entry and stop loss levels. Patterns are confirmed when the relevant line breaks – not before – wait for the breakout.
Again, go back on your MT4 trading platform and see how many of each forex chart pattern you can find.