

 Login
Login



 Updated
Gold and silver have been used as stores of value for thousands of years. Today, they remain two of the most actively traded commodities in the world, attracting everyone from long-term investors seeking a hedge against inflation to short-term traders looking to capitalise on price volatility. Whether you are exploring precious metals for the first time or looking to sharpen an existing approach, understanding how these markets work is the essential first step.
This guide covers how gold and silver prices fluctuate, what drives them, the most widely used gold and silver trading strategies, and how to read the key technical and macro signals that move these markets on a daily basis.
Key Takeaways
- Gold and silver are globally traded commodities with prices set by a combination of international benchmarks, macroeconomic factors, and real-time supply and demand.
- Gold is primarily driven by US real yields, the US Dollar Index (DXY), and Federal Reserve policy—not supply and demand alone.
- Silver is more volatile than gold due to its dual role as both a monetary metal and as an industrial commodity used in electronics, solar panels, and manufacturing.
- The gold-silver ratio—calculated by dividing the gold price by the silver price—has historically ranged between 1:40 and 1:100, and is used as a relative value signal between the two metals.
- The FOMC interest rate decision is the single, most market-moving scheduled event for gold and silver traders.
- The London-New York session overlap (12:00–16:00 UTC) is the trading window with the highest liquidity and volatility for precious metals.
- There are multiple ways to trade gold and silver including exchange-traded funds (ETFs), futures, mining stocks, and contracts for difference (CFDs). Each asset class has different cost structures, margin requirements, and risk profiles.
How to Trade Gold and Silver: Choosing Your Method
There are several ways to gain exposure to gold and silver price movements, each with a different structure, cost, and risk profile. Understanding your options can help you choose the approach that fits your trading style and objectives.
| Method | How It Works | Best Suited For | Key Consideration |
| Physical Bullion | Buy and hold coins or bars through a dealer or mint | Long-term wealth preservation | Storage and insurance costs. No ability to short or use leverage. |
| Gold/Silver ETFs | Buy ETFs tracking spot prices (e.g., GLD, SLV) | Passive investors wanting price exposure without storage | Management fees apply. Cannot short without specialist products. |
| Mining Stocks | Buy shares in gold or silver mining companies | Investors seeking leveraged exposure to metal prices via equities | Company-specific risk (operational, management) adds to price risk. |
| Futures Contracts | Standardised contracts to buy or sell at a set price on a future date | Institutional and experienced traders | Large contract sizes. Rollover costs. Requires commodity exchange access. |
| Contracts for Difference (CFDs) | Speculate on price movements without owning the underlying metal | Active traders wanting flexible, leveraged access in both directions | Leverage amplifies both gains and losses. Overnight financing charges apply. |
Why Trade Gold and Silver?
Precious metals occupy a unique position in global financial markets. Unlike equities or bonds, gold and silver are not claims on a company’s earnings or a government’s tax revenue. Their value is rooted in scarcity, universal recognition, and centuries of use as a medium of exchange—qualities that give them a distinct behaviour pattern compared to other asset classes.
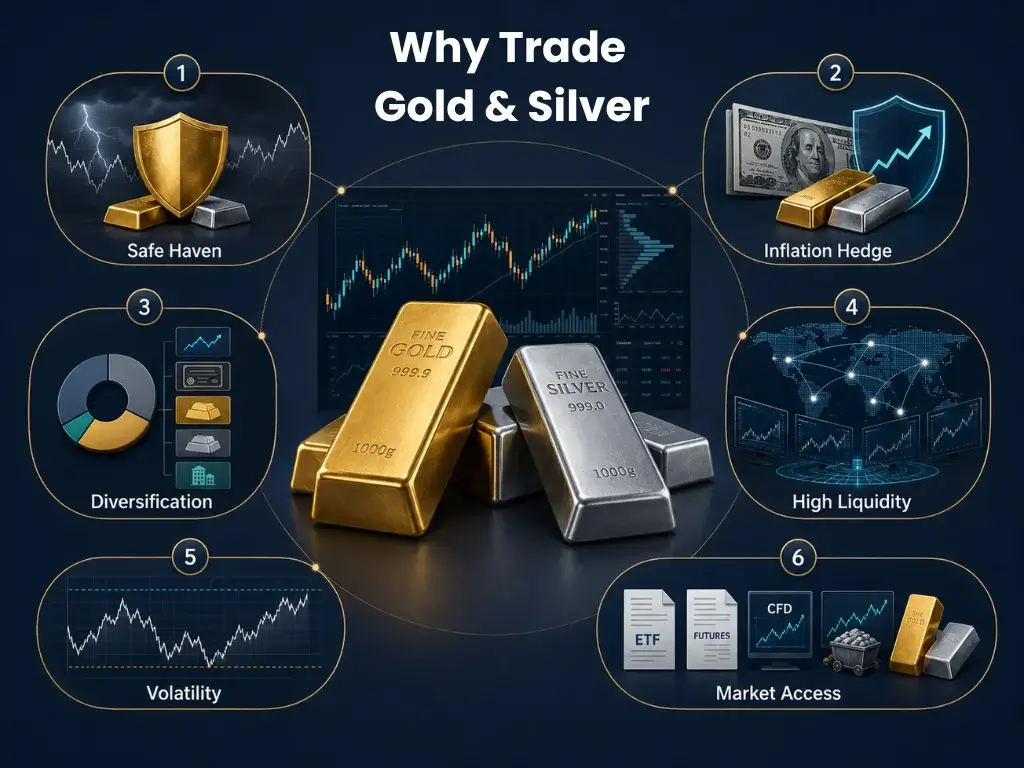
Key reasons traders and investors include gold and silver in their market activity:
- Safe-Haven Demand: Gold attracts capital during geopolitical crises, equity market selloffs, and periods of elevated uncertainty. It has a well-documented history of preserving value when other assets decline.
- Inflation Hedge: Both metals, especially gold, have historically maintained purchasing power over long periods, making them a common hedge against currency debasement.
- Portfolio Diversification: Gold and silver often move independently of equities and bonds, providing a potential diversification benefit when added to a broader portfolio.
- High Liquidity: Gold is one of the most liquid commodities in the world, with deep markets operating nearly 24 hours a day across London, New York, and Asian exchanges.
- Volatility Opportunities: Silver, in particular, can move 3–5% or more in a single session, creating short-term trading opportunities that are less common in more stable asset classes.
- Greater Accessibility: Traders can access gold and silver through physical bullion, ETFs, mining equities, futures contracts, and CFDs, each with different cost and risk profiles.
How Global Gold and Silver Prices Are Formed
Before applying any gold and silver trading strategy, it’s essential to understand what drives the gold and silver prices you see on the brokerage platform. Prices typically originate from a combination of institutional benchmark mechanisms and real-time futures trading.
The LBMA Gold Price (London Fix)
The London Bullion Market Association (LBMA) sets the global benchmark for gold twice daily (10:30 AM and 3:00 PM London time) through an electronic auction process involving major bullion banks. This price—quoted in USD per troy ounce—is the reference rate used in contracts, ETFs, and derivatives worldwide.
COMEX Futures (CME Group, New York)
COMEX gold and silver futures are the most actively traded derivatives globally. The front-month COMEX contract effectively sets the real-time global spot price. COMEX trading hours (8:20 AM – 1:30 PM ET, with electronic trading nearly 24 hours) are the highest-volatility window for gold and silver CFDs.
Key Factors That Move Gold and Silver Prices
Gold and silver often respond to the same macroeconomic drivers, but the strength and direction of their reactions can differ. The table below outlines the typical market response to major factors such as the US dollar, interest rates, inflation, geopolitical risk, equity market sell-offs, industrial activity, real yields, and central bank demand.
These relationships are best viewed as common market tendencies rather than fixed rules. Price movements may differ depending on wider market conditions, liquidity, and whether several factors are influencing the market at the same time.
| Factor | Impact on Gold | Impact on Silver |
| USD strengthens (DXY rises) | Bearish—gold priced in USD becomes more expensive for non-USD buyers | Bearish—same USD inverse relationship applies |
| US Federal Reserve raises rates | Moderately bearish—higher yields raise the opportunity cost of holding gold | Strongly bearish—rate hikes also dampen industrial demand |
| Inflation rises above expectations | Bullish—gold is a traditional inflation hedge | Mixed—inflation hedge benefit offset by industrial slowdown risk |
| Geopolitical tensions escalate | Strongly bullish—safe-haven capital flows accelerate | Moderately bullish—less consistent safe-haven response than gold |
| Global equities sell off sharply | Strongly bullish—flight-to-safety buying behaviour | Moderately bullish—can also be pressured by risk-off industrial outlook |
| Industrial output / PMI rises | Neutral to slightly positive | Bullish—silver has significant industrial uses in electronics and solar |
| Real yields rise (TIPS yield) | Bearish—higher real returns reduce gold’s relative appeal | Bearish—follows gold with typically amplified moves |
| Central bank buying increases | Bullish—structural demand provides long-term price support | Neutral—central banks primarily hold gold, not silver |
Silver deserves special attention because it has a dual identity. It behaves partly as a monetary metal—tracking gold’s response to macro forces—and partly as an industrial commodity, tracking demand from manufacturing, electronics, and the solar energy sector. This duality makes silver more volatile than gold and means it usually responds to a wider range of economic signals. During strong economic expansions, silver often outperforms gold. During risk-off or recessionary periods, gold typically outperforms silver.
Gold and Silver Trading Strategies
There is no single correct approach to trading gold and silver. The right strategy depends on your time horizon, risk tolerance, and the market environment. The three frameworks below are the most widely used by active traders across different experience levels.
Note: All examples in this section are hypothetical and for illustrative purposes only. They do not reflect actual trading results or client experiences.
Strategy 1: Intraday Trading Using Support and Resistance
Support and resistance levels are price zones where buying or selling pressure has historically concentrated. For gold and silver traders, daily pivot points calculated from the prior session can provide a potentially objective, data-driven framework for identifying likely turning points during the current session.
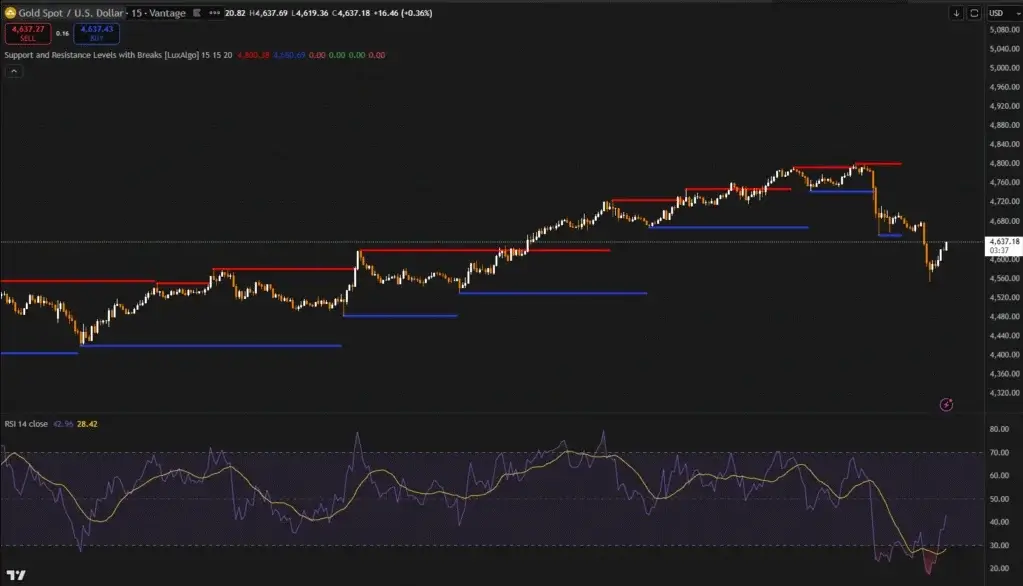
Standard daily pivot calculation:
- Pivot Point (PP) = (Prior High + Prior Low + Prior Close) / 3
- Resistance 1 (R1) = (2 x PP) – Prior Low
- Resistance 2 (R2) = PP + (Prior High – Prior Low)
- Support 1 (S1) = (2 x PP) – Prior High
- Support 2 (S2) = PP – (Prior High – Prior Low)
Hypothetical example: If gold opens near S1, RSI is below 35, and the price holds the support zone across two consecutive hourly candles, a long CFD position with a stop below S2 and a target near the Pivot Point or R1 defines a structured risk-reward trade. The key discipline is defining both the stop-loss and profit targets before entry, not after.
Strategy 2: Trend Following With Moving Averages
Gold and silver can establish sustained directional trends lasting weeks, months, or even years, driven by macroeconomic cycles such as prolonged low interest rate environments or extended periods of geopolitical uncertainty. Trend-following strategies aim to participate in the middle portion of these moves, avoiding the difficulty of predicting exact tops and bottoms.
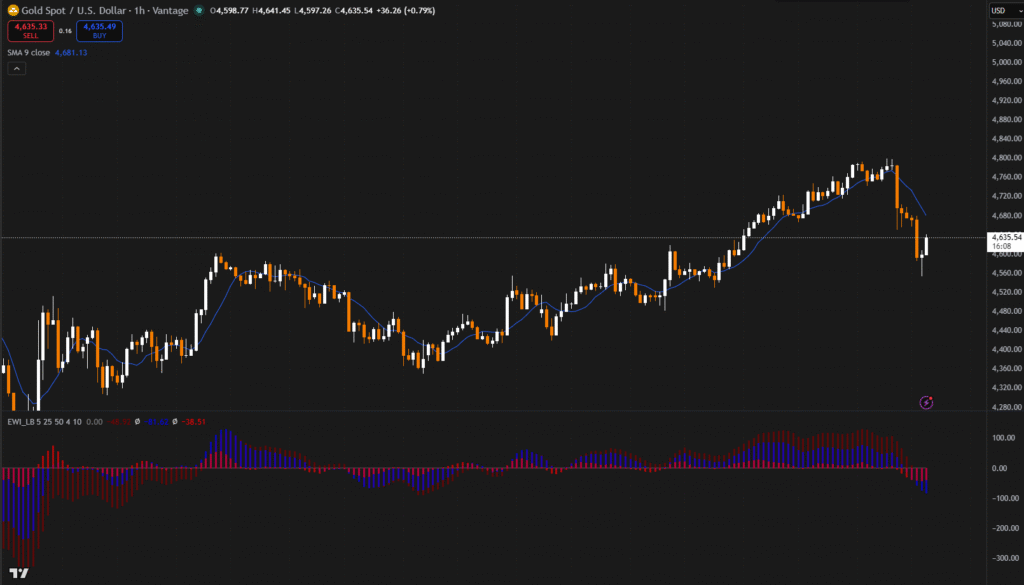
| Gann Signal | Interpretation | Timeframe |
| 50 EMA crosses above 200 EMA (Golden Cross) | Long-term bullish trend confirmed → consider buying on pullbacks to the 50 EMA | Daily |
| 50 EMA crosses below 200 EMA (Death Cross) | Long-term bearish trend confirmed → consider selling rallies to the 50 EMA | Daily |
| Price holds above 20 EMA after a pullback | Short-term uptrend intact → bullish bias maintained | 4-Hour |
| Price closes below 20 EMA on rising volume | Short-term reversal signal → reassess opened long positions | 4-Hour |
| 200 EMA acting as dynamic support | Strong long-term bullish structure → an institutional buying zone | Weekly |
Strategy 3: Pair Trading the Gold-Silver Ratio
The gold-silver ratio divides the gold price per ounce by the silver price per ounce to produce a single number indicating the relative value of the two metals. It’s one of the oldest valuation tools in commodity trading and continues to provide useful signals for traders who follow both markets.
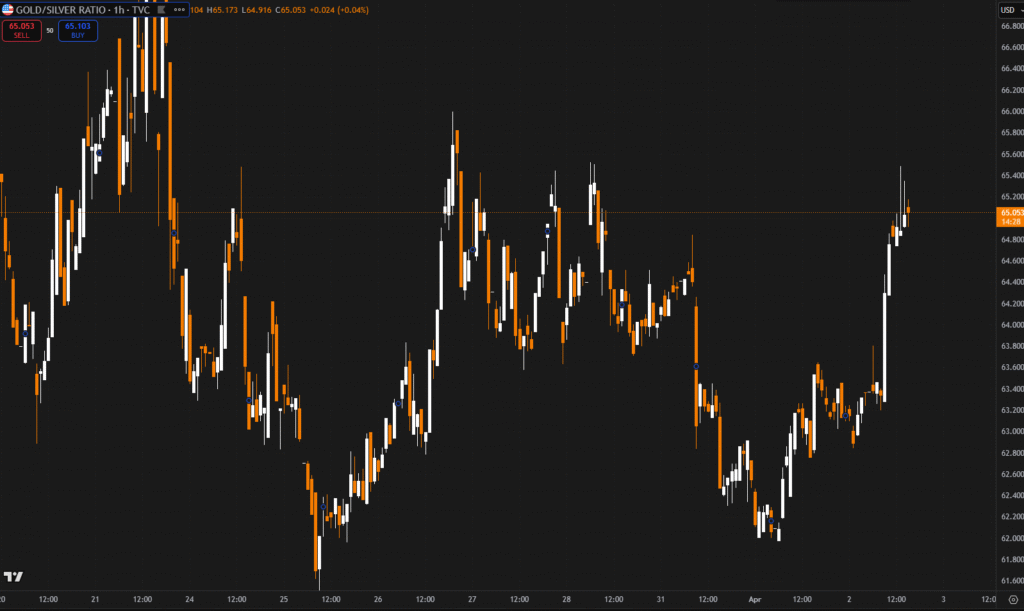
- The ratio has historically ranged between approximately 1:40 and 1:100 in the long term.
- A ratio above 80 suggests silver is historically undervalued relative to gold—some traders shift towards silver exposure.
- A ratio below 50 suggests gold is relatively cheap—some traders shift towards gold exposure.
- The mean reversion thesis: The ratio tends to revert toward its long-term average, creating trading opportunities on both sides.
This is an advanced strategy typically used by experienced traders who monitor both markets simultaneously. It requires careful position management and carries divergence risk as the ratio can move further against a position before reverting. Always assess your total exposure before entering a ratio-based trade.
Technical Analysis for Gold and Silver Traders
Because gold and silver are globally traded with deep institutional participation, technical analysis tends to be particularly effective as key levels are widely watched, reinforcing their significance.
The indicators below are the most commonly used by precious metals traders across different time horizons for trading gold and silver CFDs.
| Indicator | Application to Gold/Silver CFDs | Timeframe |
| RSI (14) | Below 30 suggests oversold conditions; above 70 suggests overbought. Most effective when confirming a price level, not as a standalone signal. | Daily / 4H |
| MACD | Bullish crossover above the signal line indicates building momentum. Histogram turning positive while price holds support is a useful confirmation. | Daily |
| 50 / 200 EMA | Primary trend direction filter. Price trading above both EMAs supports a long bias for CFD positions; below both supports a short bias. | Daily |
| Bollinger Bands | Price touching the lower band during an established uptrend can signal a mean-reversion entry. A band squeeze (narrowing) often precedes a breakout. | 4H / 1H |
| ATR (14) | Used to calibrate stop-loss distances relative to current volatility. A tighter stop during high ATR conditions increases the probability of being stopped out prematurely. | Daily |
| Volume (Futures) | Confirm breakouts with volume. A price breakout from a consolidation range on low volume is less reliable than one accompanied by a volume spike. | Daily |
Global Gold and Silver Trading Hours
Gold and silver spot markets are among the most accessible in the world, trading nearly continuously from Sunday evening (Sydney open) through Friday evening (New York close).
Understanding which session is active can help gold and silver traders anticipate volatility and liquidity conditions.
| Session | Hours (UTC) | What to Expect |
| Sydney/Tokyo | 22:00 – 07:00 | Lowest volatility, thin liquidity. Range-bound price action is common. Asian physical buying can occasionally move silver prices. |
| London Open | 07:00 – 12:00 | Volatility picks up. LBMA benchmark fix at 10:30 UTC for gold. European macro data (ECB decisions, Eurozone CPI) released in this window. |
| London/New York Overlap | 12:00 – 16:00 | Highest liquidity and volatility of the day. Both LBMA and COMEX are active simultaneously. Most significant directional moves occur in this window. |
| New York/COMEX | 13:30 – 20:00 | US economic data releases drive sharp moves. Fed decisions, CPI, and NFP all land during this session. COMEX pit session closes at 17:30 UTC. |
| Post-COMEX/Asian Open | 20:00 – 22:00 | Reduced liquidity. Overnight consolidation is typical unless a major macro surprise has occurred. |
Key Economic Events for Gold and Silver Traders
Certain scheduled data releases and macro developments move gold and silver prices more consistently than others. The table below outlines each key event, the mechanism behind its impact, and its typical directional effect on precious metals.
| Event | Frequency | Why It Matters for Gold and Silver |
| FOMC Interest Rate Decision | 8x per year | The single, most impactful scheduled event for gold. Rate cuts or dovish signals reduce the opportunity cost of holding a non-yielding asset, making gold more attractive. Rate hikes do the opposite. Even the tone of the press conference can move prices by 1% or more within minutes of the announcement. |
| US CPI / PPI (Inflation Data) | Monthly | Gold is a traditional inflation hedge, so a CPI print above expectations typically drives buying. However, if high inflation also raises expectations of aggressive rate hikes, gold can initially sell off as real yields rise. The market reaction depends on what the data implies for Fed policy, not the inflation number alone. |
| Non-Farm Payrolls (NFP) | 1st Friday, monthly | A stronger-than-expected jobs report signals economic health, supports the USD, and reduces Fed rate cut expectations—all headwinds for gold. A weak NFP has the opposite effect. Silver carries additional sensitivity as manufacturing employment data also feeds into industrial demand expectations. |
| US Dollar Index (DXY) | Daily | Because gold is priced in USD globally, a stronger dollar makes it more expensive for non-USD buyers and suppresses demand. A gold rally occurring alongside a falling DXY is generally considered more sustainable than one moving against a rising dollar. |
| US 10-Year Real Yield (TIPS) | Daily | Real yield is the nominal rate minus inflation. When real yields are negative or falling, the cost of holding non-yielding gold is lower. When real yields rise sharply (as in 2022), gold faces sustained selling pressure. Many professional traders monitor TIPS yields daily as a leading directional indicator. |
| Geopolitical Developments | Event-driven | Military conflicts, sanctions, and political instability trigger safe-haven capital flows into gold. These moves can be sharp but are often short-lived, reverting as the initial shock fades. Silver sees a smaller and less consistent safe-haven response, since risk-off sentiment can simultaneously reduce industrial demand expectations. |
| Central Bank Gold Purchases | Quarterly (WGC report) | Central banks—particularly China, Turkey, Poland, and India—have been significant net buyers of gold since 2022 as part of USD reserve diversification. This structural demand provides a long-term support floor. World Gold Council quarterly reports are closely watched for shifts in this buying trend. |
Trading Gold and Silver via CFDs
When you trade a gold or silver CFD, you are entering into an agreement with a brokerage to exchange the difference in price between when you open and close the position. If you believe gold will rise, you open a long position. If you believe it will fall, you open a short position. Your profit or loss is determined by the size of the price move and the size of your position.
Key characteristics of CFD trading for precious metals:
- Go Long or Short: CFDs allow traders and investors to profit from both rising and falling prices, unlike physical ownership.
- Leverage: CFDs are traded on margin, meaning traders only need to deposit a fraction of the total position value. However, take note that leverage amplifies both potential gains and potential losses.
- No Physical Delivery: Traders never take ownership of the metal and all settlement is in cash.
- Near 24-hour Access: Gold and silver CFDs can be traded across all major global sessions.
- Transparent Pricing: CFD prices are derived directly from the underlying LBMA and COMEX benchmarks.
Understanding CFD Contract Specifications
Before placing a CFD trade on gold or silver, understanding the contract specifications helps traders calculate their actual exposure and margin requirement for any given position size.
| CFD Instrument | Underlying Benchmark | Standard Lot Size | Pip Value (per lot) | Key Session |
| Gold Spot (XAU/USD) | LBMA / COMEX spot | 100 troy oz | $0.01/oz = $1.00 | London / New York overlap |
| Silver Spot (XAG/USD) | LBMA / COMEX spot | 5,000 troy oz | $0.001/oz = $5.00 | New York session |
| Gold Mini CFD | COMEX / LBMA spot | 10 troy oz | $0.01/oz = $0.10 | All sessions |
| Gold Futures CFD (GC) | COMEX front-month | 100 troy oz | $0.10/oz = $10.00 | COMEX hours |
| Silver Futures CFD (SI) | COMEX front-month | 5,000 troy oz | $0.005/oz = $25.00 | COMEX hours |
Whether you are trading gold and silver through a CFD platform, ETFs, or any other method, the same core disciplines apply. A structured approach can help reduce the likelihood of costly early mistakes.
How to Start Trading Gold and Silver with Vantage
- Educate yourself on how gold and silver prices are formed and what macroeconomic factors drive them before risking any capital.
- Choose your trading method based on your time horizon, risk tolerance, and access to markets.
- If trading CFDs, open an account with Vantage and familiarise yourself with the specific contract specifications for the instruments you plan to trade.
- Fund your account only with capital you can afford to lose entirely. Never use funds needed for living expenses or other financial commitments.
- Use a charting platform such as TradingView to identify your trade setup, key levels, and indicator signals before opening the order screen.
- Define your entry price, stop-loss, and take-profit target before placing the order, not after the position is open.
- Apply consistent position sizing. Many professional traders risk no more than 1-2% of total trading capital on any single trade.
- Keep a trading journal recording the rationale for each entry and exit, and review it regularly to identify patterns in your decision-making.
Frequently Asked Questions
What is the difference between trading gold and owning physical gold?
Physical gold ownership means traders and investors hold the metal directly through coins, bars, or allocated storage, and their return is determined purely by price appreciation. Active trading, whether through ETFs, futures, or CFDs, means traders are speculating on price movements over a shorter time horizon. Instruments like CFDs also allow one to go short (profit from falling prices) and use leverage, which is not possible with physical gold. The trade-off is that leveraged trading carries significantly higher risk than holding physical metal as a long-term asset.
How does leverage work when trading gold CFDs?
Leverage allows traders to control a larger position than their deposited margin would otherwise permit. For example, with 1:20 leverage, a $5,000 margin deposit can control a $100,000 notional position. While this amplifies the potential return on a winning trade, it equally amplifies losses on a losing trade. A 1% adverse move on a $100,000 position produces a $1,000 loss, representing a 20% loss on your $5,000 margin. Understanding and managing leverage is the most important skill in CFD trading.
What drives gold prices more than anything else?
The three variables with the most consistent and well-documented impact on gold prices are: US real yields (nominal rates minus inflation), the US Dollar Index (DXY), and Federal Reserve monetary policy. When real yields fall and the dollar weakens, gold tends to rise. When real yields rise and the dollar strengthens, gold tends to fall. Geopolitical risk and central bank buying add additional layers, but the real yield and DXY relationship is the most reliable daily indicator for gold direction.
Why is silver more volatile than gold?
Silver’s higher volatility stems from its dual role as both a monetary metal and an industrial commodity. Roughly 50-60% of annual silver demand comes from industrial uses in electronics, solar panels, medical applications, and chemical processes. This means silver responds not only to macro risk sentiment (like gold) but also to global manufacturing output and industrial growth expectations. The silver market is also significantly smaller than gold in total value, meaning relatively smaller capital flows can create larger percentage price moves.
What is the difference between trading gold spot CFDs and gold futures CFDs?
Gold spot CFDs track the current market price and carry overnight swap/financing charges if held beyond the daily close, making them best suited to intraday or short-term positions. Gold futures CFDs are based on a specific futures contract expiry and typically have no daily swap charge, but the price includes a premium (contango) or discount (backwardation) relative to spot. Futures CFDs are often preferred for medium-term directional trades. Both instruments offer leverage and short-selling capability.
CFDs and Spreadbets are complex instruments and come with a high risk of losing money rapidly due to leverage. 70.98% of retail investor accounts lose money when trading CFDs and Spreadbets with this provider. You should consider whether you understand how CFDs and Spreadbets work and whether you can afford to take the high risk of losing your money.
Vantage is a trading name of Vantage Global Prime LLP which is authorised and regulated by the Financial Conduct Authority. FRN: 590299
The information has been prepared as of the date published and is subject to change thereafter. The information is provided for educational purposes only and doesn't take into account your personal objectives, financial circumstances, or needs. It does not constitute investment advice. We encourage you to seek independent advice if necessary. The information has not been prepared in accordance with legal requirements designed to promote the independence of investment research. No representation or warranty is given as to the accuracy or completeness of any information contained within. This material may contain historical or past performance figures and should not be relied on. Furthermore estimates, forward-looking statements, and forecasts cannot be guaranteed. The information on this site and the products and services offered are not intended for distribution to any person in any country or jurisdiction where such distribution or use would be contrary to local law or regulation.